A comprehensive paragraph describing the participants in the study (from Week 2)A paragraph describing the major dependent variables of interest (recall and misinformation effect). Be sure to review t
DESCRIPTIVE STATISTICS 4
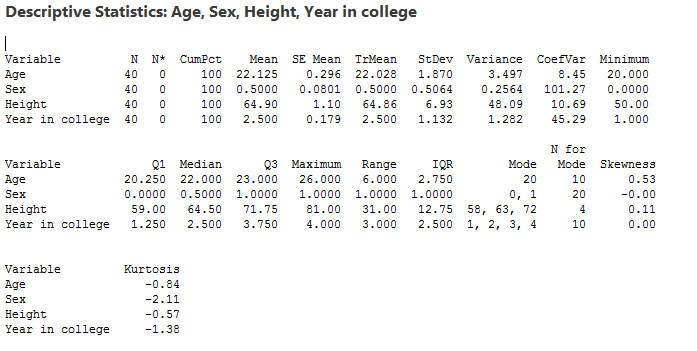
Descriptive statistics
Casey Johnson
South University
Descriptive statistics can be useful for two purposes:
1) To provide basic information about variables in a dataset and
2) To highlight potential relationships between variables.
Basic statistics used to describe and summarize data. Descriptive statistics generally include measures of the average values of variables (mean, median, and mode) and measures of the dispersion of variables (variance, standard deviation, or range).
Mean -- the sum of a variable's values divided by the total number of values
Median -- the middle value of a variable
Mode -- the value that occurs most often
Range is simply the difference between the smallest and largest values in the data. The interquartile range is the difference between the values at the 75th percentile and the 25th percentile of the data.
Variance is the most commonly used measure of dispersion. It is calculated by taking the average of the squared differences between each value and the mean.
Standard deviation, another commonly used statistic, is the square root of the variance.
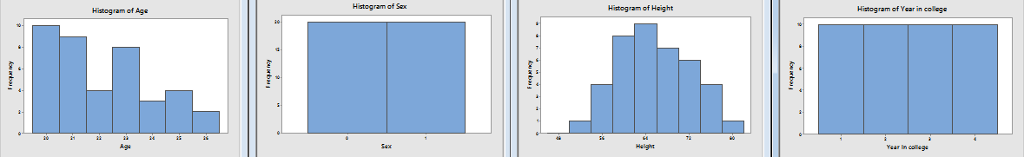
Histograms:
Visually represent the frequencies with which values of variables occur
Each value of a variable is displayed along the bottom of a histogram, and a bar is drawn for each value
The height of the bar corresponds to the frequency with which that value occurs.
Histogram of Age, Sex, Height and Year in college are as follows:
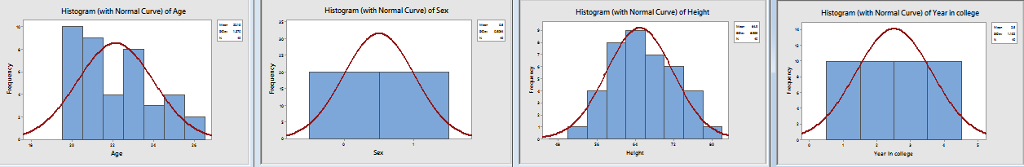
Histogram (with Normal Curve) of Age, Sex, Height and Year in college are as follows:
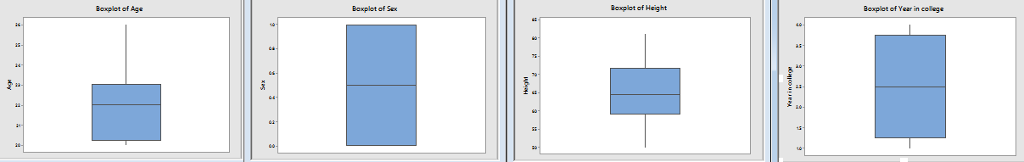
Boxplot of Age, Sex, Height and Year in college are as follows: