1. Statistic homework in excel.2.See attach file.
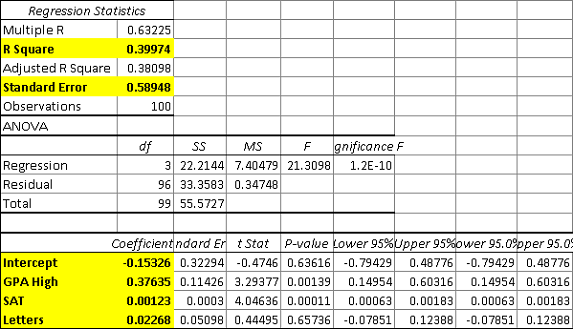
The above regression table was formed using the High school GPA, SAT scores, and Quality of letters as the X variables to predict College GPA (Y variable). Let X1 = High school GPA, X2 = SAT scores, X3 = Quality of letters, and Y = College GPA. Answer questions 1 to 12.
1. Use the coefficients (highlighted) on the table and the variables, X1, X2, X3, and Y to form a multiple regression equation. Which of the following is true of that equation? ( Round the coefficients to four decimal places) (6.25 points)
 a. - 0.1533Y = 0.3764X1 + 0.0012X2 + 0.0227X3
- b. Y = - 0.1533 + 0.3764X1 + 0.0012X2 + 0.0227X3
- c. Y = 0.3764X1 + 0.0012X2 + 0.0227X3 + 0.1533
- d. Y = 0.3764X3 + 0.0012X2 + 0.0227X1 - 0.1533
2. The coefficient, – 0.1533, is also known as the: (6.25 points)
- a. X – intercept
- b. Slope
- c. Y – intercept
- d. Ratio
3. The coefficients,( 0.3764, 0.0012, and 0.0227), are also known as: (6.25 points)
- a. X – intercepts
- b. Slopes
- c. Y – intercepts
- d. Ratios
4. What would be the interpretation for the coefficient GPA High = 0.3764? (6.25 points)
- a. For 0.3764 point increase in High school GPA we expect a 1 point increase in College GPA.
- b. For each point increase in High school GPA we expect a 0.3764 point increase in College GPA.
- c. For each point increase in High school GPA we expect a 0.3764 point decrease in College GPA.
- d. For each point increase in High school GPA we expect a 0.3764 point increase in SAT score.
5. What would be the interpretation for the coefficient SAT = 0.0012? (6.25 points)
- a. For each point increase in SAT score we expect a 0.0012 point increase in High school GPA.
- b. For a 0.0012 point increase in SAT score we expect a 1 point increase in College GPA.
- c. For each point increase in High school GPA we expect a 0.0012 point decrease in College GPA.
- d. For a 100 points increase in SAT score we expect a 0.1 point increase in College GPA.
6. What is the interpretation of the number – 0.153? (6.25 points)
- a. The intercept decrease by 0.153 when all the coefficients are equal to zero.
- b. The College GPA decreases by 0.153 when the High school GPA, SAT scores and Quality of letters equal to zero.
- c. The College GPA is equal to 0.153 when the High school GPA, SAT scores and Quality of letters equal to zero.
- d. The intercept has no interpretation here (it is impossible to have a student with 0 high school GPA and 0 SAT going to college).
7. Using the regression table above set up the multiple regression equation if X1 = 3.2, X2 = 1400, and X3 = 8. Which of the following equation is correct? (6.25 points)
- a. - 0.1534Y = 0.3764*3.2 + 0.0012*1400 + 0.0227*8
- b. Y = - 0.1534 + 0.3764*3.2 + 0.0012*1400 + 0.0227*8
- c. Y = 0.3764*3.2 + 0.0012*1400 + 0.0227*8 + 0.1534
- d. Y = 0.3764*8 + 0.0012*1400 + 0.0227*3.2 - 0.1534
8. Using the regression table above (round the coefficients to four decimal places) what would be the predicted College GPA of Mary Smith whose High school GPA = 3.4, SAT scores = 1600, and Quality of letter = 9. (Round the answer to 2 decimal places) (6.25 points)
- a. 3.25
- b. 3.56
- c. 3.65
- d. 3.86
9. This prediction comes with certain error estimate. What is it from the regression table above? (6.25 points)
- a. R
- b. R square
- c. Standard error
- d. Slope
10. With this error estimate what is the predicted interval of Mary Smith’s College GPA whose High school GPA = 3.4, SAT scores = 1600, and Quality of letter = 9. (Round the coefficients to four decimal places to compute and round the answer to 2 decimal places.) (6.25 points)
- a. [2.66, 3.84]
- b. [2.97, 4.0]
- c. [2.66, 4.0]
- d. [2.86, 3.96]
11. If Mary Smith increases her high school GPA by 0.5 point how much higher would be her predicted College GPA? (Round the answer to two decimal places.) (6.25 points)
- a. 0.19
- b. 0.25
- c. 0.52
- d. 1.00
12. If Mary Smith and Karen White have identical SAT score and Quality of letter, but Mary Smith’s High school GPA is 1.5 point higher than Karen’s, how much higher will Mary’s College GPA be than Karen’s? (Round the answer to two decimal places.) (6.25 points)
- a. 0.25
- b. 0.36
- c. 0.45
- d. 0.56
Upload the Sailboats data, make the regression table (i.e. click on Data, use Data Analysis, Regression and just highlight the length column for the x variable and the weight column for the y variable.) Use the table created to answer questions 13 to 16. Note the units for the weight. (Pick the closest answer)
13. What is the predicted weight for a sail boat that is 35 feet long? (Pick the closest answer) (6.25 points)
- a. About 17 pounds
- b. About 20 pounds
- c. About 17,400 pounds
- d. About 20,000 pounds
14. This prediction comes with certain error estimate. Using this error estimate what is the interval prediction for this weight? (Pick the closest answer) (6.25 points)
- a. About [13, 22] pounds
- b. About [13000, 22000] pounds
- c. About [15, 25] pounds
- d. About [15000, 25000] pounds
15. What is the interpretation of the slope 1.0129? (6.25 points)
- a. For each pound increase the boat’s length increases by 1.0129 feet.
- b. For each pound increase the boat’s length increases by 1012.9 feet.
- c. For each foot increase the boat’s weight increases by 1.0129 pounds.
- d. For each foot increase the boat’s weight increases by 1012.9 pounds.
16. What is the interpretation for the coefficient, –18.016? (6.25 points)
- a. The X-intercept has no real life interpretation here (no sailboat is 0 feet long).
- b. The Y-intercept has no real life interpretation here (no sailboat is 0 feet long).
- c. The slope has no real life interpretation here (no sailboat is 0 pound).
- d. The slope has no real life interpretation here (no sailboat is 0 feet long).


