1. Statistic math in excel
The max grade for this lab is 110 but the scale is still 100 points. The 10 points are extra credit.
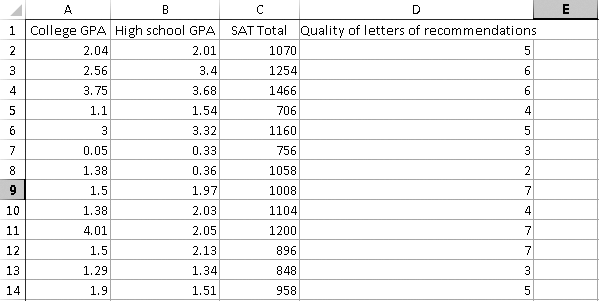
Open SAT data, and convert it into the following format.
Multiple regression.
See related videos here.
Click on “Data analysis,” then “Regression”
In dialog box for the input X-variables highlight all three columns. High school GPA, SAT, and Letters (and do not forget to include Labels)
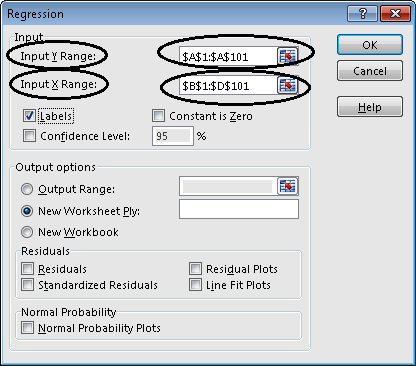
In dialog box for Y-variable highlight the College GPA, click on the tab Labels, and then OK.
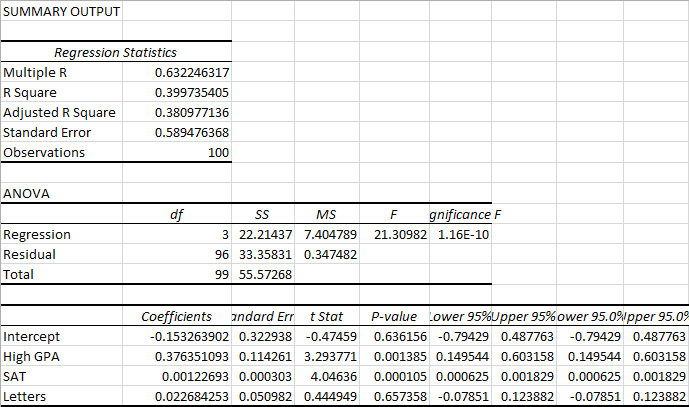
This table should appear:
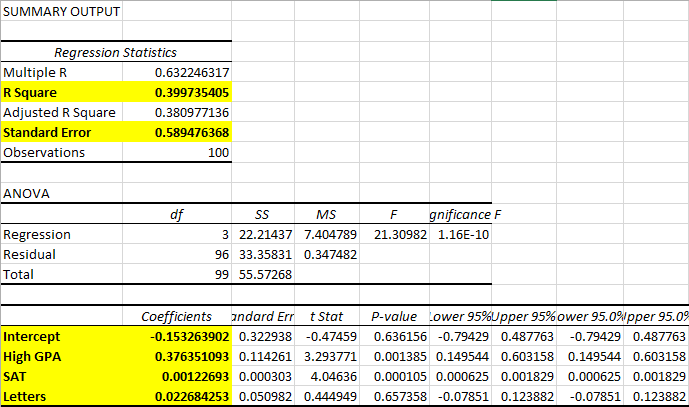
Important numbers are highlighted
R-square tells us about overall fit (0.399 being moderately good because R = Square Root(0.399735) = 0.632).
Coefficients (y intercept and slope of each of the variable) are used for prediction.
Example: Student with High school GPA = 3 and SAT = 1300 and letters = 9 is predicted to have College GPA = – 0.15326 + 3*0.37635 + 1300*0.0012269 + 0.022684*9 = 2.774957.
Standard error is 0.589 and interpretation is: This student is predicted to have College GPA = 2.7749 and the error of this prediction is approximately ± 0.589.
Task: Compute the prediction for a student that has High school GPA = 4 and SAT = 1200 and letters = 9 (Answer = 3.0286).
Task: Give the interval prediction that includes the standard error (Answer: Predicted GPA will most likely be within the interval 3.0286 ± 0.598 or between [2.439, 3.618] ≈ [2.44, 3.62].
Lab 5 / Task 1
Practice Task 2
Use the SAT data and create a multiple regression table but this time as input use ONLY two variables: Letters and SAT. Answer questions 1 to 4. Choose the best fitting answer. Note: numbers are truncated unless specified.
1. If an incoming student has a letter score = 8 and SAT = 1300 what would his predicted College GPA be?
 a. 1.84
- b. 2.65
- c. 2.93
- d. 2.79
2. What is the approximate error of this prediction?
- a. 0.61
- b. 0.63
- c. 0.57
- d. 0.33
3. If this student decreases his SAT by 150 points how much would the student's predicted college GPA change?
- a. 0.46
- b. - 0.24
- c. 0.33
- d. - 0.54
4. If two students have the identical SAT but one has a Letter score 1 points higher than the other, how much higher will his College GPA be?
- a. It will be the same.
- b. 0.12
- c. 0.0012
- d. 0.001
Use the Tornadoes data. Your TASK is to use the months of January and February to predict the tornado activity in April. Answer questions 5 to 7. Choose the best fitting answer. Note: numbers are truncated unless specified.
5. If January had 100 tornadoes and February had 200 tornadoes, what would be your prediction for the number of tornadoes in April?
- a. 67.04
- b. 98.93
- c. 189.17
- d. 326.57
6. What is the approximate error of this prediction?
- a. 60.44
- b. 38.19
- c. 51.23
- d. 46.00
7. The intercept here has a value of 97.24. What is the STATISTICAL interpretation of this number?
- a. This is the predicted number of tornadoes in April when January and February have 100 and 200 tornadoes, respectively.
- b. This is the predicted number of tornadoes in April when January and February have zero tornadoes.
- c. This is the X-intercept.
- d. No interpretation.
Use the Cars04 data. Your TASK is to use engine’s size (liters), weight (pounds), and amount of horsepower in order to predict the retail price. Answer questions 8 to 10. Choose the best fitting answer. Note: numbers are truncated unless specified.
8. The overall prediction (Fit) is:
- a. Poor
- b. Good
- c. Very Good
- d. Excellent
9. What is the approximate error of this prediction? (round to 2 decimal places)
- a. 2819.89
- b. 1011.65
- c. 8955.46
- d. 8004.69
10. If two cars are such that both are of the same engine size but car A has 50 more horsepower while car B is heavier by 200 pounds. Which of the two cars would have a larger predicted price?
- a. They have approximately equal prices
- b. Car A
- c. Car B
- d. Not applicable


