1. Statistic math homework through Excel
Homework 7 / Task 1
Task 2
Use Tornadoes-HW6 data. Your TASK is to use the months of June and July to predict the tornado activity in September. Answer questions 1 to 3. Choose the best fitting answer.
1. If June had 50 tornadoes and July had 100 tornadoes what would be your prediction for the number of tornadoes in September? Round to the nearest integer (6.25 points)
 a. 22
a. 22- b. 35
- c. 28
- d. 27
2. What is the approximate error of this prediction? Round to two decimal places (6.25 points)
- a. 0.43
- b. 0.18
- c. 0.143
- d. 23.91
3. The intercept here has a value of 13.48979. What is the STATISTICAL interpretation of this number? (6.25 points)
- a. Predicted number of tornadoes when June and July have 50 and 100 tornadoes, respectively.
- b. No interpretation
- c. This is the X-intercept.
- d. Predicted number of tornadoes in September when June and July have zero tornadoes.
Use Cars04-HW6 data. Your TASK is to use Cylinders, Horsepower, and CityMPG in order to predict the retail price. Answer questions 4 to 6.
4. The overall prediction (Fit) is: (6.25 points)
- a. Very Good
- b. Decent
- c. Poor
- d. Excellent
5. What is the approximate error of this prediction? Round to two decimal places (6.25 points)
- a. 8074.37
- b. -28692.6
- c. 0.86
- d. 0.74
6. If two cars are such that both are of the same CityMPG but car A has 2 cylinders more than car B while car B has 50 Horsepower less than car A. Which of the two cars would have a larger predicted price? (6.25 points)
- a. Car A
- b. Car B
- c. Approximately equal price
- d. Not applicable
Use Cars04-HW6 data. Construct the Summary Statistic table for the retail price of all Volvo models column. Refer to task 4 of Lecture 13 on how to construct Summary Statistic Answer questions 7 to 10.
7. Which numbers describe the center of the data? Round to two decimal places (6.25 points)
- a. 1992.15
- b. 20075
- c. 25635
- d. 37526.67
8. How many Volvos are in this study? (6.25 points)
- a. 6
- b. 8
- c. 9
- d. 10
9. What is the approximate variation of the Volvo’s retail price? Round to two decimal places (6.25 points)
- a. 5976.45
- b. 5478.94
- c. 5039.12
- d. 1992.15
10. What was the lowest Volvo’s retail price recorded? Round to two decimal places (6.25 points)
- a. 42573
- b. 39876
- c. 35542
- d. 25635
Use US_Crime-HW7 data to extract 4 columns of data: Assault, Rape, Larceny, and Murder for New York. Your task is to use multiple regression and predict the Murder count based on the other three variables. Create the appropriate regression table and answer the questions 11 to 14. Numerical answers are rounded so choose the answer that matches the best.
11. What is the standard error and what would be a one sentence interpretation of this number? Round it to the nearest integer (6.25 points)
- a. 304; Our prediction for the number of murders should be enlarged by 304 murders.
- b. 304; Number of murders.
- c. 304; Our prediction for the number of murders will be accurate plus/minus 304 murders.
- d. 304; Number of predicted murders if other crimes are zero.
- e. None of these.
12. What is the coefficient next to Rape and what would be a one sentence interpretation of this number? (6.25 points)
- a. 0.144932; For each Rape the number of Murders increases by this amount.
- b. 0.144932; In a case of zero Rapes we expect this amount of Murders.
- c. 0.144932; When Rapes are zero the intercept is 0.144932.
- d. 0.144932; For each Murder the number of Rapes increases by this amount.
- e. None of these.
13. What is the statistical interpretation of the number -136.227? (6.25 points)
- a. It tells us how accurate is the prediction.
- b. It is negative so it does not offer any statistical prediction.
- c. It is the X-intercept of the line.
- d. It tells us the number of murders if there are zero Assaults, Larceny, and Rapes.
- e. None of these.
14. Give an interval prediction of the murder count in New York if there existed 65000 counts of assault, 615000 counts of Rapes, and 20000 counts of larceny. Round to two decimal places (6.25 points)
- a. [88802.25, 89410.07]
- b. [88938.48, 89546.29]
- c. [88888.19, 89496]
- d. [89074.71, 89682.52]
- e. None of these
Answer questions 15 & 16 on P value and R square.
15. Which statement is false about P-value? (6.25 points)
- a. P-value tells us if a particular variable is significantly related to a Y-variable.
- b. P-value tells us what the approximate error of our prediction is.
- c. P-value does not tell us the strength of the relation between the variables.
- d. The P-Value rule of thumb is that the smaller the P-value the better. Typically less than 5% or 1% is acceptable.
16. Which statement is false about R-Square? (6.25 points)
- a. R-Square tells us how strong the relation is between the input and output variables (input could be multi-dimensional).
- b. R-Square does not tell us if this relation is significant or not.
- c. R-Square tell us how much the predicted variable Y will change if a particular input variable increases by one unit.
- d. R-Square cannot be a negative value.
Use the US_CRime.txtdata to extract 4 columns of data: Murder, Robbery, Larceny, and Burglary for Louisiana. Your task is to use multiple regression and predict the Murder count based on the other three variables. Create the appropriate regression table and answer the questions. Numerical answers are rounded so choose the answer that matches the best:
What is the standard error and what would be a one sentence interpretation of this number?
- a. 66; Our prediction for the number of murders should be increased by 66 murders.
- b. 46; Our prediction for the number of murders will be accurate plus/minus 46 murders.
- c. 66; It is the number of murders.
- d. 46; It is the number of predicted murders if other crimes are zero.
- e. None of these
2. What is the coefficient next to Robbery and what would be a one sentence interpretation of this number?
- a. 0.0555; For each murder, the number of robberies increases by this amount.
- b. 0.0555; This is the number of robberies when the expected number of murder is zero
- c. 0.0555; When the number of robberies are zero, the expected number of murder increases by this amount.
- d. 0.0555; For each 100 robberies the number of Murders increases by 100 times this amount.
- e. None of these
3. What is the statistical interpretation of the number 208.53?
- a. Our prediction for the number of murders will be accurate plus/minus 208.53 murders.
- b. When there are no robberies, larcenies and burglaries this is the predicted number of murders.
- c. It is the predicted sum of robberies, larcenies and burglaries when there is no murder.
- d. This number does not serve any meaningful statistical interpretation.
- e. None of these
4. Give an interval prediction of the murder count in Louisiana if we recorded 35000 counts of robbery, 525000 counts of larceny, and 113500 counts of burglary.
- a. [1473.26, 1605.76]
- b. [1681.79, 1814.29]
- c. [2561.37, 2693.87]
- d. [2352.84, 2485.34]
- e. None of these
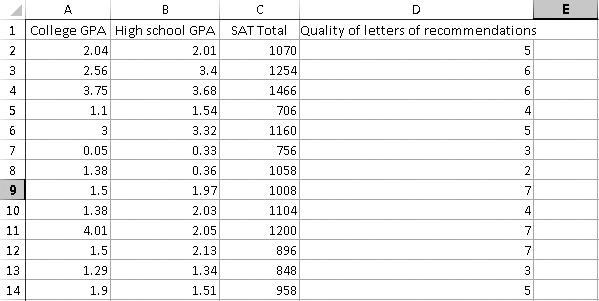
Open SAT data.
Multiple Regression
Click on Data analysis, then Regression.
In the dialog box for the input X-variables highlight all three columns: High School GPA, SAT, and Letters (and do not forget to include Labels)
In the dialog box for Y-variable highlight College GPA and click on the tab Labels and then OK.
This table should appear:
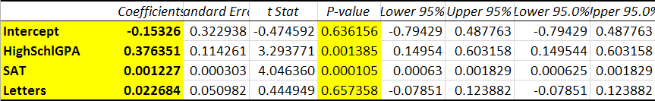
Multiple Regression
Also see Video.

Since the letters had a P-value of 0.65 which is bad (that is larger than 0.05) we will need to re-do the analysis.
Repeat the regression but now using ONLY two columns for the input X-variables highlighted columns. High School GPA and SAT scores--NOT the Letters (and do not forget to include Labels).
In the dialog box for Y-variable highlight College GPA and click on the tab Labels and then OK.
This table should appear:
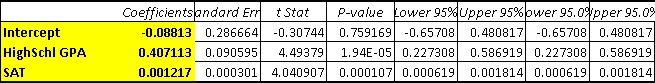
Use the SAT data and via Multiple regression select the two variables that predict College GPA the best. Make another table with these two variables and answer the questions based on this table. Numerical answers are rounded so choose the answer that matches the best:
5. What is the predicted College GPA for the student with High School GPA = 4, SAT = 1000, and Letters = 10?
- a. 2.76
- b. 1.96
- c. 2.85
- d. 3.20
6. What is the standard error of this prediction? Give the interval prediction.
- a. 0.587; [2.17, 3.34]
- b. 0.587; [1.38, 2.55]
- c. 0.587; [2.26, 3.43]
- d. 0.587; [2.61, 3.79]
7. What is the coefficient of SAT and what is the interpretation?
- a. 0.000107: It is a good P-value of SAT.
- b. 0.000301: The predicted error of SAT score.
- c. 0.000619: For an additional 100 points scored on the SAT a student’s college GPA increases by 0.0619.
- d. 0.001217: For an additional 100 points scored on the SAT, a student’s college GPA increases by 0.1217.
8. If student A’s High School GPA is 0.75 point higher than student B’s, and on the other hand, student B’s SAT score is higher than student A by 300 points, which of the two students will have higher predicted College GPA and by how much?
- a. Student B by 0.18 points
- b. Student B by 0.06 points
- c. Student A by 0.4 points
- d. Student A by 0.27 points
Use the HousePrice data and via multiple regression select the two variables that predict the house selling price the best. Make another table with these two variables and answer the questions. Numerical answers are rounded so choose the answer that matches the best:
9. Identify the largest coefficient. What is its value and what is the interpretation of this number? (Choose the most appropriate answer. Note: numbers are truncated.)
- a. 4.41; This is the amount in thousands that the selling price of a new house will increase.
- b. 5.97; This shows how much the selling price correlates with the age of the house
- c. 5.97; For each additional bathroom the selling price of the house increase by 5.97 hundred thousand dollars.
- d. 4.41; For each additional bathroom the selling price of the house increase by 4.41 hundred thousand dollars.
10. Which of the two variables has better P-value and what is this P-value? (Note: numbers are truncated.)
- a. Age has better P-value; P-value = 0.067
- b. The higher the P-value, the better; so a P-value = 0.416 is very good.
- c. #Rooms has better P-value; P-value = 0.043
- d. None of the choices
11. Using this second table predict the selling price of a house that is 7 years old and has 2 bathrooms.
- a. 11.69 hundred thousands
- b. 12.68 hundred thousands
- c. 10.06 hundred thousands
- d. 12.58 hundred thousands
12. Based on the table would you characterize the Regression fit and the prediction as Poor, Good, Very Good, or Excellent?
- a. Poor
- b. Good
- c. Very Good
- d. Excellent
Use the CO2 data and via Multiple regression select the two variables that predict the CO2 level with the best P-value. Make another table with these two variables and answer the questions. Numerical answers are rounded so choose the answer that matches the best:
Answer the questions for Assessment:

13. What are the two selected variables?
- a. Hour and Traffic
- b. Wind and Traffic
- c. Hour and Wind
14. Which of the variables has a better P-value and what is this P-value? (Note: numbers are truncated.)
- a. Traffic; 0.018
- b. Traffic; 6.85E-12
- c. Wind; 0.0056
- d. Wind; 0.174
15. Based on the table, how would you characterize the Regression fit?
- a. Poor
- b. Good
- c. Excellent
16. What is another name for the coefficient 1.274461 and what is its interpretation based on the data?
- a. The X-intercept; when the average weekday traffic density and the perpendicular wind-speed component are zero.
- b. The slope of an average summer weekday's CO2 concentration. It is how much the CO2 concentration will increase when both the average weekday traffic density and the perpendicular wind-speed component increase by 1 unit.
- c. The Y-intercept; It is how much the CO2 concentration will increase when both the average weekday traffic density and the perpendicular wind-speed component are zero.
- d. The Y-intercept; it is the average summer weekday CO2 concentration when the average weekday traffic density and the perpendicular wind-speed component are zero.
- e. None of these
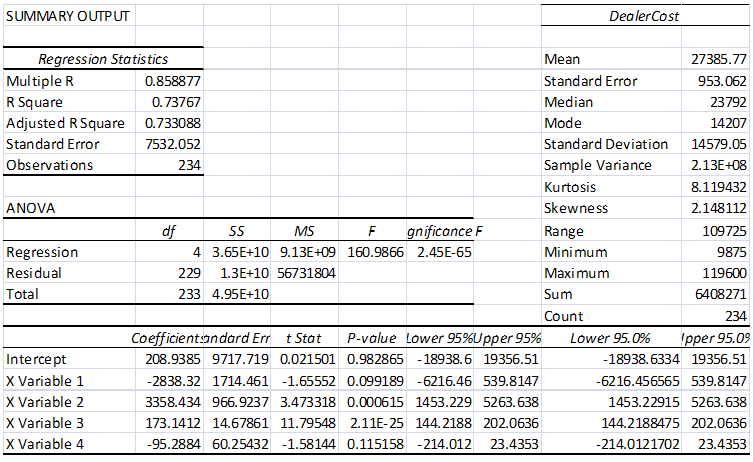
The above two tables are related to the variable, DEALER COST. The first is a regression table with 4-variables predicting the DEALER COST while the second table contains the Summary statistics related to DEALER COST data. Answer the questions (choose the most appropriate answer):

17. If Variable 2 increases by 10 units, according to the table what would happen to the prediction?
- a. The DEALER COST will be about 208.93
- b. Since Standard Error is 7532 the DEALER COST will be between 3358.4 – 7532 and 3358.4 +7532.
- c. No conclusion because R-squared is too large.
- d. DEALER COST will increase by 1731.4.
- e. None of these.
18. If all 4 variables increase by 2 unit, according to the table what would happen to the prediction? (numbers are rounded)
- a. The DEALER COST would be approximately 597.97 units.
- b. The DEALER COST would increase by approximately 597.97 units.
- c. The DEALER COST would increase by approximately 1196 units.
- d. The DEALER COST would be approximately 1196 units.
- e. None of the above.
19. What was the highest observed DEALER COST? (Note: numbers are rounded.)
- a. 23792
- b. 14579
- c. 7532
- d. 119600
- e. none of the above
20. Which number should be used in order to answer the question: Is Variable 2 related to DEALER COST?
- a. 3358.4
- b. 7532
- c. 0.0006
- d. 0.737
- e. None of these
21. Once a prediction is made, we often provide a range where we believe the true value will lie. What number is used to construct this range?
- a. 3358.4
- b. 0.858
- c. 0.737
- d. 0.0006
- e. None of these
22. Which number describes the average of the variable, DEALER COST, the best?
- a. 27385.77
- b. 7532
- c. 14579
- d. 0.737
- e. None of these


