Hand-in Checklist 1. Question 1: Answers to questions b) and c) Exhibit 1-A Exhibit 1-B 2. Question 2: Answers to questions a) through g) Exhibit 2-A...
Hand-in Checklist
Question 1:
Answers to questions b) and c)
Exhibit 1-A
Exhibit 1-B
Question 2:
Answers to questions a) through g)
Exhibit 2-A
Exhibit 2-B
Exhibit 2-C
Question 3:
Answers to all questions a) through c).
Exhibit 3-A.
Exhibit 3-B.
Note all answers and Exhibits should be a part of a word or a pdf file. No Exhibits or answers should be embedded in an Excel file. In addition, please upload your Excel file containing your model for question 3. It will not be directly graded, but may help in assigning partial credit.
Problem 1 – Electronic cars
Reykjavik is considering replacing its fleet of gasoline-powered automobiles with electric cars. The manufacturer of the electric cars claims that Reykjavik municipality will experience significant cost savings over the life of the fleet if it chooses to pursue the conversion. If the manufacturer is correct, the city will save about $1.5 million. If the new technology employed within the electric cars is faulty, as some critics suggest, the conversion to electric cars will cost the city $675,000. A third possibility is that less serious problems will arise and the city will break even with the conversion. A consultant hired by the city estimates that the probabilities of these three outcomes are 0.3, 0.3, and 0.4, respectively.
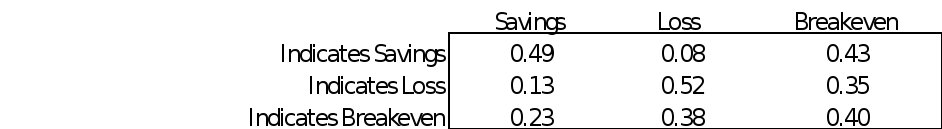
The city has an opportunity to implement a pilot program that would indicate the potential cost or savings resulting from a switch to electric cars. The pilot program involves renting a small number of electric cars for three months and running them under typical conditions. This program would cost the city $75,000. The city’s consultant believes that the results of the pilot program would be significant but not conclusive. Specifically, the table below summarizes the probabilities of actual outcomes (along top), given the pilot program indication (along side). For example the first row of the table indicates that if the pilot study indicates savings, then there is a 49% chance that a conversion to electric cars actually results in a savings of $1.5 million, 8% chance that the conversion will result in a loss and a 43% chance that the conversion will break even.
Based on past experience on pilot studies in other cities in similar climate, there is a 37%, 23% and a 40% chance that the pilot study will indicate savings, loss and breakeven respectively.
The city is interested in maximizing its expected savings.
Implement this scenario as a decision tree in PrecisionTree and compute the city’s optimal decision.
Cut and paste the image of this tree as Exhibit 1-A.
State the optimal decision strategy in words.
Conduct a one-way sensitivity analysis on the cost of hiring the market research firm and determine the maximum value for which it makes sense to hire the market research firm. Attach the strategy region graph as Exhibit 1-B.
Problem 2 – Dog Breeder
A large breeder of a particular type of dog wishes to determine the quantities of available types of dog food that he should stock so that he can be assured that his dogs meet their nutritional requirements, but at the least cost possible. He has decided that he can do this by deciding the requirements of each type of feed for a single dog during one day of operation (he will multiply by the number of days and number of dogs later). The number of units of each type of basic nutritional ingredient contained within a kilogram of each feed type is given in the following table, along with the daily nutritional requirements. The feed costs per kilogram are shown on the bottom row.
| Nutritional Ingredient | Corn based feed | Animal product based feed | Vegetable protein based fee | Minimum Daily Requirement |
| Carbohydrates | 90 | 20 | 40 | 200 |
| Protein | 30 | 80 | 60 | 180 |
| Vitamins | 10 | 20 | 60 | 150 |
| Cost ($) | $4.20 | $3.60 | $3.00 |
Define the decision variables (and give them names like x, y, z, etc. using as many variables, and names, as you need; also provide units for each).
Define the constraints using the variables you defined.
Using the variables you defined, define the objective function and whether you want to maximize or minimize it.
Implement your model in Excel – what is the optimal solution (please specify the both the value of your decision variables and your objective function).
Include a readable printout of your model, showing both formulas and row and column headings as Exhibit 2-A.
Suppose there were a vitamin pill available that provides 10 units of vitamin, and costs $.10 per pill. Without solving the model again, would you consider buying these?
Why or why not (base your argument on the optimal solution only)?
A dietary food supplier is offering you protein powder on the cheap and is willing to negotiate the price. You figure $.5 per unit of protein may be a reasonable price. Augment your model to take this into account. Would you buy any protein powder at this price point?
Include a readable printout of your augmented model, showing both formulas and row and column headings as Exhibit 2-BRun a SolverTable on the price of unit of protein powder. Identify your walk-away-point (the price point when you would be indifferent between buying the protein from the food supplier and the status quo).
What is your walk-away price?
Include a readable printout of your table as Exhibit 2-C.
Problem 3 – Auctions & Reserve Prices
Please consider the following auction problem
You have a single unit of an indivisible good to sell. You have two potential buyers, and decide to auction the good. You do not know the buyers’ values (i.e. their maximum willingness to pay), but you do know that in each case these are uniformly distributed on [0, 1]. In other words, all values between $0 and $1 are equally likely (the valuations of the two buyers are independent). If it is unsold, the good is worth nothing to you (e.g. because it is perishable). As the auctioneer, you raise the price in very small increments starting from $0. The buyers are instructed to keep their hands up so long as they are willing to buy at the current price (i.e., so long as their value exceeds the price). When the first bidder drops out (puts his hand down), the other bidder gets the good at the price just called.
Set up a simple Excel model that models this scenario. Designate a cell that calculates your profit from the auction.
What is your expected profit from this auction?
Include an Exhibit to support your argument as Exhibit 3-A.
You wonder whether profits can be increased by setting a reserve price. Everything else remains the same, but you are now allowed to announce a reserve price R. This is the lowest price at which you are willing to sell – so you start raising the price from $R instead of $0. The risk is that both people drop out at $R itself, in which case you make nothing. If one person drops out right away, the good is sold at $R to the remaining bidder. If both are still in the bidding, the auction proceeds as before with the price being increased until one person remains in the bidding.
What is expected profit if you set a reserve price of $0.4? [Attach an image of the @Risk model as Exhibit 3-B. Use Ctrl-~ to display formulae.]
Examine the following options for R: 0.3, 0.35, 0.4, 0.45, 0.5, 0.55, 0.6, 0.65, 0.7, and 0.75, using a RiskSimTable.
What is the best reserve price?
At that reserve price, what is the expected profit?
At that reserve price, what is the standard deviation of profit?


