I have statistics equations
1.–/1 pointsMy Notes
Consider an x distribution with standard deviation σ = 20.
If specifications for a research project require the standard error of the corresponding x distribution to be 1, how large does the sample size need to be?
n = 

2.–/2 pointsMy Notes
Given the following data that was sampled from a normal population distribution:
| 158 | 137 | 152 | 101 | 75 | 94 | 116 | 100 | 85 |
Determine a 99% confidence interval for the population mean. (use 1 decimal place)
| lower limit |
|
| upper limit |
|
3.–/3 pointsMy Notes
Given the sample results taken from a normal population distribution: mean = 4.65, σ = 0.22, and n = 11.
Find the margin-of-error and the 95% confidence interval for the population mean. (use 2 decimal places)
| m.o.e. |
|
| lower limit |
|
| upper limit |
|
4.–/1 pointsMy Notes
Given a normal distribution with σ = 1.810. Find the required sample size for a 95% confidence level (estimating the mean) with a 1.10 margin-of-error.
5.–/2 pointsMy Notes
Given a random sample of size 332. Find a 99% confidence interval for the population proportion if the number of successes was 160.
(Use 3 decimal places.)
| lower limit |
|
| upper limit |
|
6.–/2 pointsMy Notes
Find the lower & upper limits of a confidence interval if the mean is twenty-two percent, and the margin of error is 0.026.
(Express answers as decimal numbers to 3 places.)
| lower limit |
|
| upper limit |
|
7.–/1 pointsMy Notes
Determine the required sample size to estimate a population proportion with a Confidence Level of 99% and E = 0.104.
8.–/1 pointsMy Notes
Determine the required sample size to estimate a population proportion with a Confidence Level of 80% and E = 0.036.
9.–/4 pointsMy Notes
In a marketing survey, a random sample of 1018 supermarket shoppers revealed that 266 always stock up on an item when they find that item at a real bargain price.
(a) Let p represent the proportion of all supermarket shoppers who always stock up on an item when they find a real bargain. Find a point estimate for p. (Use 3 decimal places.)
(b) Find a 90% confidence interval for p. (Use 3 decimal places.)
| lower limit |
|
| upper limit |
|
(c) What is the margin of error based on a 90% confidence interval? (Use 3 decimal places.)
10.–/2 pointsMy Notes
Use the given confidence interval limits to find the point estimate x and the margin of error E.
0.635 < μ < 0.671
x =
E =
11.–/2 pointsMy Notes
Find the critical z values. Assume that the normal distribution applies.
Two-tailed test; α = 0.05
(lower value) (higher value)
12.–/1 pointsMy Notes
Find the critical z value. Assume that the normal distribution applies.
Right-tailed test; α = 0.1
13.–/1 pointsMy Notes
Find the critical z value. Assume that the normal distribution applies.
Left-tailed test; α = 0.05
14.–/2 pointsMy Notes
In each of the following cases, find the best predicted value for y given that x = 3.00. The given statistics are summarized from paired sample data. Use the given data to find the best predicted value of the dependent variable. Be sure to follow the prediction procedures.
(a) r = 0.987, y = 6.00, n = 20, and the equation of the regression line is  = 6.00 + 2.00x.
(b) r = 0.051, y = 6.00, n = 20, and the equation of the regression line is = 6.00 + 2.00x.
15.–/2 pointsMy Notes
Compute the sample correlation coefficient r for each of the following data sets. (Use 3 decimal places.)
| (a) | x | |||
| y |
| (b) | x | |||
| y |
| r(a) = |
|
| r(b) = |
|
16.–/1 pointsMy Notes
The odds of an event not occuring are given as 5 to 2. What is the probability of success?
(Enter exact fraction or a decimal answer to a minimum of 4 places.)
17.–/1 pointsMy Notes
Find the mean of a binomial distribution when q = 13% and n = 191.
| μ = |
|
18.–/1 pointsMy Notes
Assume that IQ scores are normally distributed, with a standard deviation of 15 points and a mean of 100 points. If 130 people are chosen at random, what is the probability that the sample mean of IQ scores will not differ from the population mean by more than 2 points? (use 3 decimal places)
19.–/9 pointsMy Notes
The college Physical Education Department offered an Advanced First Aid course last summer. The scores on the comprehensive final exam were normally distributed, and the z scores for some of the students are shown below.
| Robert, 0.98 | Juan, 1.60 | Susan, –2.1 | |
| Joel, 0.00 | Jan, –0.95 | Linda, 1.68 | |
| STEP 1: | Which of these students scored above the mean? (Select all that apply.) | ||
|
| |||
 Joel
Joel
| STEP 2: | Which of these students scored on the mean? (Select all that apply.) |
|
|
| STEP 3: | Which of these students scored below the mean? (Select all that apply.) |
|
|
| STEP 4: | If the mean score was μ = 146 with standard deviation σ = 25, what was the final exam score for each student? (Round your answers to the nearest whole number.) | ||||||||||||
|
20.–/2 pointsMy Notes
Tree-ring dates were used extensively in archaeological studies at Burnt Mesa Pueblo. At one site on the mesa, tree-ring dates (for many samples) gave a mean date of μ1 = year 1266 with standard deviation σ1 = 38 years. At a second, removed site, the tree-ring dates gave a mean of μ2 = year 1125with standard deviation σ2 = 43 years. Assume that both sites had dates that were approximately normally distributed. In the first area, an object was found and dated as x1 = year 1185. In the second area, another object was found and dated as x2 = year 1233.
Convert both x1 and x2 to z values. (Use 2 decimal places.)
| z1 = |
|
| z2 = |
|
21.–/1 pointsMy Notes
Sketch a standard normal curve, and find the area between z = 0.28 and z = 1.94. (Use 4 decimal places.)
22.–/1 pointsMy Notes
Assume that x has a normal distribution. Find P(10 ≤ x ≤ 26) given that μ = 14.5 and σ = 3.5. (Use 4 decimal places.)
23.–/1 pointsMy Notes
Let z be a random variable with a standard normal distribution. Find P(–1.17 ≤ z ≤ 2.59). Use 4 decimal places.
24.–/1 pointsMy Notes
Consider a normal distribution with mean 21 and standard deviation 10. What is the probability that a value selected at random from this distribution is greater than 21? (Use 2 decimal places.)
25.–/1 pointsMy Notes
Assume that x has a normal distribution. Find P(3 ≤ x ≤ 6) given that μ = 4.4 and σ = 1.8. (Use 4 decimal places.)
26.–/2 pointsMy Notes
A professor determines a final grade based on attendance, two papers, three major tests, and a final exam. Each of these activities has a total of 100 possible points. However, the activities carry different weights. Attendance is worth 7%, each paper is worth 9%, each test is worth 16%, and the final is worth 27%.
(a) What is the average for a student with 67 on attendance, 73 on the first paper, 100 on the second paper, 67 on test 1, 60 on test 2, 94 on test 3, and 95 on the final exam? (Enter your answer to one decimal place.)
(b) Compute the average for a student with the above scores on the papers, tests, and final exam, but with a score of only 28 on attendance. (Enter your answer to one decimal place.)
27.–/1 pointsMy Notes
A performance evaluation for new sales representatives at Office Automation Incorporated involves several ratings done on a scale of 1 to 10, with 10 the highest rating. The activities rated include new contacts, successful contacts, total contacts, dollar volume of sales, and reports. Then an overall rating is determined by using a weighted average. The weights are 4 for new contacts, 1 for successful contacts, 5 for total contacts, 1 for dollar volume of sales, and 2 for reports. What would the overall rating be for a sales representative with ratings of 5 for new contacts, 2 for successful contacts, 3for total contacts, 6 for dollar volume of sales, and 2 for reports? (Enter your answer to 2 decimal places.)
28.–/2 pointsMy Notes
The Orchard Cafe has found that about 17% of the diners who make reservations don't show up. If 71 reservations have been made, how many diners can be expected to show up? What is the standard deviation of this distribution? (Use 2 decimal places.)
| μ |
|
| σ |
|
29.–/2 pointsMy Notes
Consumer Reports rated airlines and found that 89% of the flights involved in the study arrived on time (that is, within 15 minutes of scheduled arrival time). Assuming that the on-time arrival rate is representative of the entire commercial airline industry, consider a random sample of 194 flights. What is the expected number that will arrive on time? What is the standard deviation of this distribution? (Use 2 decimal places.)
| μ |
|
| σ |
|
30.–/6 pointsMy Notes
Suppose x has a distribution with μ = 16 and σ = 8.
(a) If a random sample of size n = 36 is drawn, find μx, σx and P(16 ≤ x ≤ 18).
| μx = |
| σx = |
| P(16 ≤ x ≤ 18) = |
(b) If a random sample of size n = 60 is drawn, find μx, σx and P(16 ≤ x ≤ 18).
| μx = |
| σx = |
| P(16 ≤ x ≤ 18) = |
31.–/2 pointsMy Notes
The heights of 18 year-old men are approximately normally distributed, with mean 72 inches and standard deviation 5 inches.
(a) What is the probability that an 18 year-old man selected at random is between 71 and 73 inches tall? (Use 3 decimal places.)
(b) If a random sample of twelve 18-year-old men is selected, what is the probability that the mean height x is between 71 and 73 inches? (Use 3 decimal places.)
32.–/3 pointsMy Notes
In the binomial probability distribution, let the number of trials be n = 6, and let the probability of success be p = 0.4228. Use a computer to determine the following.
(a) The probability of five successes. (Use 4 decimal places.)
(b) The probability of six successes. (Use 4 decimal places.)
(c) The probability of five or six successes. (Use 4 decimal places.)
33.–/2 pointsMy Notes
Angela took a general aptitude test and scored in the 82nd percentile for aptitude in accounting.
(a) What percentage of the scores were at or below her score? %
(b) What percentage were above? %
34.–/1 pointsMy Notes
At General Hospital, nurses are given performance evaluations to determine eligibility for merit pay raises. The supervisor rates the nurses on a scale of 1 to 10 (10 being the highest rating) for several activities: promptness, record keeping, appearance, and bedside manner with patients. Then an average is determined by giving a weight of 2 for promptness, 4 for record keeping, 1 for appearance, and 3 for bedside manner with patients. What is the average rating for a nurse with ratings of 8 for promptness, 10 for record keeping, 2 for appearance, and 5 for bedside manner? (Enter your answer to one decimal place.)
35.–/6 pointsMy Notes
Keeping water supplies clean requires regular measurement of levels of pollutants. The measurements are indirect—a typical analysis involves forming a dye by a chemical reaction with the dissolved pollutant, then passing light through the solution and measuring its "absorbence." To calibrate such measurements, the laboratory measures known standard solutions and uses regression to relate absorbence and pollutant concentration. This is usually done every day. Here is one series of data on the absorbence for different levels of nitrates. Nitrates are measured in milligrams per liter of water.
| Nitrates | 50 | 50 | 100 | 200 | 400 | 800 | 1200 | 1600 | 2000 | 2000 |
| Absorbence | 7.0 | 7.6 | 12.8 | 24.0 | 47.0 | 94.0 | 138.0 | 183.0 | 229.0 | 226.0 |
(a) Chemical theory says that these data should lie on a straight line and if the correlation is not at least 0.997 then the calibration procedure is repeated. Find the correlation. (Use 4 decimal places.)
r =
(b) Must the calibration be done again?
 YesNo
YesNo
(c) The calibration process sets nitrate level and measures absorbence. Once established, the linear relationship will be used to estimate the nitrate level in water from a measurement of absorbance. What is the equation of the line used for estimation? (Use 2 decimal places for intercept and 3 decimal places for slope.) = + x
(d) What is the estimated nitrate level in a water specimen with absorbence 37? (Use 1 decimal place.) mg/l
(e) Do you expect estimates of nitrate level from absorbence to be quite accurate?
This prediction is of a value that is not in the range of the data and therefore cannot be accurate.This prediction should be very accurate because the relationship is so strong as indicated by r.This prediction should be very inaccurate because the relationship is too perfectly linear.Since the calibration is so important, it is inaccurate to use this regression to predict.
36.–/2 pointsMy Notes
In a randomized comparative experiment on the effect of dietary calcium on blood pressure, researchers divided 52 healthy white males at random into two groups. One group received calcium; the other, a placebo. At the beginning of the study, the researchers measured many variables on the subjects. The paper reporting the study gives x = 114.9 and s = 9.5 for the seated systolic blood pressure of the 26 members of the placebo group.
Give a 95% confidence interval for the mean blood pressure in the population from which the subjects were recruited. (Round your answers to one decimal place.) to
37.–/2 pointsMy Notes
A sample survey of 896 adult Internet users found that 63% look for information on the online collaborative encyclopedia Wikipedia.
(a) Give the standard error SE of p̂, the proportion of all adult Internet users who look for information on Wikipedia. (Round your answer to four decimal places.)
SE =
(b) Give a 95% large sample confidence interval for the proportion of all adult internet users who look for information on Wikipedia.
0.603 to 0.6570.586 to 0.674 0.598 to 0.6620.578 to 0.682
38.–/2 pointsMy Notes
An organization surveyed a random sample of 757 Division I college athletes in 36 sports. One question asked was "Have you ever received preferential treatment from a professor because of your status as an athlete?" Of the athletes polled, 206 said "yes."
To investigate the proportion of all Division I college athletes who believe they have received preferential treatment, we should use which of the following?
one sample, inference about the meanone sample, inference about proportion matched pairs, inference about proportiontwo samples, inference about proportions
The sample proportion of athletes who have received preferential treatment from a professor is which of the following?
0.2720.728 0.1750.825
39.–/2 pointsMy Notes
Starting in the 1970s, medical technology allowed babies with very low birth weight (VLBW, less than 1500 grams, about 3.3 pounds) to survive without major handicaps. It was noticed that these children nonetheless had difficulties in school and as adults. A long-term study has followed 242 VLBW babies to age 20 years, along with a control group of 233 babies from the same population who had normal birth weight. At age 20, 179 of the VLBW group and 193 of the control group had graduated from high school.
Of the 126 women in the VLBW group, 38 said they had used illegal drugs; 54 of the 124 control group women had done so. The IQ scores for the VLBW women who had used illegal drugs had mean 86.2 (standard deviation 13.0), and the normal-birth-weight controls who had used illegal drugs had mean IQ 89.8 (standard deviation 14.2).
To test whether there is a significant difference in the use of illegal drugs among the two groups, we must test which of the following hypotheses?
H0: p1 = p2
Ha: p1 ≠ p2H0: p1 = p2
Ha: p1 > p2 H0: μ1 = μ2
Ha: μ1 ≠ μ2H0: μ1 = μ2
Ha: μ1 > μ2
The P-value for this test is which of the following?
less than 0.01between 0.01 and 0.05 between 0.05 and 0.10greater than 0.10
40.–/1 pointsMy Notes
According to the National Institute on Alcohol Abuse and Alcoholism (NIAAA) and the National Institutes of Health (NIH), 41% of college students nationwide engage in "binge-drinking" behavior: having five or more drinks on one occasion during the past two weeks. A college president wonders if the proportion of students enrolled at her college who binge drink is actually lower than the national proportion. In a commissioned study, 348 students are selected randomly from a list of all students enrolled at the college. Of these, 132 admit to having engaged in binge drinking.
The college president is interested in testing her belief that the proportion of students at her college who engage in binge drinking is lower than the national proportion of 0.41.
Which of the following conclusions is reasonable? (Assume a 95% confidence level.)
There is strong statistical evidence that the proportion of students at this college who binge drink is lower than the national proportion of 0.41.There is little statistical evidence to support a conclusion that the proportion of students at this particular college who binge drink is lower than the national proportion of 0.41.
42.–/1 pointsMy Notes
At what age do infants speak their first word of English? Here are data on 20 children (ages in months).
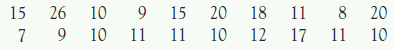
A 90% confidence interval for the mean age at which children speak their first word is which of the following?
13 ± 0.42713 ± 1.814 4.931 ± 1.90613 ± 1.907
46.–/1 pointsMy Notes
In government data, a household consists of all occupants of a dwelling unit. Here is the distribution of household size in a country.
| Number of Persons | |||||||
| Probability | 0.27 | 0.34 | 0.16 | 0.14 | 0.06 | 0.02 | 0.01 |
Choose a household at random and consider the number of persons living in the household. What is the probability of the event "more than two people live in this household"? (Enter your answer to two decimal places.)
47.–/4 pointsMy Notes
The time that people require to react to a stimulus usually has a right-skewed distribution, as lack of attention or tiredness causes some lengthy reaction times. Reaction times for children with attention deficit hyperactivity disorder (ADHD) are more skewed, as their condition causes more frequent lack of attention. In one study, children with ADHD were asked to press the spacebar on a computer keyboard when any letter other than X appeared on the screen. With 2 seconds between letters, the mean reaction time was 445 milliseconds (ms) and the standard deviation was 89 ms. Take these values to be the population μ and σ for ADHD children. (Round your standard deviations to two decimal places.)
What are the mean and standard deviation of the mean reaction time x for a randomly chosen group of 15 ADHD children?
| mean |
|
| standard deviation |
|
What are the mean and standard deviation of the mean reaction time x for a randomly chosen group of 150 ADHD children?
| mean |
|
| standard deviation |
|
48.–/2 pointsMy Notes
The level of pesticides found in the blubber of whales is a measure of pollution of the oceans by runoff from land and can also be used to identify different populations of whales. A sample of nine male minke whales in the West Greenland area of the North Atlantic found the mean concentration of the insecticide dieldrin to be x = 357 nanograms per gram of blubber (ng/g). Suppose that the concentration in all such whales varies Normally with population standard deviation σ = 57 ng/g.
Give a 95% confidence interval for estimating the mean level. (Round your answers to two decimal places.) to ng/g
49.2/3 points | Previous AnswersMy Notes
You read in a report that a 90% confidence interval for the median income of American households was $51,028 ± $346.
What is the significance level?
α =
50.–/2 pointsMy Notes
What type of shopping websites do males aged 18 to 34 visit? About 50% of male Internet users in this age group visit an auction site (such as eBay) at least once a month.
(a) If we interview a random sample of 13 male Internet users aged 18 to 34, what is the probability that exactly 9 of the 13 have visited an auction site in the past month? (Round your answer to four decimal places.)
(b) Suppose that we had interviewed a random sample of 900 men aged 18 to 34. What is the probability that at least 431 of the men in the sample visit an online auction site at least once a month? (Round your answer to four decimal places.)


