I need you to write an introduction one page exactly and a conclusion one page exactly, it is about a report from a software called "Minitab" where it had the solving of descriptive statistics and i
Table of Content (leave to last)
Introduction (1 PAGE/ DOUBLE SPACED)(Times roman 12, double spaced) (file is that we randomly selected 75 from 92 and we wanted to perform…… “ what you want to achieve from this project)
1) Descriptive Statistics:
GRAPHS for all COLUMNS: GRAPH OF YOUR CHOICE (no Histograms), DESCRIBE GRAPHS stating the important facts.
Stem-and-Leaf Display: Pulse1
Stem-and-leaf of Pulse1 N = 75
| 44 | ||
| 888 | ||
| 19 | 00012222222244 | |
| 30 | 66666888888 | |
| (15) | 000002222244444 | |
| 30 | 6666688 | |
| 23 | 000222444 | |
| 14 | 67888 | |
| 000024 | ||
| 66 | ||
| 10 |
Leaf Unit = 1
Graph 1: From the graph above we can see that the most of resting heart beats per minute range in 60-80.
Stem-and-Leaf Display: Pulse2
Stem-and-leaf of Pulse2 N = 75
| 06688 | ||
| 18 | 0222466688888 | |
| (25) | 0000222444445666666666688 | |
| 32 | 00024444444488 | |
| 18 | 0224468 | |
| 11 | 10 | 0026 |
| 11 | 05688 | |
| 12 | ||
| 13 |
| |
| 14 |
Leaf Unit = 1
Graph 2: The stem and leaf shows that after running most of the heart beats range in the 70’s heart beats per minute.

Graph 3: The graph above shows that the most of the students ran (58% of them)
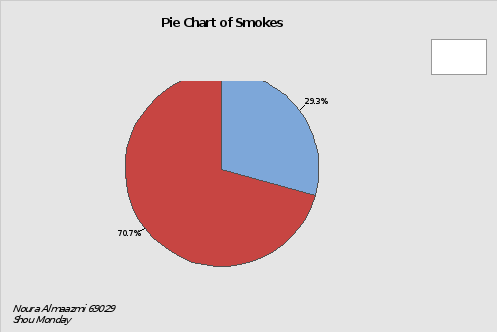
Graph 4: Pie chart of the students smoking shows the majority of students do not smoke
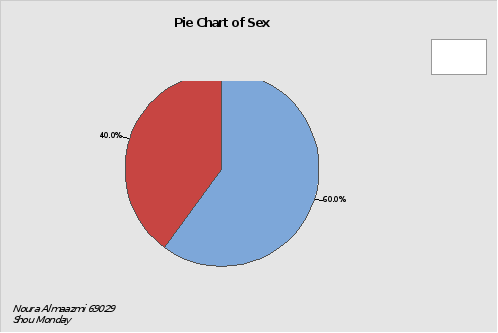
Graph 5: Pie chart of gender shows that 60% of the sample consists of male students.

Graph 6: The box plot shows that the height of sample ranges between 66-and 70.

Graph 7: The weight box plot shows that most of the students weigh between 125 and 155, with 215 as an outlier.

Graph 8: Pie chart of students shows that only 24% of the sample are very active when it comes to physical activity.
DESCRIPTIVE STATISTICS OF COLUMN C1. C2. C6, C7
Descriptive Statistics: Pulse1
Statistics
| Variable | N* | Mean | SE Mean | StDev | Minimum | Q1 | Median | Q3 | Maximum | |
| Pulse1 | 75 | 73.52 | 1.29 | 11.17 | 54.00 | 64.00 | 72.00 | 82.00 | 100.00 |
Descriptive Statistics: Pulse2
Statistics
| Variable | N* | Mean | SE Mean | StDev | Minimum | Q1 | Median | Q3 | Maximum | |
| Pulse2 | 75 | 80.83 | 2.02 | 17.50 | 50.00 | 70.00 | 76.00 | 88.00 | 140.00 |
Descriptive Statistics: Height
Statistics
| Variable | N* | Mean | SE Mean | StDev | Minimum | Q1 | Median | Q3 | Maximum | |
| Height | 75 | 68.567 | 0.440 | 3.812 | 61.000 | 66.000 | 69.000 | 72.000 | 75.000 |
Descriptive Statistics: Weight
Statistics
| Variable | N* | Mean | SE Mean | StDev | Minimum | Q1 | Median | Q3 | Maximum | |
| Weight | 75 | 144.25 | 2.88 | 24.95 | 95.00 | 125.00 | 145.00 | 157.00 | 215.00 |
DESCRIPTIVE STATISTICS OF COLUMN C1. C2. C6, C7 by variable C3,C4 , C5 and C8
Descriptive Statistics: Pulse1
Results for Ran = 1, Smokes = 1, Sex = 1
Statistics
| Variable | Activity | N* | Mean | SE Mean | StDev | Minimum | Q1 | Median | Q3 | Maximum | |
| Pulse1 | 78.0 | 12.0 | 17.0 | 66.0 | 78.0 | 90.0 | |||||
|
| 68.00 | 2.00 | 2.83 | 66.00 | 68.00 | 70.00 | |||||
|
| 74.67 | 8.97 | 15.53 | 62.00 | 62.00 | 70.00 | 92.00 | 92.00 |
Results for Ran = 1, Smokes = 1, Sex = 2
Statistics
| Variable | Activity | N* | Mean | SE Mean | StDev | Minimum | Q1 | Median | Q3 | Maximum | |
| Pulse1 | 83.3 | 11.2 | 19.4 | 62.0 | 62.0 | 88.0 | 100.0 | 100.0 |
Results for Ran = 1, Smokes = 2, Sex = 1
Statistics
| Variable | Activity | N* | Mean | SE Mean | StDev | Minimum | Q1 | Median | Q3 | Maximum | |
| Pulse1 | 74.000 | 74.000 | 74.000 | 74.000 | |||||||
|
| 10 | 68.60 | 2.11 | 6.67 | 58.00 | 63.50 | 68.00 | 74.50 | 80.00 | ||
|
| 69.50 | 5.50 | 11.00 | 60.00 | 60.50 | 67.00 | 81.00 | 84.00 |
Results for Ran = 1, Smokes = 2, Sex = 2
Statistics
| Variable | Activity | N* | Mean | SE Mean | StDev | Minimum | Q1 | Median | Q3 | Maximum | |
| Pulse1 | 82.33 | 5.20 | 12.74 | 62.00 | 74.00 | 81.00 | 96.00 | 96.00 |
Results for Ran = 2, Smokes = 1, Sex = 1
Statistics
| Variable | Activity | N* | Mean | SE Mean | StDev | Minimum | Q1 | Median | Q3 | Maximum | |
| Pulse1 | 71.43 | 4.51 | 11.93 | 54.00 | 62.00 | 70.00 | 82.00 | 90.00 | |||
|
| 72.000 | 72.000 | 72.000 | 72.000 |
Results for Ran = 2, Smokes = 1, Sex = 2
Statistics
| Variable | Activity | N* | Mean | SE Mean | StDev | Minimum | Q1 | Median | Q3 | Maximum | |
| Pulse1 | 90.000 | 90.000 | 90.000 | 90.000 | |||||||
|
| 91.00 | 3.00 | 4.24 | 88.00 | 91.00 | 94.00 | |||||
|
| 76.000 | 76.000 | 76.000 | 76.000 |
Results for Ran = 2, Smokes = 2, Sex = 1
Statistics
| Variable | Activity | N* | Mean | SE Mean | StDev | Minimum | Q1 | Median | Q3 | Maximum | |
| Pulse1 | 76.0 | 14.0 | 19.8 | 62.0 | 76.0 | 90.0 | |||||
|
| 72.75 | 3.98 | 11.26 | 54.00 | 63.00 | 74.00 | 82.00 | 88.00 | |||
|
| 68.80 | 3.14 | 7.01 | 58.00 | 63.00 | 68.00 | 75.00 | 76.00 |
Results for Ran = 2, Smokes = 2, Sex = 2
Statistics
| Variable | Activity | N* | Mean | SE Mean | StDev | Minimum | Q1 | Median | Q3 | Maximum | |
| Pulse1 | 83.00 | 1.00 | 1.41 | 82.00 | 83.00 | 84.00 | |||||
|
| 11 | 68.45 | 2.22 | 7.37 | 58.00 | 61.00 | 68.00 | 76.00 | 80.00 | ||
|
| 74.75 | 6.80 | 13.60 | 62.00 | 62.50 | 75.00 | 86.75 | 87.00 |
Descriptive Statistics: Pulse2
Results for Ran = 1, Smokes = 1, Sex = 1
Statistics
| Variable | Activity | N* | Mean | SE Mean | StDev | Minimum | Q1 | Median | Q3 | Maximum | |
| Pulse2 | 86.00 | 8.00 | 11.31 | 78.00 | 86.00 | 94.00 | |||||
|
| 88.00 | 6.00 | 8.49 | 82.00 | 88.00 | 94.00 | |||||
|
| 77.33 | 3.53 | 6.11 | 72.00 | 72.00 | 76.00 | 84.00 | 84.00 |
Results for Ran = 1, Smokes = 1, Sex = 2
Statistics
| Variable | Activity | N* | Mean | SE Mean | StDev | Minimum | Q1 | Median | Q3 | Maximum | |
| Pulse2 | 107.67 | 5.04 | 8.74 | 98.00 | 98.00 | 110.00 | 115.00 | 115.00 |
Results for Ran = 1, Smokes = 2, Sex = 1
Statistics
| Variable | Activity | N* | Mean | SE Mean | StDev | Minimum | Q1 | Median | Q3 | Maximum | |
| Pulse2 | 84.000 | 84.000 | 84.000 | 84.000 | |||||||
|
| 10 | 87.90 | 5.29 | 16.74 | 70.00 | 74.25 | 82.00 | 103.00 | 118.00 | ||
|
| 74.50 | 5.74 | 11.47 | 58.00 | 62.50 | 78.00 | 83.00 | 84.00 |
Results for Ran = 1, Smokes = 2, Sex = 2
Statistics
| Variable | Activity | N* | Mean | SE Mean | StDev | Minimum | Q1 | Median | Q3 | Maximum | |
| Pulse2 | 117.00 | 6.40 | 15.68 | 100.00 | 100.00 | 117.00 | 131.00 | 140.00 |
Results for Ran = 2, Smokes = 1, Sex = 1
Statistics
| Variable | Activity | N* | Mean | SE Mean | StDev | Minimum | Q1 | Median | Q3 | Maximum | |
| Pulse2 | 71.14 | 4.38 | 11.60 | 56.00 | 62.00 | 68.00 | 84.00 | 88.00 | |||
|
| 74.000 | 74.000 | 74.000 | 74.000 |
Results for Ran = 2, Smokes = 1, Sex = 2
Statistics
| Variable | Activity | N* | Mean | SE Mean | StDev | Minimum | Q1 | Median | Q3 | Maximum | |
| Pulse2 | 92.000 | 92.000 | 92.000 | 92.000 | |||||||
|
| 83.00 | 9.00 | 12.73 | 74.00 | 83.00 | 92.00 | |||||
|
| 76.000 | 76.000 | 76.000 | 76.000 |
Results for Ran = 2, Smokes = 2, Sex = 1
Statistics
| Variable | Activity | N* | Mean | SE Mean | StDev | Minimum | Q1 | Median | Q3 | Maximum | |
| Pulse2 | 76.0 | 14.0 | 19.8 | 62.0 | 76.0 | 90.0 | |||||
|
| 72.00 | 4.04 | 11.41 | 50.00 | 64.00 | 75.00 | 82.00 | 84.00 | |||
|
| 67.20 | 3.01 | 6.72 | 58.00 | 61.00 | 68.00 | 73.00 | 76.00 |
Results for Ran = 2, Smokes = 2, Sex = 2
Statistics
| Variable | Activity | N* | Mean | SE Mean | StDev | Minimum | Q1 | Median | Q3 | |
| Pulse2 | 80.000 | 0.000000 | 0.000000 | 80.000 | 80.000 | |||||
|
| 11 | 70.18 | 1.86 | 6.16 | 56.00 | 68.00 | 70.00 | 76.00 | ||
|
| 73.50 | 6.18 | 12.37 | 60.00 | 61.50 | 75.00 | 84.00 |
| Variable | Activity | Maximum |
| Pulse2 | 80.000 | |
|
| 78.00 | |
|
| 84.00 |
Descriptive Statistics: Height
Results for Ran = 1, Smokes = 1, Sex = 1
Statistics
| Variable | Activity | N* | Mean | SE Mean | StDev | Minimum | Q1 | Median | Q3 | Maximum | |
| Height | 73.500 | 0.500 | 0.707 | 73.000 | 73.500 | 74.000 | |||||
|
| 72.00 | 3.00 | 4.24 | 69.00 | 72.00 | 75.00 | |||||
|
| 72.17 | 1.09 | 1.89 | 70.00 | 70.00 | 73.00 | 73.50 | 73.50 |
Results for Ran = 1, Smokes = 1, Sex = 2
Statistics
| Variable | Activity | N* | Mean | SE Mean | StDev | Minimum | Q1 | Median | Q3 | Maximum | |
| Height | 64.92 | 2.04 | 3.54 | 62.75 | 62.75 | 63.00 | 69.00 | 69.00 |
Results for Ran = 1, Smokes = 2, Sex = 1
Statistics
| Variable | Activity | N* | Mean | SE Mean | StDev | Minimum | Q1 | Median | Q3 | Maximum | |
| Height | 73.000 | 73.000 | 73.000 | 73.000 | |||||||
|
| 10 | 70.500 | 0.764 | 2.415 | 66.000 | 69.250 | 71.000 | 72.000 | 74.000 | ||
|
| 70.25 | 1.44 | 2.87 | 66.00 | 67.25 | 71.50 | 72.00 | 72.00 |
Results for Ran = 1, Smokes = 2, Sex = 2
Statistics
| Variable | Activity | N* | Mean | SE Mean | StDev | Minimum | Q1 | Median | Q3 | Maximum | |
| Height | 66.67 | 1.20 | 2.94 | 61.00 | 64.75 | 68.00 | 68.25 | 69.00 |
Results for Ran = 2, Smokes = 1, Sex = 1
Statistics
| Variable | Activity | N* | Mean | SE Mean | StDev | Minimum | Q1 | Median | Q3 | Maximum | |
| Height | 70.29 | 1.29 | 3.40 | 66.00 | 67.00 | 69.00 | 73.00 | 75.00 | |||
|
| 68.000 | 68.000 | 68.000 | 68.000 |
Results for Ran = 2, Smokes = 1, Sex = 2
Statistics
| Variable | Activity | N* | Mean | SE Mean | StDev | Minimum | Q1 | Median | Q3 | Maximum | |
| Height | 64.000 | 64.000 | 64.000 | 64.000 | |||||||
|
| 63.50 | 1.50 | 2.12 | 62.00 | 63.50 | 65.00 | |||||
|
| 62.000 | 62.000 | 62.000 | 62.000 |
Results for Ran = 2, Smokes = 2, Sex = 1
Statistics
| Variable | Activity | N* | Mean | SE Mean | StDev | Minimum | Q1 | Median | Q3 | Maximum | |
| Height | 71.00 | 3.00 | 4.24 | 68.00 | 71.00 | 74.00 | |||||
|
| 70.688 | 0.785 | 2.219 | 67.000 | 69.000 | 71.000 | 72.750 | 73.500 | |||
|
| 70.90 | 1.44 | 3.21 | 66.00 | 67.75 | 72.00 | 73.50 | 74.00 |
Results for Ran = 2, Smokes = 2, Sex = 2
Statistics
| Variable | Activity | N* | Mean | SE Mean | StDev | Minimum | Q1 | Median | Q3 | Maximum | |
| Height | 64.00 | 1.00 | 1.41 | 63.00 | 64.00 | 65.00 | |||||
|
| 11 | 65.205 | 0.759 | 2.517 | 61.750 | 62.000 | 65.500 | 67.000 | 69.000 | ||
|
| 65.250 | 0.854 | 1.708 | 63.000 | 63.500 | 65.500 | 66.750 | 67.000 |
Descriptive Statistics: Weight
Results for Ran = 1, Smokes = 1, Sex = 1
Statistics
| Variable | Activity | N* | Mean | SE Mean | StDev | Minimum | Q1 | Median | Q3 | Maximum | |
| Weight | 175.0 | 15.0 | 21.2 | 160.0 | 175.0 | 190.0 | |||||
|
| 180.00 | 5.00 | 7.07 | 175.00 | 180.00 | 185.00 | |||||
|
| 161.00 | 4.93 | 8.54 | 153.00 | 153.00 | 160.00 | 170.00 | 170.00 |
Results for Ran = 1, Smokes = 1, Sex = 2
Statistics
| Variable | Activity | N* | Mean | SE Mean | StDev | Minimum | Q1 | Median | Q3 | Maximum | |
| Weight | 127.7 | 11.5 | 19.9 | 112.0 | 112.0 | 121.0 | 150.0 | 150.0 |
Results for Ran = 1, Smokes = 2, Sex = 1
Statistics
| Variable | Activity | N* | Mean | SE Mean | StDev | Minimum | Q1 | Median | Q3 | Maximum | |
| Weight | 165.00 | 165.00 | 165.00 | 165.00 | |||||||
|
| 10 | 156.50 | 6.97 | 22.04 | 130.00 | 139.50 | 150.00 | 175.00 | 195.00 | ||
|
| 157.50 | 9.24 | 18.48 | 135.00 | 138.75 | 160.00 | 173.75 | 175.00 |
Results for Ran = 1, Smokes = 2, Sex = 2
Statistics
| Variable | Activity | N* | Mean | SE Mean | StDev | Minimum | Q1 | Median | Q3 | Maximum | |
| Weight | 130.67 | 4.86 | 11.89 | 116.00 | 119.00 | 131.50 | 141.25 | 145.00 |
Results for Ran = 2, Smokes = 1, Sex = 1
Statistics
| Variable | Activity | N* | Mean | SE Mean | StDev | Minimum | Q1 | Median | Q3 | Maximum | |
| Weight | 158.57 | 8.36 | 22.12 | 130.00 | 140.00 | 155.00 | 180.00 | 190.00 | |||
|
| 155.00 | 155.00 | 155.00 | 155.00 |
Results for Ran = 2, Smokes = 1, Sex = 2
Statistics
| Variable | Activity | N* | Mean | SE Mean | StDev | Minimum | Q1 | Median | Q3 | Maximum | |
| Weight | 125.00 | 125.00 | 125.00 | 125.00 | |||||||
|
| 133.00 | 2.00 | 2.83 | 131.00 | 133.00 | 135.00 | |||||
|
| 108.00 | 108.00 | 108.00 | 108.00 |
Results for Ran = 2, Smokes = 2, Sex = 1
Statistics
| Variable | Activity | N* | Mean | SE Mean | StDev | Minimum | Q1 | Median | Q3 | Maximum | |
| Weight | 167.5 | 22.5 | 31.8 | 145.0 | 167.5 | 190.0 | |||||
|
| 154.88 | 9.67 | 27.35 | 123.00 | 137.00 | 155.00 | 158.75 | 215.00 | |||
|
| 146.00 | 3.45 | 7.71 | 135.00 | 138.50 | 148.00 | 152.50 | 155.00 |
Results for Ran = 2, Smokes = 2, Sex = 2
Statistics
| Variable | Activity | N* | Mean | SE Mean | StDev | Minimum | Q1 | Median | Q3 | Maximum | |
| Weight | 117.00 | 1.00 | 1.41 | 116.00 | 117.00 | 118.00 | |||||
|
| 11 | 118.18 | 3.85 | 12.77 | 102.00 | 110.00 | 115.00 | 125.00 | 150.00 | ||
|
| 124.3 | 11.4 | 22.8 | 95.0 | 101.8 | 126.0 | 145.0 | 150.0 |
For the descriptive statistics by variables, the pulse deviates according to the status; as for students who ran and the students who did not. The median for students increased from 72 to 74 for students who did not run while students who did run it increased from 70 to 88. Regarding the change in heart beat for smokers, students who smoke regularly already had a high resting heart beats before the running, thus they experienced only a minor change equal to 4 beats per minute, while students who did not smoke experienced a higher change. From the data, one can also compare between the female and male weights and heights. One can witness that females are shorter than males using the median as means of comparison, since males have a median of 71 inches while female is 65. The same goes to the weight, male students are heavier than female ones, since males have a mean of 158 pounds while female have a weight of 123 pounds. As for the activity level one can notice that the more activity level the lower weight of the students, which can be seen between students who do not perform and activity and thus weight 151 pounds and those who exercise more and weight 143 pounds.
GRAPH C1 and C2 BY VARABLES: C3, C4, C5 (6 HISTORGRAMS) . Describe the graphs.
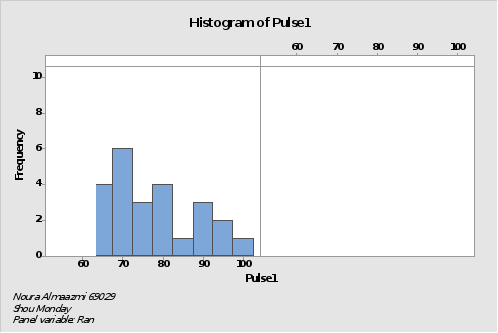
Graph 1: The histogram by variables shows that students who ran have frequent higher resting heart beat per minute. Also, the student who did not run pulse histogram is skewed to the right, and student who ran in their place pulse is almost normally distributed.

Graph 2: The histogram by variables shows that males have frequent higher resting heart beat per minute, and female pulses show no skew, while male pulses are relatively normal distributed.
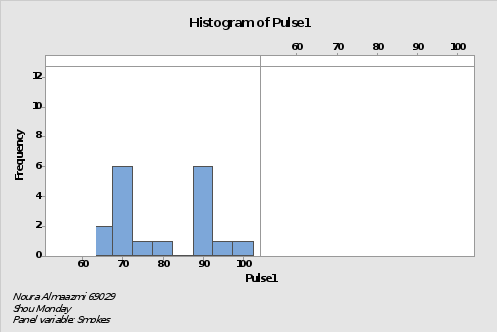
Graph 3: The histogram by variables shows that smokers have frequent higher resting heart beat per minute, it can also be noticed that students who don’t smoke histogram is skewed to the right, while students who smoke does not show any skew.

Graph 4: The graph of ran shows that students who ran have more frequent high pulses, furthermore pulses for students who did not run follow a normal distribution to some extent.

Graph 5: The histogram by variables shows that after running higher levels such as 80 beats per minute is more frequent, it can be noticed that both graphs are relatively skewed to the right.

Graph 6: The histogram by variables shows that males resting heart beat after running is skewed to the right showing lower high heart beats after running, same goes for female students who ran which shows right skew.
Inferential Statistics
CONFIDENCE INTERVAL FOR All columns (separately) Choose different confidence level and interpret each confidence interval
One-Sample T: Pulse1
Descriptive Statistics
| Mean | StDev | SE Mean | 90% CI for μ | |
| 75 | 73.52 | 11.17 | 1.29 | (71.37, 75.67) |
μ: mean of Pulse1
From the confidence interval we can be confident that 90% of the sample has resting heart beat between 71 and 76 heart beats per minute
One-Sample T: Pulse2
Descriptive Statistics
| Mean | StDev | SE Mean | 90% CI for μ | |
| 75 | 80.83 | 17.50 | 2.02 | (77.46, 84.19) |
μ: mean of Pulse2
For the pulse after running we are sure that 90% of the data is between 77 and 84 heart beats per minute.
One-Sample T: Ran
Descriptive Statistics
| Mean | StDev | SE Mean | 99% CI for μ | |
| 75 | 1.5867 | 0.4957 | 0.0572 | (1.4353, 1.7380) |
μ: mean of Ran
For the running column we are confident that student either ran in place or did not run
One-Sample T: Smokes
Descriptive Statistics
| Mean | StDev | SE Mean | 90% CI for μ | |
| 75 | 1.7067 | 0.4584 | 0.0529 | (1.6185, 1.7948) |
μ: mean of Smokes
For the smoking column we are confident that student either smoke or don’t smoke.
One-Sample T: Sex
Descriptive Statistics
| Mean | StDev | SE Mean | 90% CI for μ | |
| 75 | 1.4000 | 0.4932 | 0.0569 | (1.3051, 1.4949) |
μ: mean of Sex
For the gender of the students we are certain that it can only be two results; male or female.
One-Sample T: Height
Descriptive Statistics
| Mean | StDev | SE Mean | 99% CI for μ | |
| 75 | 68.567 | 3.812 | 0.440 | (67.403, 69.731) |
μ: mean of Height
For the height column 99% of the data lies between 67 and 69 inches
One-Sample T: Weight
Descriptive Statistics
| Mean | StDev | SE Mean | 90% CI for μ | |
| 75 | 144.25 | 24.95 | 2.88 | (139.45, 149.05) |
μ: mean of Weight
For the weight column 90% of the participants’ weight is between 139 pounds and 149 pounds.
One-Sample T: Activity
Descriptive Statistics
| Mean | StDev | SE Mean | 90% CI for μ | |
| 75 | 2.1333 | 0.5774 | 0.0667 | (2.0223, 2.2444) |
μ: mean of Activity
For the weight we are certain that there are only three results 1,2,3.
4 HYPOTHESIS TESTING: 2 for 1 SAMPLE PROPORTION, and 2 for 1 SAMPLEMEAN.
*For this part of the project, assumed alpha value is 5%
Sample proportion
Test and CI for One Proportion: Sex
Method
| Event: Sex = 2 |
| p: proportion where Sex = 2 |
| Exact method is used for this analysis. |
Descriptive Statistics
| Event | Sample p | 95% CI for p | |
| 75 | 30 | 0.400000 | (0.288519, 0.519630) |
Test
| Null hypothesis | H₀: p = 0.5 |
| Alternative hypothesis | H₁: p ≠ 0.5 |
| P-Value |
| 0.105 |
Test for proportion of 50% of students are female fail to reject the null hypothesis since the p-value is larger than 0.05 and the proposed alpha is 5%.
Test and CI for One Proportion: Smokes
Method
| Event: Smokes = 2 |
| p: proportion where Smokes = 2 |
| Exact method is used for this analysis. |
Descriptive Statistics
| Event | Sample p | 95% CI for p | |
| 75 | 53 | 0.706667 | (0.590217, 0.806191) |
Test
| Null hypothesis | H₀: p = 0.2 |
| Alternative hypothesis | H₁: p ≠ 0.2 |
| P-Value |
| 0.000 |
Test for proportion of 20% of students only do not smoke is rejected, this is since way more than 20% of the students are non-smokers, which is verified by the p-value being less than 5%
ii) Sample mean
One-Sample T: Pulse2
Descriptive Statistics
| Mean | StDev | SE Mean | 90% CI for μ | |
| 75 | 80.83 | 17.50 | 2.02 | (77.46, 84.19) |
μ: mean of Pulse2
Test
| Null hypothesis | H₀: μ = 130 |
| Alternative hypothesis | H₁: μ ≠ 130 |
| T-Value | P-Value |
| -24.33 | 0.000 |
The test above assumes that mean for heartbeats per minute for a person after running is 130, but according to results the null hypothesis is rejected since the p-value is less than 0.05.
One-Sample T: Weight
Descriptive Statistics
| Mean | StDev | SE Mean | 90% CI for μ | |
| 75 | 144.25 | 24.95 | 2.88 | (139.45, 149.05) |
μ: mean of Weight
Test
| Null hypothesis | H₀: μ = 170 |
| Alternative hypothesis | H₁: μ ≠ 170 |
| T-Value | P-Value |
| -8.94 | 0.000 |
For the 1 sample-t test the test assumes that the mean weight is 170 pounds for students in the survey, however, the reported p-value is too low and thus null hypothesis is rejected.
4 different 2 SAMPLE HYPOTHESIS TESTING:
*For this part of the project, assumed alpha value is 5%
Two-Sample T-Test and CI: Pulse1, Smokes
Method
| μ₁: mean of Pulse1 when Smokes = 1 |
| µ₂: mean of Pulse1 when Smokes = 2 |
| Difference: μ₁ - µ₂ |
Equal variances are not assumed for this analysis.
Descriptive Statistics: Pulse1
| Smokes | Mean | StDev | SE Mean | |
| 22 | 76.6 | 12.9 | 2.8 | |
| 53 | 72.2 | 10.2 | 1.4 |
Estimation for Difference
| Difference | 95% CI for |
| 4.41 | (-1.89, 10.71) |
Test
| Null hypothesis | H₀: μ₁ - µ₂ = 0 |
| Alternative hypothesis | H₁: μ₁ - µ₂ ≠ 0 |
| T-Value | DF | P-Value |
| 1.43 | 32 | 0.164 |
The two sample hypothesis test is evaluating the pulse for smokers before running, and according to it the null hypothesis assumed equal heart beats, and thus heart beats are almost same, and since the p-value is larger than 0.05 then the null hypothesis fails to be rejected.
Two-Sample T-Test and CI: Pulse1, Sex
Method
| μ₁: mean of Pulse1 when Sex = 1 |
| µ₂: mean of Pulse1 when Sex = 2 |
| Difference: μ₁ - µ₂ |
Equal variances are not assumed for this analysis.
Descriptive Statistics: Pulse1
| Sex | Mean | StDev | SE Mean | |
| 45 | 71.20 | 9.77 | 1.5 | |
| 30 | 77.0 | 12.4 | 2.3 |
Estimation for Difference
| Difference | 95% Upper Bound |
| -5.80 | -1.30 |
Test
| Null hypothesis | H₀: μ₁ - µ₂ = 0 |
| Alternative hypothesis | H₁: μ₁ - µ₂ < 0 |
| T-Value | DF | P-Value |
| -2.16 | 52 | 0.018 |
The 2-sample t-test for sex and pulse variable hypothesis test assumes that male and female have equal pulse rate on average, and the alternative hypothesis assumes that males have less heart beats per minute, however the results show that the they are almost equal since the p-value is not low enough to reject the null hypothesis.
Two-Sample T-Test and CI: Height, Sex
Method
| μ₁: mean of Height when Sex = 1 |
| µ₂: mean of Height when Sex = 2 |
| Difference: μ₁ - µ₂ |
Equal variances are not assumed for this analysis.
Descriptive Statistics: Height
| Sex | Mean | StDev | SE Mean | |
| 45 | 70.86 | 2.64 | 0.39 | |
| 30 | 65.13 | 2.49 | 0.46 |
Estimation for Difference
| Difference | 95% Lower Bound |
| 5.722 | 4.718 |
Test
| Null hypothesis | H₀: μ₁ - µ₂ = 0 |
| Alternative hypothesis | H₁: μ₁ - µ₂ > 0 |
| T-Value | DF | P-Value |
| 9.51 | 64 | 0.000 |
The 2 sample t-test for sex and height assumed an alternative hypothesis that males are taller than females in the sample, and according to the p-value the null hypothesis is rejected and the H1 is accepted that males in the sample are taller than males.
Two-Sample T-Test and CI: Pulse2, Ran
Method
| μ₁: mean of Pulse2 when Ran = 1 |
| µ₂: mean of Pulse2 when Ran = 2 |
| Difference: μ₁ - µ₂ |
Equal variances are not assumed for this analysis.
Descriptive Statistics: Pulse2
| Ran | Mean | StDev | SE Mean | |
| 31 | 92.5 | 19.4 | 3.5 | |
| 44 | 72.64 | 9.96 | 1.5 |
Estimation for Difference
| Difference | 95% CI for |
| 19.82 | (12.16, 27.47) |
Test
| Null hypothesis | H₀: μ₁ - µ₂ = 0 |
| Alternative hypothesis | H₁: μ₁ - µ₂ ≠ 0 |
| T-Value | DF | P-Value |
| 5.23 | 41 | 0.000 |
The two sample –t test assumes that means of students who ran and who did not run are equal, but the p-value is less than 0.05 and accordingly the null hypothesis is rejected.
Conclusion
Summarizing the project: One page long /double spaced
Tell what you figured out.
30


