PSYC 2317 SOLUTIONS
PSYC 2317
Assignment #2
2.1 An instructor obtained the following set of scores from a 10-point quiz for a class of 26 students:
8, 5, 4, 5, 5, 7, 6, 4, 3, 4, 5, 6, 6,
4, 5, 5, 10, 6, 9, 5, 7, 8, 2, 6, 7, 4
Place the scores in a frequency distribution table.
Sketch a histogram showing the distribution.
Using your graph, answer the following questions:
What is the shape of the distribution?
As a whole, how did the class do on the quiz? Were most scores high or low? Was the quiz easy or hard?
2.2 For each of the following situations, identify the measure of central tendency (mean, median, or mode) that would provide the best description of the “average” or most representative score. Please explain your choice:
A researcher asks each individual in a sample of 50 adults to name his/her favorite season (summer, fall, winter, spring).
An insurance company would like to determine how long people remain hospitalized after a routine appendectomy. The data from a large sample indicate that most people are released after 2 or 3 days but a few develop infections and stay in the hospital for weeks.
A teacher measures scores on a standardized reading test for a sample of children from a middle-class, suburban elementary school.
2.3 Calculate the standard deviation for the following sample of n = 8 scores: 5, 7,
2, 4, 8, 6, 5, 3. (Note: use the standard deviation formula on the formula sheet handout.
Descriptive Statistics Formula Sheet
|
| Sample | Population |
| Characteristic | statistic | Parameter |
| raw scores | x, y, . . . . . | X, Y, . . . . . |
| mean (central tendency) | ∑ x M = n | ∑ X μ = N |
| range (interval/ratio data) | highest minus lowest value | highest minus lowest value |
| deviation (distance from mean) | Deviation = (x − M ) | Deviation = (X − μ ) |
| average deviation (average distance from mean) | ∑(x − M ) n | ∑(X − μ ) N |
| sum of the squares (SS) (computational formula) | SS | (∑ X)2 SS = ∑ X2 − N |
| variance ( average deviation2 or standard deviation2) (computational formula) | s2 = | ∑ X2 − (∑NX)2 σ2 = N |
| standard deviation (average deviation or distance from mean) (computational formula) | s | |
| Z scores (standard scores)
mean = 0 standard deviation = ± 1.0 | x − M deviation Z =
X = M + Zs | Z
X = μ + Zσ |


 = 0
= 0 


 = s stand. dev.
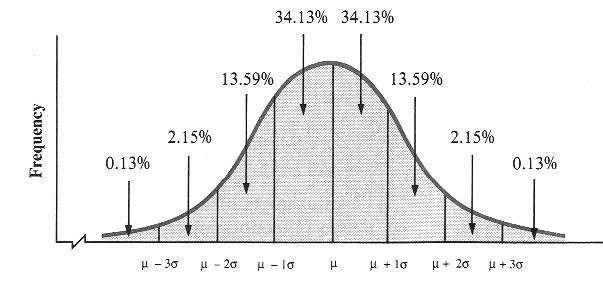
Area Under the Normal Curve -1s to +1s = 68.3%
-2s to +2s = 95.4%
-3s to +3s = 99.7%