Qualitative Methodologies Qualitative methodologies involve collecting non-numerical data, usually through interviews or observation. There are many approaches to qualitative research and no fully agr
Required Text
Malec, T. & Newman, M. (2013). Research methods: Building a knowledge base. San Diego, CA: Bridgepoint Education, Inc. ISBN-13: 9781621785743, ISBN-10: 1621785742.
Section 1.6 Writing a Research Proposal
Chapter 3: Qualitative and Descriptive Designs – Observing Behavior
Section 5.3: Experimental Validity: A Note on Qualitative Research Validity and Reliability
Appendix: Example of a Research Proposal
1.6 Writing a Research Proposal
After reviewing the literature and putting considerable thought into planning a study, the next step is to prepare a research proposal. The goalof any research proposal is to present a detailed description about the research problem and the methods with which you think that theresearch should be conducted. Research proposals are extremely important because they are key to unlocking the research project (Leedy &Ormrod, 2010). They may determine whether you receive approval or funding, so they need to clearly articulate the purpose of the researchand persuade the audience it is worthwhile. If research proposals do not clearly and specifically define the research problem and methods, theproject might not be accepted. Therefore, it is imperative that the research proposal include "a clearly conceived goal and thorough, objectiveevaluation of all aspects of the research endeavor" (Leedy & Ormrod, 2010, p. 117).
Research proposals can range from three pages for some grant applications to more than 30 pages (e.g., for a dissertation or federal grant).They may or may not require an abstract and will have a different format for institutional review board (IRB) approval (see Section 1.7, Ethics inResearch). For our purposes, in general, research proposals follow a standard format. The following is an example you might use:
Title/Cover Page
Abstract
Introduction or Statement of the Problem
The research problem
The statement of the problem and possible subproblems
The purpose statement
Hypotheses and/or research questions
Independent and dependent variables
The assumptions
The importance of the study
Review of the Literature
Method
Research methodology
Participants and participant selection
Data collection procedures
Data analysis techniques
Discussion
Strengths and limitations
Ethical considerations
References
Appendixes
Research proposals are written like research articles in APA style, which is favored in academia. The language must be clear and precise, inparagraph format, and written in a professional, academic manner. Unlike stories or memoirs, proposals are not intended to be creative literaryworks; rather, they should set down certain facts. Organized with headings and subheadings, the proposal should clearly and specifically explainthe research problem, who the participants will be and how they will be selected, what data collection methods will be used, and how the datawill be analyzed and interpreted. Research proposals are required for all theses and dissertations. If you are currently working on a master'sthesis or doctoral dissertation, your university or committee chair may have a specific format for you to follow that may differ slightly from theformat presented in this book. An example of an APA formatted proposal is provided in the Appendix.
Formatting the Research Proposal
As mentioned previously, research proposals are written in APA style and follow an organized format. Although there are different ways toformat a proposal, most follow a similar format to the one that is discussed in this book. The following sections will discuss the specifics offormatting of your proposal as well as the content that should be included within each section.
Headings and Subheadings
Writing a proposal in APA style may seem complicated at first; however, the format is similar to a research paper or any academic paper that isrequired to be written in APA style. APA style uses a unique heading and subheading system that separates and classifies sections of researchpapers. The Publication Manual of the American Psychological Association Sixth Edition (2010) utilizes five heading levels; although all headinglevels may not be used, it is important to follow them in sequential order:
Level 1: Centered, Boldface, Uppercase and Lowercase Heading
Level 2: Left-aligned, Boldface, Uppercase and Lowercase Heading
Level 3: Indented five spaces, boldface, lowercase heading with a period. For Level 3 headings, the body text begins after the period.
Level 4: Indented five spaces, boldface, italicized, lowercase heading with a period. For Level 4 headings, the body text begins after theperiod.
Level 5: Indented five spaces, italicized, lowercase heading with a period. For Level 5 headings, the body text begins after the period.
Section headings such as Review of the Literature, Methods, and so forth, are Level 1 headings. Subsection headings such as Participants, DataCollection, and so on, that follow under the section heading Methods, for example, are Level 2 headings. Subsections of subsection headings areLevel 3 through Level 5. The following is an example of the various heading levels you might use in your research proposal:
| Introduction (Level 1) |
| The Research Problem (Level 2) |
| Review of the Literature (Level 1) |
| The Cognitive Profile of Learning Disabilities in Reading (Level 2) |
| Method (Level 1) |
| Research Methodology (Level 2) |
| Discussion (Level 1) |
| Strengths and Limitations (Level 2) |
| References (Level 1) |
| Appendix (Level 1) |
The Title Page
A title page is required for all research proposals as its first page. In general, title pages include a running head with the page number, as wellas the abbreviated title of the paper, the student's name, and the university or institution name. Although some universities may have specificrequirements regarding how the title page is formatted, the following is formatted according to APA style:
| Running head: PREMORBID COGNITIVE ABILITIES |
Estimation of Premorbid Cognitive Abilities in
Children with Traumatic Brain Injury
Graduate Student
Research University
The running head is a shortened version of the full title and is included in the top margin of the page. The running head is set flush left withthe abbreviated title in all capital letters. On the same line of the running head, the page number is set flush right. The title of the paper, thestudent's name, and the university affiliation are centered approximately in the middle of the page and formatted in uppercase and lowercaseletters. It is recommended that titles include no more than 12 words.
The Abstract Page
The abstract page is page two of your paper. An abstract is a summary of your proposal and should include the research problem, theparticipants, data collection methods, and any hypotheses or research questions. Abstracts for research proposals are generally between 150and 250 words in length.
The abstract should contain your running head title from the title page as well as the page number. As shown in the example, the first word ofthe abstract is not indented. Thus, the entire abstract is set flush left. Please keep in mind that the title "running head" is dropped after pageone and only the abbreviated title and page number are included, as shown below:
| PREMORBID COGNITIVE ABILITIES |
Abstract
The present study will review currently available methods for estimating premorbid intellectual abilities inchildren. It examines the potential of the Wechsler Intelligence Scale for Children–Fourth Edition (WISC–IV;Wechsler, 2003) as an estimate of premorbid IQ in children with traumatic brain injury (TBI). Archival data willbe obtained from a sample of 2,200 children aged 6:0–16:11 who participated in the standardization phase ofthe WISC–IV and 43 children aged 6:0–16:11 with a history of moderate or severe TBI who participated in aWISC–IV special group study. First, demographic variables including sex, ethnicity, parent education level, andgeographic region will be entered into a regression analysis to determine a demographic-based premorbidprediction equation for the WISC–IV Full Scale Intelligence Quotient (FSIQ). Second, a logistic regressionanalysis will be used to investigate which WISC–IV subtest–scaled scores improve the differential diagnosis ofTBI versus a matched control group. Third, analysis of variance (ANOVA) will be used to examine whichsubtests yielded the lowest mean scores for the TBI group. It is expected that parental education will be thestrongest predictor of premorbid IQ and that individuals with TBI will have lower scores on Processing Speedand Working Memory indices.
The Introduction Section
The Introduction section begins on page three of your proposal. The primary purpose of the Introduction section is to introduce the reader tothe nature of the study by including necessary background that describes and supports your research problem. The introduction generallyincludes a statement of the research problem, any potential subproblems, the purpose statement, hypotheses and/or research questions,identification of the variables, assumptions of the study, and importance of the study. The introduction typically begins with a statement of theresearch problem area and is followed by a justification for your proposed study. Only research needed to explain the purpose of or need foryour study should be included in this section.
As discussed previously, the purpose statement should include the focus, population, and methodology of the study. Depending upon whetheryour research is quantitative or qualitative, you will want to include your hypotheses and/or research questions next and discuss how yourhypotheses and/or research questions relate to your research problem and purpose statement. You should next review the key independent anddependent variables, followed by a discussion of the assumptions you will make about the research and how the research will be expected tocontribute to the field.
The length of the introduction can vary based on your university, committee chair, or instructor's requirements. In general, the introductionsection ranges anywhere from 3 to 5 pages to 15 to 25 pages. The more detailed information you include in your proposal, the closer you willbe to completing your thesis or dissertation.
The Literature Review Section
The primary purpose of the literature review is to provide theoretical perspectives and previous research findings on the research problem youhave selected (Leedy & Ormrod, 2010). As a researcher, you should investigate your topic extremely well so that you have a thoroughunderstanding about the research problem area. Thus, your literature review should contain both breadth and depth, and clarity and rigor, inorder to support the need for your research to be conducted. Any reader of your literature review should be able to comprehend theimportance of your research problem and the difference the research will make to the field. Keep in mind that a literature review is not simplya collection of summaries, abstracts, or annotated bibliographies but rather a thorough analysis and synthesized review of the research and howeach piece of research builds upon the other.
According to Levy and Ellis (2006), a literature review should go through the following steps: (a) methodologically analyze and synthesize qualityliterature, (b) provide a firm foundation to a research topic, (c) provide a firm foundation to the selection of research methodology, and (d)demonstrate that the proposed research contributes something new to the overall body of knowledge or advances the research field'sknowledge base (p. 182). Remember: Your literature review should provide a theoretical foundation and justification for your proposed study.
A good literature review does not simply report the literature but evaluates, organizes, and synthesizes it (Leedy & Ormrod, 2010). Whenreading and reviewing existing literature, it is important to critically evaluate what has already been done and what the findings showed. Do notjust take what the authors say at face value; instead, evaluate whether the findings support the methods that were used and the analyses thatwere conducted.
In addition to evaluating the literature, you must organize it. This means grouping the literature according to your subproblem areas, researchquestions, or variables being assessed. For example, if conducting a study on the demographic predictors of special education, you would wantto group your literature based on the various demographic variables and the influences that they may have on placement in special education.Finally and most importantly, you must synthesize the diverse perspectives and research results you've read into a cohesive whole (Leedy &Ormrod, 2010). Leedy and Ormrod (2010) discuss several approaches to synthesizing information, including the following:
comparing and contrasting the literature
showing how the literature has changed over time
identifying trends or similarities in research findings
identifying discrepancies or contradictions in research findings
locating similar themes across the literature
The following example shows a paragraph synthesizing the literature. Note that the review does not include summaries of the articles but ratherdisplays similarities found in the research:
Several studies have examined the relationship between demographic variables and cognitive functioning.Research has shown that demographic variables such as socioeconomic status and education level are closelyrelated to scores on cognitive tests and contribute significantly to variance in IQ scores (Crawford, 1992;Kaufman, 1990). Utilizing this close relationship, Wilson et al. (1978) developed the first regression equation topredict premorbid IQ using the WAIS standardization sample. The equation included age, sex, race, education,and occupation and accounted for 53% of the variance in the Verbal IQ, 42% of the variance in thePerformance IQ, and 54% of the variance in the Full Scale IQ. Cross-validation studies have confirmed theWilson et al. equation to be a useful predictor of premorbid IQ. The equation has been used to predictoutcome from closed head injury (Williams, Gomes, Drudge, & Kessler, 1984), to estimate British WAIS scores(Crawford, Stewart et al., 1989), and to estimate premorbid functioning among healthy adults (Goldstein, Gary,and Levin, 1986). Although the use and application of Wilson's formula has tended to overpredict high scoresand underpredict low scores, the formula appears to provide adequate predictions for those within theaverage range of functioning.
An example of a compare-and-contrast synthesized review would look like the following:
As with all regression-based methods, a number of limitations are present in the use of demographic-basedprediction models. As Karzmark, Heaton, Grant, and Matthews (1985) found in their use of the Wilson et al.formula to predict WAIS IQ scores, demographic equations tend to overestimate and underestimate IQ scoresfor individuals who are one standard deviation or more from the population mean. Research has shown strongcorrelations between specific demographic variables and measured IQ scores, but Bolter, Gouvier, Veneklasen,and Long (1982) found the Wilson et al. equation to be limited in its ability to predict groups of head injuredindividuals and controls.
On the other hand, Wilson, Rosenbaum, and Brown (1979) compared the hold method of the DeteriorationIndex developed by Wechsler in 1958 against Wilson's 1978 demographic equation and found the Wilson et al.formula to have a 73% accuracy of classification, while the Wechsler method resulted in only 62% accuracy.Although the demographic-based method may have mixed results at an individual level, cross-validationstudies have shown them to do an adequate job of predicting mean IQ scores at the group level (Vanderploeg,1994).
Remember that writing a literature review takes time and organization. It is important that you thoroughly review the relevant literature youuncovered in your key term search. This can be a painstaking endeavor, but the search should not conclude until you are reasonably sure youhave researched all the critical viewpoints of your research problem. It is also helpful to develop an outline of topics you plan on addressing.
Finally, note that a good literature review is not plagiarized or copied and pasted from other sources, as the Internet makes so tempting. Whenreviewing literature, be sure you summarize the information in your own words and give credit where credit is due. It is sometimes helpful toread the literature and then develop summaries of the articles in your own words. You can then use these summaries to develop your literaturereview. Keep in mind that your literature review is a working draft that will be modified and perfected throughout the research process.
The Method Section
The method section includes a detailed description of the method of inquiry (quantitative, qualitative, or mixed design approach); researchmethodology used; the sample; data collection procedures; and data analysis techniques. The key purpose of the method section is to discussyour design and the specific steps and procedures you plan to follow in order to complete your study. A detailed description of methods isessential in any research proposal because it allows others to examine the efficacy of the study as well as replicate it in the future.
Research Methodology
This section discusses whether quantitative, qualitative, or a mixed design approach was used and the rationale for choosing this method ofinquiry. It also includes specific information on the selected research methodology. For example, will your study be utilizing experimentalmethods, quasi-experimental methods, or observational methods? And what is the purpose for selecting that method or methods? Rememberthat you should be making an argument and justifying the type of research methodology you plan to use, regardless of the type of inquiry.
Participants
The participant section describes the population of interest and the sample that will be used. In quantitative studies, the sample is intended torepresent the larger population and tends to be larger in size than for qualitative studies. In qualitative studies, the sample may be a smallnumber of participants or even only one participant and is not intended to represent the larger population. In both quantitative and qualitativestudies, this section should discuss the sample in detail: the population you want to learn about; where participants will be recruited or studied;how the participants will be notified about the study; how the participants will be selected (e.g., what type of sampling method will be used,such as random sampling, snowball sampling, etc.); what criteria will be required for inclusion in the study (e.g., age, level of educationobtained, marital status, employment position); and the overall proposed size of the sample. For quantitative studies, when discussing thesample, it is also important to include which demographic information (e.g., age, gender, ethnicity, level of education, socioeconomic status) youwill need to create a representative sample of the entire population. A representative sample ensures that the results can be generalized to theentire population as a whole.
Data Collection Procedures
The data collection section describes how the data will be collected, step by step. This section should detail how informed consent will beobtained from the participants, when the data will be collected and for how long, and what methods or measures will be used to collect thedata. Remember: Providing detailed information is crucial to ensure that others can follow your study and replicate it in the future. Thus, thissection should include a step-by-step description of each of the procedures you will follow to carry out the data collection. Describe the datacollection forms you will use, as well as any survey, research, or testing instruments you may use or develop to collect the data, and therationale for utilizing such procedures. Copies of any forms or instruments used should be included in the Appendix section of your researchproposal.
Data Analysis
The data analysis section includes a brief step-by-step description of how the data will be analyzed as well as what statistical methods or othermethods of analysis and software will be utilized. If you are doing quantitative method research, you will want to discuss how the data will beentered into a statistical software program, how the data will be kept confidential, and what statistical analyses will be run. If using qualitativemethods, you will want to discuss the type of qualitative method used, the interview type, interview questions, sample type (e.g., random,convenience), how the data will be reviewed (e.g., how interviews or observations will be reviewed or transcribed), and how the data will becoded.
The Discussion Section
As emphasized throughout this chapter, one of the most important characteristics of a research proposal is to make a strong case for or justifythe need to study your research problem. In doing so, you will want to discuss the strengths of your research study as well as any limitationsand ethical issues that will need to be considered. It should be noted that some universities require this information to be included in theMethod section. In those cases, you would include strengths, limitations, and ethical considerations after the Data Analysis heading in theMethod section.
Strengths and Limitations
This section is fairly straightforward. It should discuss the implications for future research, practice, and theory as well as any potentiallimitations that might impact the research process or results. Some limitations may include difficulty in obtaining participants, difficulty inobtaining a representative sample, or time and financial constraints.
Ethical Considerations
This section should include any potential issues that might be considered ethical dilemmas. For example, if studying minors, how will you obtainconsent and ensure confidentiality? If studying certain employees, how will you keep information from their supervisors? Or if your study maytrigger emotional trauma, such as memories about abuse, how will you reduce any stress or negative feelings that occur during the study?
The References Section
This section should include all references that were cited within your proposal in alphabetical order and using APA style. Only references usedwithin your proposal should be included on the References page; conversely, there should be no references listed on the References page thatwere not cited in your proposal.
It is important to list all references in correct APA format. The following examples show how to correctly cite journal articles, websites, andbooks according to the APA Publication Manual Sixth Edition:
Example of a journal article with the document ID number included:
Brownlie, D. (2007). Toward effective poster presentations: An annotated bibliography. European Journal of Marketing, 41, 1245–1283.doi:10.1108/03090560710821161
Example of a journal article with no document ID assigned to it:
Kenneth, I. A. (2000). A Buddhist response to the nature of human rights. Journal of Buddhist Ethics, 8. Retrieved fromhttp://www.cac.psu.edu/jbe/twocont.html
Example of a print (or hardcopy) journal article:
Harlow, H. F. (1983). Fundamentals for preparing psychology journal articles. Journal of Comparative and Physiological Psychology, 55, 893–896.
Example of a textbook:
Calfee, R. C., & Valencia, R. R. (1991). APA guide to preparing manuscripts for journal publication. Washington, DC: American PsychologicalAssociation.
Example of a chapter in a textbook:
O'Neil, J. M., & Egan, J. (1992). Men's and women's gender role journeys: A metaphor for healing, transition, and transformation. In B. R.Wainrib (Ed.), Gender issues across the life cycle (pp. 107–123). New York, NY: Springer.
Example of a website:
Keys, J. P. (1997). Research design in occupational education. Retrieved from http://www.okstate.edu
The Appendix Section
The Appendix section should include a copy of any forms that will be used during your research. These include consent forms, instructions forparticipants, and any additional tables or figures that might supplement study information but not provide additional data (e.g., a table ofsubtests included within an instrument you plan to use).
Chapter 3
Qualitative and Descriptive Designs—ObservingBehavior

John Foxx/Stockbyte/Thinkstock
Chapter ContentsQualitative and Descriptive Research Designs
Qualitative Research Interviews
Critiquing a Qualitative Study
Writing the Qualitative Research Proposal
Describing Data in Descriptive Research
In the fall of 2009, Phoebe Prince and her family relocated from Ireland to South Hadley, Massachusetts. Phoebe was immediately singled outby bullies at her new high school and subjected to physical threats, insults about her Irish heritage, and harassing posts on her Facebook page.This relentless bullying continued until January of 2010, ending only because Phoebe elected to take her own life in order to escape hertormentors (United Press International, 2011). Tragic stories like this one are all too common, and it should come as no surprise that theCenters for Disease Control and Prevention (CDC) have identified bullying as a serious problem facing our nation's children and adolescents(Centers for Disease Control and Prevention [CDC], 2012).
Scientific research on bullying began in Norway in the late 1970s in response to a wave of teen suicides. Work begun by psychologist DanOlweus—and since continued by many others—has documented both the frequency and the consequences of bullying in the school system.Thus, we know that approximately one third of children are victims of bullying at some point during development, with between 5% and 10%bullied on a regular basis (Griffin & Gross, 2004; Nansel et al., 2001). Victimization by bullies has been linked to a wide range of emotional andbehavioral problems, including depression, anxiety, self-reported health problems, and an increased risk of both violent behavior and suicide (fora detailed review, see Griffin & Gross, 2004). Recent research even suggests that bullying during adolescence may have a lasting impact on thebody's physiological stress response (Hamilton et al., 2008).
But most of this research has a common limitation: It has studied the phenomenon of bullying using self-report survey measures. That is,researchers typically ask students and teachers to describe the extent of bullying in the schools or have students fill out a collection of surveymeasures, describing in their own words both bullying experiences and psychological functioning. These studies are conducted rigorously, andthe measures they use certainly meet the criteria of reliability and validity that we discussed in Chapter 2 (Section 2.2, Reliability and Validity).However, as Wendy Craig, Professor of Psychology at Queen's University, and Debra Pepler, a Distinguished Professor at York University,suggested in a 1997 article, this questionnaire approach is unable to capture the full context of bullying behaviors. And, as we have alreadydiscussed, self-report measures are fully dependent on people's ability to answer honestly and accurately.
In order to address this limitation, Craig and Pepler (1997) decided to observe bullying behaviors as they occurred naturally on the playground.Among other things, the researchers found that acts of bullying occurred approximately every 7 minutes, lasted only about 38 seconds, andtended to occur within 120 feet of the school building. They also found that peers intervened to try to stop the bullying more than twice asoften as adults did (11% versus 4%, respectively). These findings add significantly to scientific understanding of when and how bullying occurs.And for our purposes, the most notable thing about them is that none of the findings could have been documented without directly observingand recording bullying behaviors on the playground. By using this technique, the researchers were able to gain a more thorough understandingof the phenomenon of bullying and thus able to provide real-world advice to teachers and parents. Qualitative research is valuable when thenature of a phenomenon such as bullying, its signs, symptoms, dynamics, and emotional consequences are not well understood.
One recurring theme in this book is that it is absolutely critical to pick the right research design to address your hypothesis. Over the next threechapters, we will be discussing three specific categories of research designs, proceeding in order of increasing control over elements of thedesign: descriptive designs, quasi-experimental designs, and true experimental designs. This chapter will also focus on qualitative researchdesigns that have similar levels of control as the case study, in which the primary goal is to examine phenomena of interest in great detail. Wewill begin by discussing qualitative designs, including ethnography study, phenomenological study, and grounded theory study. We will thendiscuss three prominent examples of descriptive designs that can be used in either qualitative or quantitative approaches—case studies, archivalresearch, and observational research—covering the basic concepts, the pros and cons, and contrasting qualitative and quantitative approachesof each design (see Figure 3.1). We go on to discuss interview techniques and then offer guidelines for presenting descriptive data in graphical,numerical, and narrative form. Finally, we show how to critique a study and write a proposal for qualitative research projects.
Figure 3.1: Qualitative and descriptive research on the continuum of control 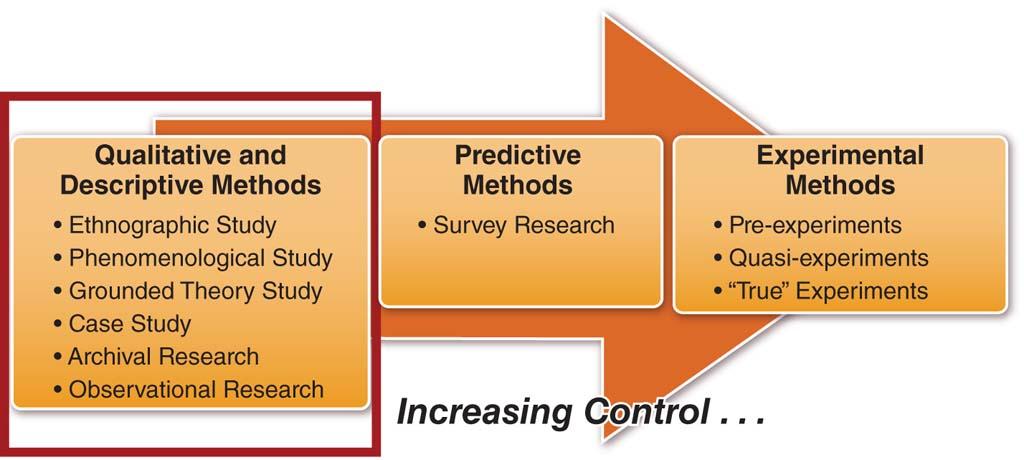
3.1 Qualitative and Descriptive Research Designs
We learned in Chapter 1 that researchers generally take one of two broad approaches to answering their research questions. Quantitativeresearch is a systematic, empirical approach that attempts to generalize results to other contexts, whereas qualitative research is a moredescriptive approach that attempts to gain a deep understanding of particular cases and contexts. Before we discuss specific examples of bothqualitative and descriptive designs, it is important to understand that descriptive designs can represent either quantitative or qualitativeperspectives, whereas qualitative designs represent only qualitative perspectives. In this section, we examine the qualitative and descriptiveapproaches in more detail.
In Chapter 1, we used the analogy of studying traffic patterns to contrast qualitative and quantitative methods—a quantitative researcher woulddo a "flyover" and perform a statistical analysis, whereas a qualitative researcher would likely study a single busy intersection in detail. Thisillustrates a key point about the latter approach. All qualitative approaches have two characteristics in common: (1) Focusing on phenomenathat occur in natural or real-world settings; and (2) studying those phenomena in their complexity.
Qualitative researchers focus on interpreting and making sense out of what they observe rather than trying to simplify and quantify theseobservations. In general, qualitative research involves collecting interviews, recordings, and observations made in a natural setting. Regardless ofthe overall approach (qualitative or quantitative), however, collecting data in the real world results in less control and structure than doescollecting data in a laboratory setting. But whereas quantitative researchers might view reduced control as a threat to reliability and validity,qualitative researchers view it as a strength of the study because the phenomenon of interest is being studied in its natural environment. Byconducting observations in a natural setting, it is possible to capture people's natural and unfiltered responses. The concepts of reliability andvalidity for both qualitative and quantitative approaches are discussed further in Chapter 5.
As an example, consider two studies on the ways people respond to traumatic events. In a 1993 paper, psychologists James Pennebaker andKent Harber took a quantitative approach to examining the community-wide impact of the 1989 Loma Prieta earthquake (centered in the SanFrancisco Bay Area). These researchers conducted phone surveys of 789 area residents, asking people to indicate, using a 10-point scale, howoften they "thought about" and "talked about" the earthquake during the 3-month period after its occurrence. In analyzing these data,Pennebaker and Harber discovered that people tend to stop talking about traumatic events about 2 weeks after they occur but keep thinkingabout the event for approximately 4 more weeks. That is, the event is still on people's minds, but they decide to stop discussing it with otherpeople. In a follow-up study using the 1991 Gulf War, these researchers found that this conflict between thoughts and their verbalization leadsto an increased risk of illness (Pennebaker & Harber, 1993). Thus, the goal of the study was to gather data in a controlled manner and test a setof hypotheses about community responses to trauma.
Contrast this approach with the more qualitative one taken by the developmental psychologist Paul Miller and colleagues (2012), who used aqualitative approach to study the ways that parents model coping behavior for their children. These researchers conducted semistructuredinterviews of 24 parents whose families had been evacuated following the 2007 wildfires in San Diego County and an additional 32 parentswhose families had been evacuated following a 2008 series of deadly tornadoes in Tennessee. Owing to a lack of prior research on how parentsteach their children to cope with trauma, Miller and colleagues approached their interviews with the goal of "documenting and describing" (p.8) these processes. That is, rather than attempt to impose structure and test a strict hypothesis, the researchers focused on learning from theseinterviews and letting the interviewees' perspectives drive the acquisition of knowledge.
Qualitative research is undertaken in many academic disciplines, including, psychology, sociology, anthropology, biology, education, history, andmedicine (Leedy & Ormrod, 2010). Although once frowned upon in the fields of psychology and education, due to their subjective nature,qualitative techniques have gained wide acceptance as legitimate research. In fact, many researchers argue that qualitative research is thebeginning step to all types of inquiry. Thus, qualitative research can explore unknown topics, unknown variables, and inadequate theory basesand thereby assist in the generating of hypotheses for future quantitative studies.
Unlike quantitative studies, qualitative studies do not allow the researcher to identify cause-and-effect relationships among variables. Rather, thefocus is on describing, interpreting, verifying, and evaluating phenomena, such as personal experiences, events, and behaviors, in their naturalenvironment. The most common forms of qualitative data collection techniques are observations, interviews, videotapes, focus groups, anddocument review. Creswell (2009) lists the following characteristics as generally present in most types of qualitative research:
Data collection occurs in the natural or real-world setting where participants experience the issue or problem being investigated.
The researcher is the key instrument used to collect data through means of examining documents, observing behavior, or interviewingparticipants.
Multiple sources of data are collected and reviewed.
As discussed in Chapter 1, qualitative researchers use inductive data analysis and build patterns and themes from the bottom up.
Focus is on understanding the participants' experiences, not on what the researcher believes those experiences mean.
The research process is emergent and can change after the researcher enters the field and begins collecting data.
Researchers as well as participants and readers interpret what they see, hear, and understand. This results in multiple views of the problem.
Researchers attempt to develop a complex picture of the problem under investigation, utilizing multiple methods of data collection.
Descriptive research does not fit neatly into the categories of either qualitative or quantitative methodologies; instead, it can utilize qualitative,quantitative, or a mixture of both methods to describe and interpret events, conditions, behaviors, feelings, and situations. In all cases,descriptive research investigates situations as they are, and similar to qualitative designs, does not involve changing (controlling) the situationunder investigation or attempting to determine cause-and-effect relationships. However, unlike qualitative designs, descriptive designs usuallyyield quantitative data that can be analyzed using statistical analyses. That is, descriptive research gathers data that describe events and thenorganizes, tabulates, depicts, and describes the collected data, often using visual aids such as graphs, tables, and charts.
Collecting data for descriptive research can be done with a single method or a variety of methods, depending upon the research questions. Themost common data collection methods utilized in descriptive research include surveys, interviews, observations, and portfolios. In general,descriptive research often yields rich data that can lead to important recommendations and findings.
In the following six sections, we examine six specific examples of qualitative and descriptive designs: ethnography, phenomenological studies,grounded theory studies, case studies, archival research, and observational research. The sections on ethnography, phenomenological studies,and grounded theory studies will focus specifically on the qualitative uses of these methods, since these are qualitative-only research methods.Because case studies, archival research, and observational research share the goals of describing attitudes, feelings, and behaviors, each one canbe undertaken from either a quantitative or a qualitative perspective. In other words, qualitative and quantitative researchers use many of thesame general methods but do so with different ends in mind. To illustrate this flexibility, we will end these three sections with a paragraph thatcontrasts qualitative and quantitative uses of the particular method.
Ethnography Study (Qualitative Design) 
Ingram Publishing/Thinkstock
Employees who are part of an officeculture are an example of those whomight be studied in an ethnography.
Ethnographies were first developed by anthropologists to examine human society and various culturalgroups but are now frequently used in the sociology, psychology, and education fields. In fact, todayethnographies are probably the most widely used qualitative method for researching social and culturalconditions. Unlike case studies (which will be discussed later in this chapter) that examine a particularperson or event, ethnographies focus on an entire cultural group or a group that shares a commonculture. Although culture has various definitions, it usually refers to "the beliefs, values and attitudesthat shape the behavior of a particular group of people" (Merriam & Associates, 2002, p. 8). The conceptof what a culture is has also changed over time. Recently, more research has focused on smaller groups,such as classrooms and work offices, than on larger groups, such as northwest Alaskan Natives.
Regardless of whether the cultural group is a classroom or an entire ethnic group in a particular regionof the world, ethnographic research involves studying an entire community in order to obtain a holisticpicture of it. For example, in addition to studying behaviors, researchers will examine the economic,social, and cultural contexts that shape the community or were formed by the community.
In order to thoroughly study a particular cultural group, researchers will often immerse themselves in thecommunity. That is, the researcher will live in the study community for a prolonged period andparticipate in the daily routine and activities of those being studied. This is called participantobservation. Such prolonged involvement is necessary in order to observe and record processes thatoccur over time. Participant observation is an important data collection procedure in ethnographicresearch; thus, it is imperative that the researcher establish rapport and build trusting relationships withthe individuals he or she is studying (Hennink, Hutter, & Bailey, 2011). Establishing trusting relationshipscan be a quite lengthy process, which is why ethnographic studies usually span long periods of time.
Steps in Ethnographic ResearchSeveral steps are involved in conducting site-based research and data collection. First, the researcher must select a site or community that willaddress the research questions being asked. Because researchers should not have any expectations regarding the outcome of the study, it isbest if the researcher selects a site that he or she is not affiliated with. Selecting sites that the researcher is acquainted with may make itdifficult for him or her to study the group in an unbiased manner.
The next step involves gaining entry into the site. This can be a difficult task, as some researchers may not be well received. Therefore, asuccessful entrance into a site requires having access to a gatekeeper, an individual "who can provide a smooth entrance into the site" (Leedy &Ormrod, 2010, p. 139). Gatekeepers may include a principal of a school, a leader of a community, a director of a company, a tribal shaman, orany other well-respected leader of a particular cultural group.
Once inside the site, the researcher must take several delicate steps, including establishing rapport with individuals and forming trustingrelationships. As mentioned previously, establishing rapport is one of the most critical aspects of participant observation and provides afoundation for the quality and quantity of data that will be collected. Initially, establishing trust will involve interacting with everyone. At somepoint, however, the researcher will generally select key "informants" who can assist him or her in collecting the data. Finally, similar to all typesof research, the researcher will need to inform individuals about why he or she is there and the purpose of the study.
As with case studies, data collection and data analysis tend to occur simultaneously. Data collection may include making observations, obtainingrecordings, conducting interviews, and/or collecting records from the group. As the information is being collected, the researcher will readthrough it in great detail to obtain a general sense of what has been collected and to reflect on what all the data mean.
The next step is to organize the data based on events, issues, opinions, behaviors, and other factors and begin to analyze it by sorting the datainto categories. The categorized information will allow the researcher to observe any potential patterns or commonalities that may exist, as wellas to identify any key or critical events.
In addition to categorizing and observing patterns, the researcher will generally develop thick descriptions of the data, which "involves readingthe data and delving deeper into each issue by exploring its context, meaning, and the nuances that surround it" (Hennink, Hutter, & Bailey,2011, p. 239). For example, thick descriptions answer questions about the data such as, What is the issue? Why does it occur? When does itoccur? What are the perceptions about the issue? What are some explanations about the issue? and, Is the issue related to other data? Thickdescriptions provide additional information on potential connections and relationships that will be useful during data interpretation.
Pros and Cons of EthnographyThrough extensive and expansive investigation that is often personally involving for the researcher, ethnography allows the examination of aparticular cultural group in great detail. This method provides a holistic picture and understanding of the group as well as diverse aspects of it.It also allows great flexibility in the types of data collection methods that can be used. However, as we have seen, ethnographic researchrequires a long process of obtaining data and, therefore, can be quite expensive and time consuming. In addition, if one is not familiar with thevarious data collection methods, immersing oneself into a group without a clear idea of how to collect data from it can be overwhelming anddistracting.
As with all forms of participant observation, researcher bias and participant-expectancy bias (or the participant-observer effect) should beconsidered when examining the results of ethnographic research, and in all qualitative research for that matter. Researcher bias occurs whenthe researcher influences the results in order to portray a certain outcome. This type of bias can influence how the data are collected, as well ashow it is analyzed and interpreted. It can also impact what type of data is collected, how the data are categorized, and what types ofconclusions are drawn from the data analysis. For example, if a researcher is not able to lay aside his or her beliefs or assumptions, the type ofdata collected and the conclusions that are drawn could be biased or misleading. Also, we must take into account the influence that theresearcher has on the participants' behaviors and actions. Human nature being what it is, participants sometimes alter their normal behaviors tobe consistent with what they think the researcher is expecting from them or act differently simply because they are being observed.
Phenomenological Study (Qualitative Design) 
Tyler Stableford/Iconica/Getty Images
Phenomenological studies attempt tounder-stand what it is like to experiencea certain event, such as returning homefrom war.
In the same way that ethnography focuses on cultural groups and their behaviors and experiences, a phenomenological study focuses on the person's perceptions and understandings of an experience. Aphenomenological study is one that attempts to understand the inner experiences of an event, such as aperson's perceptions, perspectives, and understandings (Leedy & Ormrod, 2010). Phenomenologicalstudies are concerned primarily with understanding what it is like to experience certain events. Forexample, researchers might be interested in studying the experiences of military spouses who havespouses deployed, wounded soldiers coming back from war, juvenile offenders' perceptions of thetherapeutic relationship in counseling, or elderly individuals being placed into a nursing home. In anysituation, the idea is to better understand the subjective or personal perspectives of different people asthey experience a particular event.
Some researchers conduct phenomenologicalstudies to obtain a more thorough understanding of anexperience that they have personally gone through. Looking at an experience or phenomenon frommultiple perspectives can allow them to generalize about what it is like to experience that phenomenon.However, regardless of the reason for wanting to conduct the research, it is important that the researcher set aside his or her personal beliefsand attitudes toward the experience in order to see and fully understand the essence of the phenomenon being studied (Merriam & Associates,2002).
Steps in Phenomenological ResearchPhenomenological research is generally conducted through in-depth, unstructured, and recorded interviews with a select participant sample (seeSection 3.2, Qualitative Research Interviews). The sample size is usually between 5 and 25 participants who have directly experienced thephenomenon being studied (Creswell, 1998). Unstructured interviews are conducted individually with each participant, which allows theresearcher to follow the participant's experiences thoroughly and ask spontaneous questions based on what is being discussed. Generally,unstructured interviews do not contain any predetermined questions, although some researchers develop a few questions to guide theinterview, which is acceptable in phenomenological research. Thus, a typical phenomenological interview is more like an informal conversation,although the participant does most of the talking and the researcher does most of the listening. In addition to listening, the researcher shouldalso note any meaningful facial expressions or body language, as these can provide additional information regarding the intensity of a feeling orthought.
In phenomenological studies, data are usually analyzed by identifying common themes across people's experiences. Themes are created by firsttranscribing the information from the interview in full and then editing to remove any unnecessary content. The next step is to group commonstatements from the interviews into categories that reflect the various aspects of the experience as well as to examine any divergentperspectives among subjects. The final step is to develop an overall description of how people experience the phenomenon (Leedy & Ormrod,2010).
Pros and Cons of Phenomenological StudiesPhenomenological studies give researchers a comprehensive view of a particular phenomenon, which is experienced by many but illumined bystudying the subjective responses of a few. Unstructured interviews provide a wealth of data while allowing participants to describe theirexperiences in their own way and under their own terms. Phenomenological studies are rich in personal experiences and provide a morecomplete or holistic view of what people experience.
Phenomenological studies can also be flawed if the interviews veer off topic or communication misunderstandings crop up. For example, somerecorded information may be difficult to understand. In addition, interviews, data analysis, and data interpretation can be influenced byresearcher bias regarding the experience. As mentioned previously, if a researcher has personally experienced the phenomenon being studied(rape would be an emotionally charged example), it is possible that he or she may bring preconceived notions or prejudices to the study, whichwill in turn influence how the data are collected and interpreted.
Grounded Theory Study (Qualitative Design)Unlike most qualitative research, grounded theory does not begin from a theoretical perspective or theory but rather utilizes data that arecollected to develop new theories or hypotheses. According to Smith and Davis (2010), "A grounded theory is one that is uncovered, developed,and conditionally confirmed through collecting and making sense of data related to the issue at hand" (p. 54). Thus, theories are built from"grounded" data that have been systematically analyzed and reanalyzed. Grounded theory is typically used in qualitative research; however,grounded theory can utilize either qualitative or quantitative data (Glaser, 2008), or a mixture of the two. As Glaser posits, grounded theory isnot only considered a qualitative method but a general method in research. For example, you may use grounded theory as the only method foryour qualitative study, or you may choose to use it as the first step toward identifying constructs and generating hypotheses about theirrelationships to one another. You may then want to employ a quantitative, cause-and-effect design to further test your hypotheses that weredeveloped from your grounded theory study.
Grounded theory is especially useful for exploring the relationships and behaviors of groups that either have not been previously studied orhave been inadequately studied. Grounded theory has been used to study a wide variety of topics, such as stress management in Olympicchampions (Fletcher & Sakar, 2012), the role of leaders in knowledge management (Lakshman, 2007), reflections of therapists during role-playing sessions (Rober, Elliot, Buysse, Loots, & Corte, 2008), normalizing risky sexual behaviors in female adolescents (Weiss, Jampol, Lievano,Smith, & Wurster, 2008), and team leadership during trauma resuscitation (Xiao, Seagull, Mackenzie, & Klein, 2004), to name a few. Whenchoosing to utilize the grounded theory approach, the idea is to select a topic that has been minimally explored.
Steps in Grounded Theory ResearchIn grounded theory research, data are simultaneously collected, coded, and analyzed. This procedure differs from quantitative methods becauseduring the research process, data collection and analysis do not occur sequentially. Rather, in grounded theory, data analysis begins almostimmediately when data collection starts. Grounded theory can utilize a variety of data collection techniques, including interviews, observations,focus groups, historical records, videotapes, diaries, news reports, and any other form of data that is relevant to the research question (Leedy &Ormrod, 2010), although in-depth interviews are the most commonly used method.
One of the most widely used approaches to data analysis in grounded theory is the one suggested by Strauss and Corbin (1990). In thisapproach, data analysis begins by developing categories to classify the data. This process, called open coding, involves the researcher labelingand organizing the data into categories or themes and smaller subcategories that describe the phenomenon being investigated. In this step,initial coding is generally guided by some of the literature review, as well as by topic guides developed by the researcher that direct the codingof themes and categories, based upon the study's research questions. Glaser (1978) suggests three questions to be used in generating andidentifying open codes:
What is this data a study of?
What category does this incident indicate?
What is actually happening in the data?
The next step in data analysis is axial coding, which involves finding connections or relationships between the categories and subcategories(Smith & Davis, 2010). Strauss (1987) indicates that axial coding should involve the examination of antecedent conditions, interactions amongsubjects, strategies, tactics, and consequences. The idea here is to fit together all the pieces, similar to a jigsaw puzzle. Strauss and Corbin(1990) further suggest that axial coding focus on asking the questions Who, When, Where, Why, How, and With what consequences. As newdata are collected, the researcher will move constantly between data collection, open coding, and axial coding to refine the categories. Alsoduring this process, hypotheses are generated and continually tested, based on new data coming in. Data collection and analysis continue untilthe categories are completely saturated. Saturation occurs when no additional supporting or disconfirming data are being found to develop acategory. Thus, saturation occurs when we have learned everything that we can about a category.
The final step, selective coding, involves the researcher combining the categories and their interrelationships into theoretical constructs or a"story line that describes what happens in the phenomenon being studied" (Leedy & Ormrod, 2010, p. 143). In other words, the researcher isintegrating and refining the categories so that the categories can be related to the core categories, or categories that lie at the core of thetheory being generated. It is from this process that theories are generated.
To illustrate the process of grounded theory research, consider an investigation of the active or passive roles played by companions whoaccompany patients to their dental appointments. To examine how these companions affect the interactions between the patient and the dentalprovider, we could begin collecting data using field notes and audio recordings. Next we would compare the interactions among companions,patients, and dentists by assessing their similarities and differences. We would then identify codes from the initial data collected, and developcategories to organize the codes. The following step would be to develop hypotheses about the patterns we observed. Next, we would continueto collect and analyze data for an extended period to test those hypotheses and develop more patterns. We would continue collecting data andrefining hypotheses until we were able to account for and explain all examples (the saturation point). We would then generate a theory fromthe data regarding the roles that companions play when attending dental appointments with patients.
Pros and Cons of Grounded Theory StudiesGrounded theory gives the researcher significant flexibility with respect to the types of data collection methods and the ability to readjust theinvestigation as new data are being collected (Houser, 2009). Grounded theory also provides a thorough analysis of the data, which can lead tofairly solid theories or hypotheses about a particular phenomenon. Additionally, through systematic data collection and analysis procedures, theresearcher is able to explore the complexity of the problem, which often produces richer and more informative results.
Despite the advantages of being able to develop theories from data collected, there are some disadvantages to grounded theory. Probably thebiggest disadvantage involves the difficulty in managing large amounts of data. Since there are no standard guidelines regarding how to identifycategories, the novice researcher may have difficulty developing categories and analyzing the data appropriately. Identifying when a category hasbecome saturated and when a theory has been completely formed can also be difficult and requires some experience. Additionally, groundedtheory research can be very time consuming and tedious.
Case Studies (Qualitative or Descriptive Design)At the 1996 meeting of the American Psychological Association (APA), James Pennebaker— chair of psychology at the University of Texas atAustin—delivered an invited address, describing his research on the benefits of therapeutic writing. Rather than follow the expected route ofshowing graphs and statistical tests to support his arguments, Pennebaker told a story. In the mid-1980s, when Pennebaker's lab was starting tostudy the effects of structured writing on physical and psychological health, one study participant was an American soldier who had served inthe Vietnam War. Like many others, this soldier had had difficulty adjusting to what had happened during the war and consequent troublereintegrating into "normal" civilian life. In Pennebaker's study, he was asked to simply spend 15 minutes per day, over the course of a week,writing about a traumatic experience—in this case, his tour of duty in Vietnam. At the end of this week, as you might expect, this veteran feltawful; these were unpleasant memories that he had not relived in over a decade. But during the next few weeks, amazing things started tohappen. He slept better, he made fewer visits to his doctor, and he even reconnected with his wife after a long separation.
Pennebaker's presentation is an example of a case study that provides a detailed, in-depth analysis of one person over a period of time.Although this case study was collected as part of a larger quantitative experiment, case studies are usually conducted in a therapeutic settingand involve a series of interviews. An interviewer will typically study the subject in detail, recording everything from direct quotes andobservations to his or her own interpretations. We encountered this technique briefly in Chapter 2 (Section 2.1, Overview of Research Designs),in discussing Oliver Sacks's case studies of individuals learning to live with neurological impairments.
Pros and Cons of Case StudiesIn psychology, case studies are a form of qualitative research; thus, they represent the lowest point on our continuum of control. Because theyinvolve one person at a time, without a control group, case studies are often unsystematic. That is, the participants are chosen because they tella compelling story or because they represent an unusual set of circumstances rather than being selected randomly. Studying these individualsallows for a great deal of exploration, which can often inspire future research. However, it is nearly impossible to generalize from one case studyto the larger population. In addition, because the case study includes both direct observation and the researcher's interpretation, there is a riskthat a researcher's biases might influence the interpretations. For example, Pennebaker's investment in demonstrating that writing has healthbenefits could have led to more positive interpretations of the Vietnam veteran's outcomes. However, in this particular case study, Pennebaker'shypothesis about the benefits of writing was supported because his findings mirror those seen in hundreds of controlled experimental studiesthat involved thousands of people. This body of work allows us to feel confident about the conclusions from the single case.
Case studies have two distinct advantages over other forms of research. First is the simple fact that anecdotes are persuasive. DespitePennebaker's nontraditional approach to a scientific talk, the audience came away utterly convinced of the benefits of therapeutic writing. And,despite the fact that Oliver Sacks studied one neurological patient at a time, the stories in his books shed very convincing light on the ability ofhumans to adapt to their circumstances and have a wide appeal to the lay reader. Second, case studies provide a useful way to study rarepopulations and individuals with rare conditions. For example, from a scientific point of view, the ideal might be to gather a random sample ofindividuals living with severe memory impairment due to alcohol abuse and conduct some sort of controlled study in a laboratory environment.This approach could allow us to make causal statements about the results, as we will discuss in Chapter 5 (Section 5.4, Experimental Designs).However, from a practical point of view, this study would be nearly impossible to conduct, making case studies such as Sacks's interviews withWilliam Thompson the best strategy for understanding this condition in depth.
Examples of Case StudiesThroughout the history of psychology, case studies have been used to address a number of important questions and to provide a starting pointfor controlled quantitative studies. For example, in developing his theories of cognitive development, the Swiss psychologist Jean Piaget studiedthe way that his own children developed and changed their thinking styles. Piaget proposed that children would progress through a series offour stages in the way that they approached the world—sensorimotor, preoperational, concrete operational, and formal operational—with eachstage involving more sophisticated cognitive skills than the previous stage. By observing his own children, Piaget noticed preliminary support forthis theory and later was able to conduct more controlled research with larger populations.
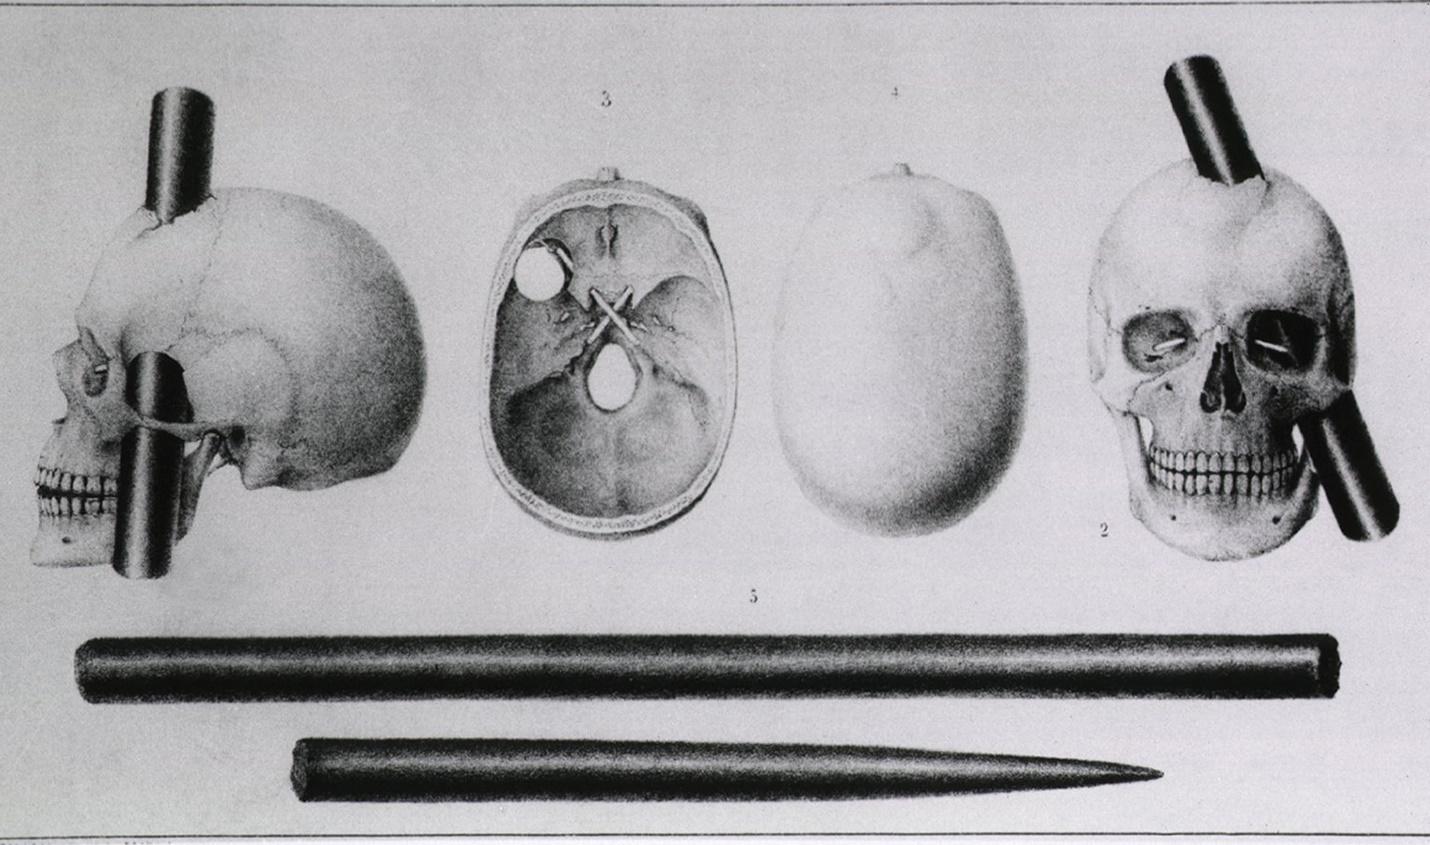
Perhaps one of the most famous case studies in psychology is the story of Phineas Gage, a 19th-century railroad worker who suffered severebrain damage. In September of 1848, Gage was working with a team to blast large sections of rock to make way for new rail lines. After a largehole was drilled into a section of rock, Gage's job was to pack the hole with gunpowder, sand, and a fuse and then tamp it down with a longcylindrical iron rod (known as a "tamping rod"). On this particular occasion, it seems Gage forgot to pack in the sand. So when the iron rodstruck gunpowder, the powder exploded, sending the 3-foot long iron rod through his face, behind his left eye, and out the top of his head.Against all odds, Gage survived this incident with relatively few physical side effects. However, everyone around him noticed that his personalityhad changed—Gage became more impulsive, violent, and argumentative. Gage's physician, John Harlow, reported the details of this case in an1868 article. The following passage is a great example of the rich detail that is often characteristic of case studies:
Courtesy Everett Collection
Various views show an iron rodembedded in Phineas Gage's (1823–1860)skull.
He is fitful, irreverent, indulging at times in the grossest profanity (which was not previously hiscustom), manifesting but little deference for his fellows, impatient of restraint or advice when itconflicts with his desires. A child in his intellectual capacity and manifestations, he has the animalpassions of a strong man. Previous to his injury, although untrained in the schools, he possesseda well-balanced mind, and was looked upon by those who knew him as a shrewd, smartbusinessman, very energetic and persistent in executing all his plans of operation. In this regardhis mind was radically changed, so decidedly that his friends and acquaintances said he was "nolonger Gage." (Harlow, 1868, pp. 339–342)
Gage's transformation ultimately inspired a large body of work in psychology and neuroscience thatattempts to understand the connections between brain areas and personality. The area of his braindestroyed by the tamping rod is known as the frontal lobe, now understood to play a critical role inimpulse control, planning, and other high-level thought processes. Gage's story is a perfect illustration ofthe pros and cons of case studies. On the one hand, it is difficult to determine exactly how much thebrain injury affected his behavior because he is only one person. On the other hand, Gage's tragedyinspired researchers to think about the connections among mind, brain, and personality. As a result, we now have a vast—and still growing—understanding of the brain. This illustrates a key point about case studies: Although individual cases provide limited knowledge about people ingeneral, they often lead researchers to conduct additional work that does lead to generalizable knowledge.
Qualitative Versus Quantitative ApproachesCase studies tend to be qualitative more often than not. The goal of this method is to study a particular case in depth as a way to learn moreabout a rare phenomenon. In both Pennebaker's study of the Vietnam veteran and Harlow's study of Phineas Gage, the researcher approachedthe interview process as a way to gather information and learn from the bottom up about the interviewee's experience. However, it is certainlypossible for a case study to represent quantitative research. This is often the case when researchers conduct a series of case studies, learningfrom the first one of the initial few and then developing hypotheses to test on future cases. For example, a researcher could use the case ofPhineas Gage as a starting point for hypotheses about frontal lobe injury, perhaps predicting that other cases would show similar changes inpersonality. Another way in which case studies can add a quantitative element is for researchers to conduct analyses within a single subject. Forexample, a researcher could study a patient with brain damage for several years following an injury, tracking the association betweendeterioration of brain regions with changes in personality and emotional responses. At the end of the day, though, these examples would stillsuffer from the primary downside of case studies: Because they study a single individual, it is difficult to generalize their findings.
Research: Thinking Critically Acupuncture of Benefit to Those with Unexplained SymptomsBy the Peninsula College of Medicine and Dentistry, Exeter, UK
Attending frequently with medically unexplained symptoms is distressing for both patient and doctor. Inthese settings, effective treatment or management options are limited: One in five patients hassymptoms that remain unexplained by conventional medicine. Studies have shown that the cost to theNational Health Service (NHS, United Kingdom) of managing the treatment of a patient with medicallyunexplained symptoms can be twice that of a patient with a diagnosis.
A research team from the Institute of Health Services Research, Peninsula Medical School, University ofExeter, has carried out a randomised control trial and a linked interview study regarding 80 such patientsfrom GP (General Practitioner) practices across London to investigate their experiences of having five-element acupuncture added to their usual care. This is the first trial of traditional acupuncture forpeople with unexplained symptoms.
The results of the research are published in the British Journal of General Practice. They reveal thatacupuncture had a significant and sustained benefit for these patients and, consequently, acupuncturecould be safely added to the therapies used by practitioners when treating frequently attending patientswith medically unexplained symptoms.
The patient group was made up of 80 adults, 80% female, with an average age of 50 years and from avariety of ethnic backgrounds who had consulted their GP at least eight times in the past year. Nearly60% reported musculoskeletal health problems, of which almost two thirds had been present for a year.
In the 3 months before taking part in the study, the 80 patients had accounted for the following NHSexperiences: 21 patient in-days; 106 outpatient clinic visits; 52 hospital clinic visits (for treatments suchas physiotherapy, chiropody, and counselling); 44 hospital visits for investigations (including 10 magneticresonance imaging [MRI]scans); and 75 visits to non-NHS practitioners such as opticians, dentists, andcomplementary therapists.
The patients were randomly divided into an acupuncture group and a control group. Eight acupuncturistsadministered individual five-element acupuncture to the acupuncture group immediately, up to 12sessions over 26 weeks. The same numbers of treatments were made available to the control groupafter 26 weeks.
At 26 weeks, the patients were asked to complete a number of questionnaires including theindividualized health status questionnaire "Measure Yourself Medical Outcome Profile."
The acupuncture group registered a significantly improved overall score when compared with the controlgroup. They also recorded improved well-being but did not show any change in GP and other clinicalvisits and the number of medications they were taking. Between 26 and 52 weeks, the acupuncturegroup maintained their improvement and the control group, now receiving their acupuncturetreatments, showed a "catch-up" improvement.
The associated qualitative study, which focused on the patients' experiences, supported the quantitativework. This element identified that the participating patients had a variety of long-standing symptomsand disability, including chronic pain, fatigue, and emotional problems, which affected their ability towork, socialize, and carry out everyday tasks. A lack of a convincing diagnosis to explain their symptomsled to frustration, worry, and low mood.
Participating patients reported that their acupuncture consultations became increasingly valuable. Theyappreciated the amount of time they had with each acupuncturist and the interactive and holistic natureof the sessions—there was a sense that the practitioners were listening to their concerns and, viatherapy, doing something positive about them.
As a result, many patients were encouraged to take an active role in their treatment, resulting incognitive and behavioural lifestyle changes, such as a new self-awareness about what caused stress intheir lives, and a subsequent ability to deal with stress more effectively, and taking their own initiativesbased on advice from the acupuncturists about diet, exercise, relaxation, and social activities.
Comments from participating patients included: "The energy is the main thing I have noticed. You know,yeah, it's marvellous! Where I was going out and cutting my grass, now I'm going out and cutting myneighbour's after because he's elderly"; "I had to reduce my medication. That's the big help actually,because medication was giving me more trouble . . . side effects"; and "It kind of boosts you, somehowor another."
Dr. Charlotte Paterson, who managed the randomised control trial and the longitudinal study of patients'experiences, commented: "Our research indicates that the addition of up to 12 five-element acupunctureconsultations to the usual care experienced by the patients in the trial was feasible and acceptable andresulted in improved overall well-being that was sustained for up to a year.
This is the first trial to investigate the effectiveness of acupuncture treatment to those with unexplainedsymptoms, and the next development will be to carry out a cost-effectiveness study with a longer follow-up period. While further studies are required, this particular study suggests that GPs may recommend aseries of five-element acupuncture consultations to patients with unexplained symptoms as a safe andpotentially effective intervention.
Paterson added: "Such intervention could not only result in potential resource savings for the NHS, butwould also improve the quality of life for a group of patients for whom traditional biomedicine has littlein the way of effective diagnosis and treatment."
Peninsula College of Medicine and Dentistry. (2011, May 27). Acupuncture and those with unexplained symptoms. From Paterson, C., Taylor, R.,Griffiths, P., Britten, N., Rugg, S., Bridges, J., McCallum, B., Kite, G. (2011). Acupuncture for 'frequent attenders' with medically unexplainedsymptoms: a randomised controlled trial (CACTUS Study). British Journal of General Practice, Volume 61, Number 587, June 2011 , pp. e295–e305(11) and Rugg, S. , Paterson, C., Britten, N., Bridges, J., Griffiths, P. (2011). Traditional acupuncture for people with medically unexplainedsymptoms: a longitudinal qualitative study of patients' experiences. British Journal of General Practice, Volume 61, Number 587, June 2011 , pp.e306–e315(10).
Think about it:
In this study, researchers interviewed acupuncture patients using open-ended questions and recordedtheir verbal responses, which is a common qualitative research technique. What advantages does thisapproach have over administering a quantitative questionnaire with multiple-choice items?
What are some advantages of adding a qualitative element to a controlled medical trial like this?
What would be some disadvantages of relying exclusively on this approach?
Moving slightly further along the continuum of control, we come to archival research, which involves drawing conclusions by analyzing existingsources of data, including both public and private records. Sociologist David Phillips (1997) hypothesized that media coverage of suicides wouldlead to "copycat" suicides. He tested this hypothesis by gathering archival data from two sources: front-page newspaper articles devoted tohigh-profile suicides and the number of fatalities in the 11-day period following coverage of the suicide. By examining these patterns of data,Phillips found support for his hypothesis. Specifically, fatalities appeared to peak 3 days after coverage of a suicide, and increased publicity wasassociated with a greater peak in fatalities.
Pros and Cons of Archival ResearchIt is difficult to imagine a better way to test Phillips's hypothesis about copycat suicides. You could never randomly assign people to learn aboutsuicides and then wait to see whether they killed themselves. Nor could you interview people right before they committed suicide to determinewhether they were being inspired by media coverage. Archival research provides a way to test the hypothesis by examining existing data andthereby avoids most of the ethical and practical problems of other research designs. Related to this point, archival research also neatly sidestepsissues of participant reactivity, or the tendency of people to behave differently when they are aware of being observed. Any time you conductresearch in a laboratory, participants are aware that they are in a research study and may not behave in a completely natural manner. Incontrast, archival data involve making use of records of people's natural (unstudied) behaviors. The subjects of Phillips's study of copycatsuicides were individuals who decided to kill themselves and who had no awareness that they would be part of a research study.
Archival research is also an excellent strategy for examining trends and changes over time. For example, much of the evidence for globalwarming comes from observing upward trends in recorded temperatures around the globe. To gather this evidence, researchers dig into existingarchives of weather patterns and conduct statistical tests on the changes over time. Psychologists and other social scientists also make use ofthis approach to examine population-level changes in everything from suicide rates to voting patterns over time. These comparisons cansometimes involve a blend of archival and current data. For example, a great deal of social psychology research has been dedicated tounderstanding people's stereotypes about other groups. In a classic series of studies known as the "Princeton Trilogy," researchers documentedthe stereotypes held by Princeton students over several decades (1933 to 1969). Social psychologist Stephanie Madon and her colleagues (2001)collected a new round of data but also conducted a new analysis of this archival data. These new analyses suggested that, over time, peoplehave become more willing to use stereotypes about other groups, even as stereotypes themselves have become less negative.
One final advantage of archival research is that once you manage to gain access to the relevant archives, it requires relatively few resources. Thetypical laboratory experiment involves one participant at a time, sometimes requiring the dedicated attention of more than one researchassistant over a period of an hour or more. But once you have assembled your data from the archives, it is a relatively simple matter to conductstatistical analyses. In a 2001 article, the psychologists Shannon Stirman and James Pennebaker used a text-analysis computer program tocompare the language of poets who committed suicide (e.g., Sylvia Plath) with the language of similar poets who had not committed suicide(e.g., Denise Levertov). In total, these researchers examined 300 poems from 20 poets, half of whom had committed suicide. Consistent withÉmile Durkheim's theory of suicide as a form of "social disengagement," Stirman and Pennebaker (2001) found that suicidal poets used moreself-references and fewer references to other people in their poems. But here's the impressive part: Once they had assembled their archive ofpoems, it took only seconds for their computer program to analyze the language and generate a statistical profile of each poet's verbal output.
Overall, however, archival research is still relatively low on our continuum of control. As a researcher, you have to accept the archival data inwhatever form they exist, with no control over the way they were collected. For instance, in Stephanie Madon's (2001) reanalysis of the"Princeton Trilogy" data, she had to trust that the original researchers had collected the data in a reasonable and unbiased way. In addition,because archival data often represent natural behavior, it can be difficult to categorize and organize responses in a meaningful and quantitativeway. The upshot is that archival research often requires some creativity on the researcher's part—such as analyzing poetry using a text analysisprogram. In many cases, as we discuss next, the process of analyzing archives involves developing a coding strategy for extracting the mostrelevant information.
Content Analysis—Analyzing ArchivesIn most of our examples so far, the data have come in a straightforward, ready-to-analyze form. That is, it is relatively simple to count thenumber of suicides, track the average temperature, or compare responses to questionnaires about stereotyping over time. In other cases, thedata can come in a sloppy, disorganized mass of information. What do you do if you want to analyze literature, media images, or changes inrace relations on television? These types of data can yield incredibly useful information, provided you can develop a strategy for extracting it.
Mark Frank and Tom Gilovich—both psychologists at Cornell University—were interested in whether cultural associations with the color blackwould have an effect on behavior. In virtually all cultures, black is associated with evil—the bad guys wear black hats; we have a "black day"when things turn sour; and we are excluded from social groups by being blacklisted or blackballed. Frank and Gilovich (1988) wondered whether"a cue as subtle as the color of a person's clothing" (p. 74) would influence aggressive behavior. To test this hypothesis, they examinedaggressive behaviors in professional football and hockey games, comparing teams whose uniforms were black with teams who wore othercolors. Imagine for a moment that this was your research study. Professional sporting events contain a wealth of behaviors and events. Howwould you extract information on the relationship between uniform color and aggressive behavior?
Frank and Gilovich (1988) solved this problem by examining public records of penalty yards (football) and penalty minutes (hockey) becausethese represent instances of punishment for excessively aggressive behavior, as recognized by the referees. And, in both sports, the size of thepenalty increases according to the degree of aggression. These penalty records were obtained from the central offices of both leagues, coveringthe period from 1970 to 1986. Consistent with their hypothesis, teams with black uniforms were "uncommonly aggressive" (p. 76). Moststrikingly, two NHL hockey teams changed their uniforms to black during the period under study and showed a marked increase in penaltyminutes while sporting the new uniforms!
But even this analysis is relatively straightforward in that it involved data that were already in quantitative form (penalty yards and minutes). Inmany cases, the starting point is a messy collection of human behavior. In a pair of journal articles, psychologist Russell Weigel and hiscolleagues (1980; 1995) examined the portrayal of race relations on prime-time television. In order to do this, they had to make several criticaldecisions about what to analyze and how to quantify it. The process of systematically extracting and analyzing the contents of a collection ofinformation is known as content analysis. In essence, content analysis involves developing a plan to code and record specific behaviors andevents in a consistent way. We can break this down into a three-step process:
Step 1—Identify Relevant Archives 
iStockphoto/Thinkstock
A personal letter is an example of a data source that a researcher would need to obtain permission to use.
Before we develop our coding scheme, we have to start by finding the most appropriate source of data.Sometimes the choice is fairly obvious. If you want to compare temperature trends, the most relevantarchives will be weather records. If you want to track changes in stereotyping over time, the mostrelevant archive will comprise questionnaire data assessing people's attitudes. In other cases, thisdecision involves careful consideration of both your research question and practical concerns. Frank andGilovich decided to study penalties in professional sports because these data were both readily available(from the central league offices) and highly relevant to their hypothesis about aggression and uniformcolor.
Because these penalty records were publicly available, the researchers were able to access them easily.But if your research question involved sensitive or personal information—such as hospital records orpersonal correspondence—you would need to obtain permission from a responsible party. Let's say youwanted to analyze the love letters written by soldiers serving overseas and then try to predictrelationship stability. Because these letters would be personal, perhaps rather intimate, you would needpermission from each person involved before proceeding with the study. Or, say you wanted to analyzethe correlation between the length of a person's hospital stay and the number of visitors he or shereceives. This would most likely require permission from both hospital administrators, doctors, and thepatients themselves. However you manage to obtain access to private records, it is absolutely essentialto protect the privacy and anonymity of the people involved. This would mean, for example, usingpseudonyms and/or removing names and other identifiers from published excerpts of personal letters.
Step 2—Sample From the ArchivesIn Weigel's research on race relations, the most obvious choice of archives consisted of snippets of both television programming andcommercials. But this decision was only the first step of the process. Should they examine every second of every program ever aired ontelevision? Naturally not; instead, their approach was to take a smaller sample of television programming. We will discuss sampling in moredetail in Chapter 4 (Section 4.3, Sampling From the Population), but the basic process involves taking a smaller, representative collection of thebroader population in order to conserve resources. Weigel and colleagues (1980) decided to sample one week's worth of prime-timeprogramming from 1978, assembling videotapes of everything broadcast by the three major networks at the time (CBS, NBC, and ABC). Theynarrowed their sample by eliminating news, sports, and documentary programming because their hypotheses were centered on portrayals offictional characters of different races.
Step 3—Code and Analyze the ArchivesThe third and most involved step is to develop a system for coding and analyzing the archival data. Even a sample of one week's worth ofprime-time programming contains a near-infinite amount of information! In the race-relations studies, Weigel et al. elected to code four keyvariables: (1) the total human appearance time, or time during which people were on-screen; (2) the Black appearance time, in which Blackcharacters appeared on-screen; (3) the cross-racial appearance time, in which characters of two races were on-screen at the same time; and (4)the cross-racial interaction time, in which cross-racial characters interacted. In the original (1980) paper, these authors reported that Blackcharacters were shown only 9% of the time, and cross-racial interactions only 2% of the time. Fortunately, by the time of their 1995 follow-upstudy, the rate of Black appearances had doubled, and the rate of cross-racial interactions had more than tripled. However, there wasdiscouragingly little change in some of the qualitative dimensions that they measured, including the degree of emotional connection betweencharacters of different races.
This study also highlights the variety of options for coding complex behaviors. The four key ratings of "appearance time" consist of simplyrecording the amount of time that each person or group is on-screen. In addition, the researchers assessed several abstract qualities ofinteraction using judges' ratings. The degree of emotional connection, for instance, was measured by having judges rate the "extent to whichcross-racial interactions were characterized by conditions promoting mutual respect and understanding" (Weigel et al., 1980, p. 888). As you'llremember from Chapter 2 (Section 2.2, Reliability and Validity), any time you use judges' ratings, it is important to collect ratings from morethan one rater and to make sure they agree in their assessments.
Your goal as an archival researcher is to find a systematic way to record the variables most relevant to your hypothesis. As with any researchdesign, the key is to start with clear operational definitions that capture the variables of interest. This involves both deciding the mostappropriate variables and the best way to measure these variables. For example, if you analyze written communication, you might decide tocompare words, sentences, characters, or themes across a sample. A study of newspaper coverage might code the amount of space or numberof stories dedicated to a topic. Also, a study of television news might code the amount of airtime given to different points of view. The beststrategy in each case will be the one that best represents the variables of interest.
Qualitative Versus Quantitative ApproachesArchival research can represent either qualitative or quantitative research, depending on the researcher's approach to the archives. Most of ourexamples in this section represent the quantitative approach: Frank and Gilovich (1988) counted penalties to test their hypothesis aboutaggression; and Stirman and Pennebaker (2001) counted self-referential words in poetry to test their hypothesis about suicide. But the race-relations work by Weigel and colleagues (1980; 1995) represents a nice mix of qualitative and quantitative research. In their initial 1980 study,the primary goal was to document the portrayal of race relations on prime-time television (i.e., qualitative). But in the 1995 follow-up study, theprimary goal was to determine whether these portrayals had changed over a 15-year period. That is, they tested the hypothesis that racerelations were portrayed in a more positive light (i.e., quantitative). Another way in which archival research can be qualitative is to study open-ended narratives without attempting to impose structure upon them. This approach is commonly used to study free-flowing text such aspersonal correspondence or letters to the editor in a newspaper. A researcher approaching these from a qualitative perspective would attemptto learn from these narratives but without imposing structure via the use of content analyses.
Observational Research (Qualitative or Descriptive Design)Moving further along the continuum of control, we come to the descriptive design with the greatest amount of researcher control. Observational research involves studies that directly observe behavior and record these observations in an objective and systematic way. Inprevious psychology courses, you may have encountered the concept of attachment theory, which argues that an infant's bond with his or herprimary caregiver has implications for later social and emotional development. Mary Ainsworth, a Canadian developmental psychologist, andJohn Bowlby, a British psychologist and psychiatrist, articulated this theory in the early 1960s, arguing that children can form either "secure" ora variety of "insecure" attachments with their caregivers (Ainsworth & Bell, 1970; Bowlby, 1963).
In order to assess these classifications, Ainsworth and Bell (1970) developed an observational technique called the "strange situation." Motherswould arrive at their laboratory with their children for a series of structured interactions, including having the mother play with the infant, leavehim or her alone with a stranger, and then return to the room after a brief absence. The researchers were most interested in coding the ways inwhich the infant responded to the various episodes (eight in total). One group of infants, for example, showed curiosity when the mother leftbut then returned to playing with their toys, trusting that she would return. Another group showed immediate distress when the mother leftand clung to her nervously upon her return. Based on these and other behavioral observations, Ainsworth and colleagues classified these groupsof infants as "securely" and "insecurely" attached to their mothers, respectively.
Research: Making an Impact Harry HarlowIn the 1950s, U.S. psychologist Harry Harlow conducted a landmark series of studies with rhesusmonkeys on the mother–infant bond. While his research would be considered unethical bycontemporary standards, the results of his work revealed the importance of affection, attachment, andlove on healthy childhood development.
Prior to Harlow's findings, it was believed that infants attached to their mothers as a part of a drive tofulfill exclusively biological needs, in this case obtaining food and water and to avoid pain (Herman,2007; van der Horst & van der Veer, 2008). In an effort to clarify the reasons that infants so clearly needmaternal care, Harlow removed rhesus monkeys from their natural mothers several hours after birth,giving the young monkeys a choice between two surrogate "mothers." Both mothers were made of wire,but one was bare and one was covered in terry cloth. Although the wire mother provided food via anattached bottle, the monkeys preferred the softer, terry-cloth mother, even though the latter providedno food (Harlow & Zimmerman, 1958; Herman, 2007).
Further research with the terry-cloth mothers contributed to the understanding of healthy attachmentand childhood development (van der Horst & van der Veer, 2008). When the young monkeys were giventhe option to explore a room with their terry-cloth mothers and had the cloth mothers in the room withthem, they used the mothers as a safe base. Similarly, when exposed to novel stimuli such as a loudnoise, the monkeys would seek comfort from the cloth-covered surrogate (Harlow & Zimmerman, 1958).However, when the monkeys were left in the room without their cloth mothers, they reacted poorly—freezing up, crouching, crying, and screaming.
A control group of monkeys who were never exposed to either their real mothers or one of thesurrogates revealed stunted forms of attachment and affection. They were left incapable of forminglasting emotional attachments with other monkeys (Herman, 2007). Based on this research, Harlowdiscovered the importance of proper emotional attachment, stressing the importance of physical andemotional bonding between infants and mothers (Harlow & Zimmerman, 1958; Herman, 2007).
Harlow's influential research led to improved understanding of maternal bonding and child development(Herman, 2007). His research paved the way for improvements in infant and child care and in helpingchildren cope with separation from their mothers (Bretherton, 1992; Du Plessis, 2009). In addition,Harlow's work contributed to the improved treatment of children in orphanages, hospitals, day carecenters, and schools (Herman, 2007; van der Horst & van der Veer, 2008).
Pros and Cons of Observational ResearchObservational designs are well suited to a wide range of research questions, provided the questions can be addressed through directlyobservable behaviors and events; for example, if the researcher is able to observe parent–child interactions, nonverbal cues to emotion, or evencrowd behavior. However, if a researcher is interested in studying thought processes—such as how mothers interpret their interactions—thenobservation will not suffice. This harkens back to our discussion of behavioral measures in Chapter 2 (Section 2.2, Reliability and Validity): Inexchange for giving up access to internal processes, you gain access to unfiltered behavioral responses.
To capture these unfiltered behaviors, it is vital for the researcher to be as unobtrusive as possible. As we have already discussed, people have atendency to change their behavior when they are being observed. In the bullying study by Craig and Pepler (1997) discussed at the beginning ofthis chapter, the researchers used video cameras to record children's behavior unobtrusively; otherwise, the occurrence of bullying might havebeen artificially low. If you conduct an observational study in a laboratory setting, there is no way to hide the fact that people are beingobserved, but the use of one-way mirrors and video recordings can help people to become comfortable with the setting (versus having anexperimenter staring at them across the table). If you conduct an observational study out in the real world, there are even more possibilities forblending into the background, including using observers who are literally hidden. For example, let's say you hypothesize that people are morelikely to pick up garbage when the weather is nicer. Rather than station an observer with a clipboard by the trash can, you could place someoneout of sight, standing behind a tree or perhaps sitting on a park bench pretending to read a magazine. In both cases, people would be lessconscious of being observed and therefore more likely to behave naturally.
One extremely clever strategy for blending in comes from a study by the social psychologist Muzafer Sherif, involving observations ofcooperative and competitive behaviors among boys at a summer camp (Sherif et al., 1954). You can imagine that it was particularly important tomake observations in this context without the boys realizing they were part of a research study. Sherif took on the role of camp janitor, allowinghim to be a presence in nearly all of the camp activities. The boys never paid enough attention to the "janitor" to realize his omnipresence—orhis discreet note taking. The brilliance of this idea is that it takes advantage of the fact that people tend to blend into the background once webecome used to their presence.
Types of Observational ResearchThere are several variations on observational research, according to the amount of control that a researcher has over the data collectionprocess.
Structured ObservationStructured observation involves creating a standard situation in a controlled setting and then observing participants' responses to apredetermined set of events. The "strange situation" studies of attachment (discussed previously) are a good example of structured observation—mothers and infants are subjected to a series of eight structured episodes, and researchers systematically observe and record the infants'reactions. Even though these types of studies are conducted in a laboratory, they differ from experimental studies in an important way: Ratherthan systematically manipulate a variable to make comparisons, researchers present the same set of conditions to all participants.
Another example of structured observation comes from the research of John Gottman, a psychologist at the University of Washington. Fornearly three decades, Gottman and his colleagues have conducted research on the interaction styles of married couples. Couples who take partin this research are invited for a 3-hour session in a laboratory that closely resembles a living room. Gottman's goal is to make couples feelreasonably comfortable and natural in the setting, in order to get them talking as they might do at home. After allowing them to settle in,Gottman adds the structured element by asking the couple to discuss an "ongoing issue or problem" in their marriage. The researchers then sitback to watch the sparks fly, recording everything from verbal and nonverbal communication to measures of heart rate and blood pressure.Gottman has observed and tracked so many couples over the decades that he is able to predict, with remarkable accuracy, which couples willdivorce in the 18 months following the lab visit (Gottman & Levenson, 1992).
Naturalistic ObservationNaturalistic observation involves observing and systematically recording behavior out in the real world. This can be done in two broad ways—with or without intervention on the part of the researcher. Naturalistic studies that involve researcher intervention consist of manipulating someaspect of the environment and then observing responses. For example, you might leave a shopping cart just a few feet away from the cartreturn area and measure whether people move the cart. (Given the number of carts that are abandoned just inches away from their properdestination, someone must be doing this research all the time. . . .) In another example you may remember from Chapter 1 (in our discussion ofethical dilemmas in Section 1.7, Ethics in Research), Harari and associates (1995) used this approach to study whether people would help inemergency situations. In brief, these researchers staged what appeared to be an attempted rape in a public park and then observed whethergroups or individual males were more likely to rush to the victim's aid.

James D. Smith/Associated Press
Naturalistic studies involve observing and recording behavior in thereal world. One example might be noting what type of people givemoney to charities and under what conditions they donate.
The ABC network has developed a hit reality show that illustrates this type ofresearch. The show What Would You Do? sets up provocative settings in publicand videotapes people's reactions; full episodes are available online at http://abcnews.go.com/WhatWouldYouDo/. If you were an unwitting participant inone of these episodes, you might see a customer stealing tips from a restauranttable or a son berating his father for being gay or a man proposing to hisgirlfriend who minutes earlier had been kissing another man at the bar. Of course,these observation "studies" are more interested in shock value than datacollection (or IRB approval; see Section 1.6), but the overall approach can be auseful strategy to assess people's reactions to various situations. In fact, some ofthe scenarios on the show are based on classic studies in social psychology, suchas the well-documented phenomenon that people are reluctant to takeresponsibility for helping in emergencies.
Alternatively, naturalistic studies can involve simply recording ongoing behaviorwithout any attempt by the researchers to intervene or influence the situation. Inthese cases, the goal is to observe and record behavior in a completely naturalsetting. For example, you might station yourself at a liquor store and observe the numbers of men and women who buy beer versus wine. Or,you might observe the numbers of people who give money to the Salvation Army bell ringers during the holiday season. You can use thisapproach to make comparisons of different conditions, provided the differences occur naturally. That is, you could observe whether peopledonate more money to the Salvation Army on sunny or snowy days or compare donation rates when the bell ringers are of a different gender orrace. Do people give more money when the bell ringer is an attractive female? Or do they give more to someone who looks needier? These areall research questions that could be addressed using a well-designed naturalistic observation study.
Participant ObservationParticipant observation involves having the researcher(s) conduct observations while engaging in the same activities as the participants. The goalis to interact with these participants in order to gain better access and insight into their behaviors. In one famous example, the psychologistDavid Rosenhan (1973) was interested in the experience of people hospitalized for mental illness. To study these experiences, he had eightperfectly sane people gain admission to different mental hospitals. These fake patients were instructed to give accurate life histories to a doctorexcept for lying about one diagnostic symptom; they all supposedly heard voices occasionally, a symptom of schizophrenia.
Once admitted, these "patients" behaved in a normal and cooperative manner, with instructions to convince hospital staff that they werehealthy enough to be released. In the meantime, they observed life in the hospital and took notes on their experiences—a behavior that manydoctors interpreted as "paranoid note taking." The main finding of this study was that hospital staff tended to see all patient behaviors throughthe lens of their initial diagnoses. Despite immediately acting "normally," these fake patients were hospitalized an average of 19 days (with arange from 7 to 52!) before being released. And all but one was given a diagnosis of "schizophrenia in remission" upon release. The otherstriking finding was that treatment was generally depersonalized, with staff spending little time with individual patients.
In another great example of participant observation, Festinger, Riecken, and Schachter (1956) decided to join a doomsday cult to test their newtheory of cognitive dissonance. Briefly, this theory argues that people are motivated to maintain a sense of consistency among their variousthoughts and behaviors. So, for example, if you find yourself smoking a cigarette despite being aware of the health risks, you might rationalizeyour smoking by convincing yourself that lung cancer risk is really just genetic. In this case, Festinger and colleagues stumbled upon the case ofa woman named Mrs. Keach, who was predicting the end of the world, via alien invasion, at 11 p.m. on a specific date 6 months in the future.What would happen, they wondered, when this prophecy failed to come true?
To answer this question, the researchers pretended to be new converts and joined the cult, living among the members and observing them asthey made their preparations for doomsday. Sure enough, the day came, and 11 p.m. came and went without the world ending. Mrs. Keach firstdeclared that she had forgotten to account for the time zone difference, but as sunrise started to approach, the group members becamerestless. Finally, after a short absence to communicate with the aliens, Mrs. Keach returned with some good news: The aliens were so impressedwith the devotion of the group that they decided to postpone their invasion! The group members rejoiced, rallying around this brilliant piece ofrationalizing, and quickly began a new campaign to recruit new members.
As you can see from these examples, participant observation can provide access to amazing and one-of-a-kind data, including insights into groupmembers' thoughts and feelings. This form of investigation also provides access to groups that might be reluctant to allow in outside observers.However, this approach has two clear disadvantages over other types of observation. The first problem is ethical; data are collected fromindividuals who do not have the opportunity to give informed consent. Indeed, the whole point of the technique is to observe people withouttheir knowledge. In order for an IRB to approve this kind of study, there has to be an extremely compelling reason to ignore informed consent,as well as extremely rigorous measures to protect identities. The second problem is methodological; there is ample opportunity for theobjectivity of observations to be compromised by the close contact between researcher and participant. Because the researcher is a part of thegroup, he or she can change the dynamics in subtle ways, possibly leading the group to confirm his or her hypothesis. In addition, the group canshape the researcher's interpretations in subtle ways, leading him or her to miss important details.
Steps in Observational ResearchOne of the major strengths of observational research is that it has a high degree of ecological validity; that is, the research can be conducted insituations that closely resemble the real world. Think of our examples so far—married couples observed in a living room– like laboratory;doomsday cults observed from within; bullying behaviors on the school playground seen by hidden observers. In every case, people's behaviorsare observed in the natural environment or something very close to it. But this ecological validity comes at a price; the real world is a jumble ofinformation—some relevant, some not so much. The challenge for the researcher, then, is to decide on a system for sorting out the signal fromthe noise that provides the best test of the hypothesis. In this section, we discuss a three-step process for conducting observational research.The key thing you should note right away is that most of this process involves making decisions ahead of time so that the process of datacollection is smooth, simple, and systematic.
Step 1—Develop a HypothesisFor research to be systematic, it is important to impose structure by having a clear research question and hypothesis. We have coveredhypotheses in detail in other chapters, but the main points bear repeating: Your hypothesis must be testable and falsifiable, meaning that itmust be framed in such a way that it can be addressed through empirical data and might be disconfirmed by these data. In our exampleinvolving Salvation Army donations, we predicted that people might donate more money to an attractive bell ringer. This could easily be testedempirically and could just as easily be disconfirmed by the right set of data—say, if attractive bell ringers brought in the fewest donations.
This particular example also highlights an additional important feature of observational hypotheses; namely, they have to be observable.Because observational studies are based on observations of behaviors, our hypotheses have to be centered on behavioral measures. That is, wecan safely make predictions about the amount of money people will donate because this can be directly observed. But we are unable to makepredictions in this context about the reasons for donations. There would be no way to observe, say, that people donate more to attractive bellringers because they were trying to impress them. In sum, one limitation of observing behavior in the real world is that we are unable to delveinto the cognitive and motivational reasons behind the behaviors, as we would in phenomenological research, for example.
Step 2—Decide What and How to Sample 
Steve Mason/Photodisc/Thinkstock
The dinner scene at a busy restaurantoffers a wide variety of behaviors tosample.
Once you have developed a hypothesis that is testable, falsifiable, and observable, the next step is todecide what kind of information to gather from the environment to test this hypothesis. The simple factis that the world is too complex to sample everything in it. Imagine that you wanted to observe thedinner rush at a restaurant. There is a nearly infinite list of events to observe: What time does therestaurant get crowded? How many times do people send their food back to the kitchen? What are themost popular dishes? How often do people get into arguments with the waitstaff? To simplify theprocess of observing behavior, you will need to take samples, which are small snippets of theenvironment that are relevant to your hypothesis. That is, rather than observing "dinner at therestaurant," the goal is to narrow your focus to something like "the number of people waiting in line fora table at 6 p.m. versus 9 p.m."
The choice of what and how to sample will ultimately depend on the best fit for your hypothesis. In thecontext of observational research, there are three strategies for sampling behaviors and events. The firststrategy, time sampling, involves comparing behaviors during different time intervals. For example, totest the hypothesis that football teams make more mistakes when they start to get tired, the researchercould count the number of penalties in the first 5 and the last 5 minutes of the game. This data wouldallow one to compare mistakes at one time interval with mistakes at another time interval. In the caseof Festinger's study of a doomsday cult, time sampling was used to compare how the group membersbehaved before and after their prophecy failed to come true.
The second strategy, individual sampling, involves collecting data by observing one person at a time inorder to test hypotheses about individual behaviors. Many of the examples we have already discussed involve individual sampling. For instance,Ainsworth and colleagues tested their hypotheses about attachment behaviors by observing individual infants, while Gottman tests hishypotheses about romantic relationships by observing one married couple at a time. These types of data allow us to examine behavior at theindividual level and test hypotheses about the kinds of things people do—from the way they argue with their spouses to whether they wearteam colors to a football game.
The third strategy, event sampling, involves observing and recording behaviors that occur throughout an event. For example, you could track thenumber of fights that break out during an event such as a football game or the number of times people leave the restaurant without paying thecheck. This strategy allows for testing hypotheses about the types of behaviors that occur in a particular environment or setting. For example,you might compare the number of fights that break out in a professional football versus a professional hockey game. Or, the next time you hosta party, you could count the number of wine bottles versus beer bottles that end up in your recycling bin. The distinguishing feature of thisstrategy is that you focus on the occurrence of behaviors more than on the individuals performing these behaviors.
Step 3—Record and Code BehaviorNow that you have formulated a hypothesis and decided on the best sampling strategy, there is one final and critical step to take before youbegin data collection. Namely, you have to develop good operational definitions of your variables by translating the underlying concepts intomeasurable variables. Gottman's research turns the concept of marital interactions into a range of measurable variables like the number ofdismissive comments and passive-aggressive sighing—all things that can be observed and counted objectively. Rosenhan's study involving fakeschizophrenic patients turned the concept of how staff treat patients into measurable variables such as the amount of time staff members spentwith each patient—again, something very straightforward to observe.
It is vital to decide up front what kinds and categories of behavior you will be observing and recording. In the previous section, we narroweddown our observation of dinner at the restaurant to the number of people in line at 6 p.m. versus the number of people in line at 9 p.m. Buthow can we be sure we get an accurate count? What if two people are waiting by the door while the other two members of the group aresitting at the bar? Are those at the bar waiting for a table or simply having drinks? One possibility might be to count the number of individualswho walk through the door in different time periods, although our count could be inflated by those who give up on waiting or who only enterto ask for directions to another place.
In short, observing behavior in the real world can be messy. The best way to deal with this mess is to develop a clear, consistent categorizationscheme and stick with it. That is, in testing your hypothesis about the most crowded time at the restaurant, you would choose one method ofcounting people and use it for the duration of the study. In part, this choice is a judgment call, but your judgment should be informed by threecriteria. First, you should consider practical issues, such as whether your categories can be directly observed. You can observe the number ofpeople who leave the restaurant, but you cannot observe whether they became impatient. Second, you should consider theoretical issues, suchas how well your categories represent the underlying theory. Why did you decide to study the most crowded time at the restaurant? Perhapsthis particular restaurant is in a new, up-and-coming neighborhood and you expect the restaurant to get crowded over the course of theevening. It would also lead you to include people sitting both at tables and at the bar—because this crowd may come to the restaurant with thesole intention of staying at the bar. Third, you should consider previous research when choosing your categories. Have other researchers studieddining patterns in restaurants? What kinds of behaviors did they observe? If these categories make sense for your project, feel free to reusethem.
Last, but not least, you should take a step back and evaluate both the validity and the reliability of your coding system. (See Section 2.2 for areview of these terms.) Validity in this case means making sure the categories we observe do a good job of capturing the underlying variables inour hypothesis (i.e., construct validity; see Section 2.2). For example, in Gottman's studies of marital interactions, some of the most importantvariables are the emotions expressed by both partners. One way to observe emotions would be to count the number of times a person smiles.However, we would have to think carefully about the validity of this measure because smiling could indicate either genuine happiness,superficiality, condescension, or even awkward embarrassment. As a general rule, the better our operational definitions, the more valid ourmeasures will be (Chapter 2).
Reliability in the context of observation means making sure data are collected in a consistent way. If research involves more than one observerusing the same system, their data should look roughly the same (i.e., have interrater reliability). This is accomplished in part by making the tasksimple and straightforward—for example, by having trained assistants use a checklist to record behaviors rather than depending on open-endednotes. The other key to improving reliability is through careful training of the observers, giving them detailed instructions and ampleopportunities to practice the rating system.
Observational Research ExamplesTo give you a sense of how all of this comes together, let's walk through a pair of examples, from forming the research question to collectingthe data.
Example 1—Theater Restroom UsageFirst, imagine for the sake of this example that you are interested in whether people are more likely to use the restroom before or afterwatching a movie. This research question could provide valuable information for theater owners in planning employee schedules (i.e., when arebathrooms most likely to need cleaning). Thus, by studying patterns of human behavior, we could gain useful applied knowledge.
The first step is to develop a specific, testable, and observable hypothesis. In this case, we might predict that people are more likely to use therestroom after the movie, as a result of consuming those 64-ounce sodas during the movie. And, just for fun, let's also compare the restroomusage of men and women. Perhaps men are more likely to wait until after the movie, whereas women are as likely to go before as after. Thispattern of data might look something like the percentages in Table 3.1. That is, men make 80% of their restroom visits after the movie and 20%before the movie, while women make about 50% of their restroom visits at each time.
| Table 3.1: Hypothesized data from observation exercise | ||
| Men | Women | |
| Before movie | 20% | 50% |
| After movie | 80% | 50% |
| Total | 100% | 100% |
The next step is to decide on the best sampling strategy to test this hypothesis. Of the three sampling strategies we discussed—individual,event, and time—which one seems most relevant here? The best option would probably be time sampling because our hypothesis involvescomparing the number of restroom visitors in two time periods (before versus after the movie). So, in this case, we would need to define a timeinterval for collecting data. One option would be to limit our observations to the 10 minutes before the previews begin and the 10 minutesafter the credits end. The potential problem here, of course, is that some people might use either the previews or the end credits as a chanceto use the restroom. Another complication arises in trying to determine which movie people are watching; in a giant multiplex theater, moviesstart just as others are finishing. One possible solution, then, would be to narrow our sample to movie theaters that show only one movie at atime and to define the sampling times based on the actual movie start and end times.
Once we decide on a sampling strategy, the next step is to decide on the types of behaviors we want to record. This particular hypothesis posesa challenge because it deals with a rather private behavior. In order to faithfully record people "using the restroom," we would need to stationresearchers in both men's and women's restrooms to verify that people actually, well, "use" the restroom while they are in there, as opposed toprimping or putting on makeup. However, this strategy comes with the potential downside that your presence (standing in the corner of therestroom) will affect people's behavior. Another, less intrusive option would be to stand outside the restroom and simply count "the number ofpeople who enter." The downside here, of course, is that we don't technically know why people are going into the restroom. But sometimesresearch involves making these sorts of compromises—in this case, we chose to sacrifice a bit of precision in favor of a less intrusivemeasurement.
So, in sum, we started with the hypothesis that men are more likely to use the restroom after a movie, while women use the restroom equallybefore and after. We then decided that the best sampling strategy would be to identify a movie theater showing only one movie and to samplefrom the 10-minute periods before and after the actual movie's running time. Finally, we decided that the best strategy for recording behaviorwould be to station observers outside the restrooms and count the number of people who enter. Now, let's say we conduct these observationsevery evening for one week and collect the data in Table 3.2.
| Table 3.2: Findings from observation exercise | ||
| Men | Women | |
| Before movie | 75 (25%) | 300 (60%) |
| After movie | 225 (75%) | 200 (40%) |
| Total | 300 (100%) | 500 (100%) |
You can see that more women (n = 500) than men (n = 300) attended the movie theater during our week of sampling. But the real test of ourhypothesis comes from examining the percentages within gender groups. That is, of the 300 men who went into the restroom, what percentageof them did so before the movie and what percentage of them did so after the movie? In this dataset, women used the restroom with relativelyequal frequency before (60%) and after (40%) the movie. Men, in contrast, were three times as likely to use the restroom after (75%) thanbefore (25%) the movie. In other words, our hypothesis appears to be confirmed by examining these percentages.
Example 2—Cell Phone Usage While DrivingImagine for this example that you are interested in patterns of cell-phone usage among drivers. Several recent studies have reported that driversusing cell phones are as impaired as drunk drivers, making this an important public safety hazard. Thus, if we could understand the contexts inwhich people are most likely to use cell phones, this would provide valuable information for developing guidelines for safe and legal use ofthese devices. So in this study we might count the number of drivers using cell phones in two settings: in rush-hour traffic and moving on thefreeway.
The first step is to develop a specific, testable, and observable hypothesis. In this case, we might predict that people are more likely to use cellphones when they are bored in the car. So we hypothesize that we will see more drivers using cell phones while stuck in rush-hour traffic thanwhile moving on the freeway.
The next step is to decide on the best sampling strategy to test this hypothesis. Of the three sampling strategies we discussed—individual,event, and time—which one seems most relevant here? The best option would probably be individual sampling because we are interested inthe cell phone usage of individual drivers. That is, for each individual car we see during the observation period, we want to know whether thedriver is using a cell phone. One strategy for collecting these observations would be to station observers along a fast-moving stretch of freeway,as well as along a stretch of road that is typically clogged during rush hour. These observers would keep a record of each passing car, notingwhether the driver was on the phone.
Once we decide on a sampling strategy, our next step is to decide on the types of behaviors we want to record. One challenge in this study is indeciding how broadly to define the category of cell-phone usage. Would we include both talking and text messaging? Given our interest indistraction and public safety, we probably would want to include text messaging. In response to tragic accidents, several states have recentlybanned text messaging while driving. Because we will be observing moving vehicles, the most reliable approach might be to simply notewhether each driver had a cell phone in his or her hand. As with our restroom study, we are sacrificing a little bit of precision (i.e., we don'tknow what the cell phone is being used for) to capture behaviors that are easier to record.
So, in sum, we started with the hypothesis that drivers would be more likely to use cell phones when stuck in traffic. We then decided that thebest sampling strategy would be to station observers along two stretches of road and that they should note whether drivers were using cellphones. Finally, we decided that the best compromise for observing cell-phone usage would be to note whether each driver was holding a cellphone. Now, let's say we conducted these observations over a 24-hour period and collected the data shown in Table 3.3.
| Table 3.3: Findings from observation exercise #2 | ||
| Rush Hour | Moving | |
| Cell phone | 30 (30%) | 200 (67%) |
| No cell phone | 70 (70%) | 100 (33%) |
| Total | 100 | 300 |
You can see that more cars passed by during the non–rush-hour stretch (n = 300) than during the rush-hour stretch (n = 100). But the real testof our hypothesis comes from examining the percentages within each stretch. That is, of the 100 people observed during rush hour and the 300observed not during rush hour, what percentage were using cell phones? In this dataset, 30% of those in rush hour were using cell phones,compared with 67% of those not during rush hour. In other words, our hypothesis was not confirmed by the data. Drivers in rush hour wereless than half as likely to be using cell phones. The next step in our research program would be to speculate on the reasons why the datacontradicted our hypothesis.
Qualitative Versus Quantitative ApproachesThe general method of observation lends itself equally well to both qualitative and quantitative approaches, although some types of observationfit one approach better than the other. For example, structured observation tends to be focused on testing hypotheses and quantifyingresponses. In Mary Ainsworth's "strange situation" research (described earlier), the primary goal was to expose children to a predeterminedscript of events and to test hypotheses about how children with secure and insecure attachments would respond to these events. In contrast,naturalistic observation—and, to a greater extent, participant observation—tends to focus on learning from events as they unfold naturally. InLeon Festinger's "doomsday cult" study, the researchers joined the group in order to observe the ways members reacted when their prophecyfailed to come true.
Research: Thinking Critically The Irritable HeartBy K. Kris Hirst
Using open-source data from a federal project digitizing medical records of veterans of the AmericanCivil War (1860–1865) called the Early Indicators of Later Work Levels, Disease, and Death Project,researchers identified an increased risk of postwar illness among Civil War veterans, including cardiac,gastrointestinal, and mental diseases throughout their lives. In a project partly funded by the NationalInstitutes of Aging, military service files from a total of 15,027 servicemen from 303 companies of theUnion Army stored at the United States National Archives were matched to pension files and surgeon'sreports of multiple health examinations. A total of 43% of the men had mental health problemsthroughout their lives, some of which are today recognized as related to posttraumatic stress disorder(PTSD). Most particularly affected were men who enlisted at ages under 17. Roxane Cohen Silver andcolleagues at the University of California, Irvine, published their results in the February 2006 issue of Archives of General Psychiatry.
Studies of PTSD to date have connected war experiences to the recurrence of mental health problemsand physical health problems such as cardiovascular disease, hypertension, and gastrointestinaldisorders. These studies have not had access to long-term health impacts, since they have focused onveterans of recent conflicts. Researchers studying the impact of modern conflict participation report thatthe factors increasing risk of later health issues include age at enlistment, intimate exposure to violence,prisoner-of-war status, and having been wounded.
The Trauma of the American Civil War
The Civil War was a particularly traumatic conflict for American soldiers. Army soldiers commonlyenlisted at quite young ages; between 15% and 20% of the Union army soldiers enlisted between theages of 9 and 17. Each of the Union companies was made up of 100 men assembled from regionalneighborhoods and thus often included family members and friends. Large company losses—75% ofcompanies in this sample lost between 5% and 30% of their personnel—nearly always meant the loss offamily or friends. The men readily identified with the enemy, who in some cases represented familymembers or acquaintances. Finally, close-quarter conflict, including hand-to-hand combat withouttrenches or other barriers, was a common field tactic during the Civil War.
To quantify trauma experienced by Civil War soldiers, researchers used a variable derived frompercentage of company lost to represent relative exposure to trauma. Researchers found that in militarycompanies with a larger percentage of soldiers killed, the veterans were 51% more likely to have cardiac,gastrointestinal, and nervous disease.
The Youngest Soldiers Were Hardest Hit
The study found that the youngest soldiers (aged 9 to 17 years at enlistment) were 93% more likely thanthe oldest (aged 31 and older) to experience both mental and physical disease. The younger soldierswere also more likely to show signs of cardiovascular disease alone and in conjunction withgastrointestinal conditions, and they were more likely to die early. Former POWs had an increased risk ofcombined mental and physical problems as well as early death.
One problem the researchers grappled with was comparing diseases as they were recorded during thelatter half of the 19th century with today's recognized diseases and psychiatric disorders. For one, PTSDwas not recognized by doctors—although they did recognize that veterans exhibited an extreme level of"nervous disease" that they labeled "irritable heart" syndrome.
Children and Adolescents in Combat
Harvard psychologist Roger Pitman, writing in an editorial in the publication, writes that the impact onyounger soldiers should be of immediate concern, since "their immature nervous systems anddiminished capacity to regulate emotion give even greater reason to shudder at the thought of childrenand adolescents serving in combat." Although disease identification is not one-to-one, said seniorresearcher Roxane Cohen Silver, "I've been studying how people cope with traumatic life experiences ofall kinds for 20 years and these findings are quite consistent with an increasing body of literature on thephysical and mental health consequences of traumatic experiences."
Boston University psychologist Terence M. Keane, Director of the National Center for PTSD, commentedthat this "remarkably creative study is timely and extremely valuable to our understanding of the long-term effects of combat experiences." Joseph Boscarino, senior investigator at Geisinger Health System,added, "There are a few detractors that say that PTSD does not exist or has been exaggerated. Studiessuch as these are making it difficult to ignore the long-term effects of war-related psychological trauma."
The Irritable Heart: Increased Risk of Physical and Psychological Effects of Trauma in Civil War Vets by K. Kris Hirst. © 2011 K. Kris Hirst(http://anthropology.about.com). Used with permission of About Inc., which can be found online at https://www.dotdash.com/. All rightsreserved.
Think about it:
What hypotheses were the researchers testing in this study?
How did the researchers quantify trauma experienced by Civil War soldiers? Do you think this is a validway to operationalize trauma? Explain why or why not.
Would this research be best described as case studies, archival research, or natural observation? Arethere elements of more than one type? Explain.
3.2 Qualitative Research Interviews
As pointed out in our discussion of phenomenological research and case studies, interviews are an essential component of many types ofprojects and can yield a great deal of information on subjects' experiences of particular events. Interviews can be utilized at any stage duringthe research process to identify areas of further exploration, function as the main source of data collection, or provide additional information ondata interpretation (Breakwell, Hammond, & Fife-Schaw, 2000). Research interviews can be used for many purposes and in a wide variety ofcontexts. For example, a researcher may utilize an interview to uncover the subject's beliefs, feelings, and perspectives on an experience;investigate the motives behind certain behaviors; or obtain factual data about an event or person.
Interviews yield similar data to observational research but also provide information on what participants say and how they say it. In addition,data are collected on interviewees' nonverbal behaviors such as eye movements, facial expressions, voice tones, and body posture. All thesedetails can provide additional information about the interviewees' comfortableness about a topic, intensity of feeling, or thoughts about anexperience. However, the main focus of interviews should be on the verbal content the interviewees provide.
Conducting research interviews requires researchers to take a systematic approach to data collection. This gives researchers the ability "tomaximize the chances of maintaining objectivity and achieving valid and reliable results" (Breakwell et al., 2000, p. 239). Interviews require agreat deal of skill and sensitivity; they are often time consuming in order for them to collect enough data to answer the research question(s).And, as with most interpersonal situations, the outcome of the interview is influenced largely by the personality and communication style of theinterviewer and interviewee. If an interviewer is not very personable and engaging, this could influence the quality and quantity of theinformation that the interviewee provides and ultimately limit the interpretations that can be made from it. All interviews should include adynamic, two-way interchange between the interviewer and the interviewee. Whereas quantitative interviews generally utilize structuredinterviews, which include a predetermined and fixed set of questions, qualitative interviews are generally unstructured or semistructured andtake on more of an informal conversational approach, with the interviewee doing most of the speaking.
Interview Characteristics and TechniquesThe following five sections lay out important characteristics of the interviewer, the interview setting, and the types of interviews utilized inqualitative research. As with any type of interview, the interviewer's personality, appearance, and communication style can significantly influencehow the interviewee responds. In addition, where the interview occurs, or in what setting, can have influence on the quality and quantity ofdata collected.
Personal Characteristics of the InterviewerAlthough it might seem that anyone can conduct an interview, an interviewer needs to display certain characteristics in order to ensure asuccessful interview. Aiken and Groth- Marnat (2006) list the following characteristics of a professional interviewer:
maintains a friendly but neutral tone and demeanor;
shows interest in the interview but does not pry or show intense reactions to the interviewee;
keeps a warm and open approach;
does not show approval or disapproval toward the interviewee;
times questions appropriately so that the conversation flows smoothly from topic to topic;
allows appropriate silences or pauses so that the interviewee can collect his or her thoughts;
allows the interviewee to complete a discussion without interrupting;
pays close attention to nonverbal behaviors, such as facial expressions, body posture, and voice fluctuations;
displays patience throughout the interview;
checks with the interviewee to ensure that there are no misunderstandings; and
maintains eye contact.
All these characteristics can determine whether rapport is developed, how comfortable the interviewee feels about sharing information, thetype of information the interviewee discusses, and the length of the interview. In qualitative research, interviews are designed to gather in-depth information, so if the interviewee feels uncomfortable, the researcher may obtain only limited information and the interview process maybe cut short. Therefore, it is imperative that interviewers maintain a friendly and welcoming tone, as well as provide an open environment toensure that the interviewee feels comfortable.
The appearance of the interviewer is another important characteristic. Interviewers that are appropriately dressed and well-groomed will bemore positively received than those who look disheveled or unclean. Likewise, an interviewer dressed in a suit with a briefcase (or a lab coat)might be more intimidating than one dressed in a business-casual manner. Additional characteristics such as age, gender, and ethnicity may alsoinfluence how comfortable the interviewee feels and how the interview progresses (Breakwell et al., 2000).
The Interview Setting 
Johnny Haglund/Lonely Planet Images/Getty Images
The quality of an interview is impacted by the setting of theinterview and the characteristics of the interviewer.
Although interviews can take place anywhere, it is best to conduct them in aquiet, well-lit room that is free of distractions. Conducting interviews in noisyenvironments (the nearest Starbucks) or in rooms that have a lot of distractingdécor items (e.g., posters, paintings, bookshelves) can negatively impact thequality and quantity of the conversation. For example, conducting an interview ata coffee house would not be as productive as conducting the interview in aconference room or at the kitchen table. Additionally, rooms that are not well-litor are too cold or too warm will also influence how the interview progresses. Forexample, if a room is dimly lit and hot, the interviewee may become fatigued andless focused on the interviewer's questions. Another important feature is thecomfortableness of the chairs. Because qualitative interviews are fairly lengthy,setting up comfortable chairs that face each other is imperative.
Unstructured InterviewsUnlike structured interviews in quantitative research that make use of fixedquestions in a particular order, qualitative interviews do not include developedquestions prior to the interview. Unstructured interviews are commonly used in qualitative research and utilize a looser approach. Unstructuredinterviews are probing in nature and are used primarily to explore new topic areas or to investigate topics that are not well understood.Although the researcher has a number of topics in mind that he or she would like to cover, no specific questions have been developed and theprocess of the interview is not outlined or planned. Unstructured interviews involve only open-ended questions, which allow the interviewee torespond as much or as little as he or she may want to. Although interviewers typically have checklists of topics that should be covered and willguide the interviewee with probing questions to remain on topic, interview questions are generally guided by information the intervieweeprovides. The purpose of unstructured interviews is to allow the researcher to obtain an in-depth understanding of the interviewee'sexperiences from his or her own perspective.
Unstructured interviews are similar to informal conversations with a purpose (Hennink, Hutter, & Bailey, 2011). As previously mentioned,unstructured interviews let interviewees share in-depth information in their own words and from their own perspective. Various types ofinformation can be collected from unstructured interviews, including life narratives, the person's identity and background characteristics, and thecontext in which the interviewee lives (Hennink et al., 2011). Unstructured interviews can be used in many situations, such as examiningpersonal life stories or exploring people's feelings, thoughts, and perceptions on a chosen topic.
Steps in Unstructured InterviewsAlthough the researcher does not formulate interview questions before the interview, researchers conducting unstructured interviews may wantto develop an interview guide of topics they would like to cover. Interview guides for unstructured interviews may include reminders about whatto tell the interviewee at the beginning of the interview (e.g., explain the purpose of the research, discuss ethical issues), a statement about thepopulation sample being researched, a list of key topic areas that need to be addressed, and a few probing questions. For example, ifresearching the potential causes or influences of heroin addiction, topic areas might include family history, childhood experiences, relationshipswith family members, peer relationships, first exposure to heroin, experiences with heroin, and so forth.
When meeting an interviewee for the first time, it is important not to jump right into questions or research topics but rather to spend sometime establishing a rapport. Establishing a rapport is extremely important in in-depth interviews because it nurtures a sense of trust. Makingsmall talk about the weather or other current events is a great way to ease the interviewee into the process. It also allows the interviewer andinterviewee to feel more comfortable together. Additionally, in order to maintain the flow of the conversation, note taking is discouraged buttape recording is encouraged.
Unstructured interview questions should be open-ended and nonleading. An open-ended question to the beginning of an interview might takethe following form: Tell me about your experiences with heroin. This type of guided question begins the interview process and allows theinterviewee to respond in any manner. Closed-ended questions (used in quantitative research) should be avoided at all costs because they arenot engaging. For example, asking Has heroin abuse been hard on you? elicits a yes or no response and may not further the discussion. Inaddition, leading questions should be avoided so that interviewees can provide the information on their own terms and voice their ownviewpoint. For example, instead of asking, How did heroin negatively impact your dental hygiene?, a nonleading question would be, How didheroin affect your overall health? The latter question allows the interviewee to approach the topic in any way desired and does not just focuson the negative aspects of dental hygiene.
Data Analysis in Unstructured InterviewsAnalyzing data from unstructured interviews can be complicated and tedious. Because each interview is different (based on the direction theinterviewee took), the information obtained may not be consistent across interviewees. Therefore, to analyze the data, the researcher will needto first transcribe all the recorded interviews onto paper. Then, he or she will need to read through all the information and reflect on its overallmeaning. Content analysis is often used in analyzing interview data. As discussed previously in Archival Research, the process of systematicallyextracting and analyzing a collection of information is known as content analysis. Because interview data can quickly become overwhelming, it isa good idea to begin developing coding categories early in the data collection process. Coding categories are symbols or words applied to agroup of words in order to categorize the information. Once the information is organized into coding categories, the researcher can begin togroup the categories according to their patterns or themes within the data. In addition to common patterns and themes, the researcher mayalso want to include quotations from the interview to support his or her conclusions.
Pros and Cons of Unstructured InterviewsAlthough the flexibility of unstructured interviews provides a number of advantages, there are a few challenges associated with this type of datacollection. First, this approach is so in-depth, unstructured interviews can be very time consuming, especially with larger sample sizes.Establishing a rapport and covering the topic areas thoroughly can take some time. Additionally, because these interviews are unstructured, thelength of the interview will vary depending on the individual and the direction the interview takes. Second, because the interviewer has littlecontrol over the interview process, unstructured interviews can veer off topic easily, and it can be difficult to know how to guide theinterviewee back to the main topic without the risk of losing continuity, naturalness, and comfort in the discussion. And third, because datacollection will vary by interviewee, it might be difficult for the researcher to make comparisons across interviewees.
Semistructured InterviewsIn contrast to unstructured interviews, semistructured interviews give the interviewer more control over the process. Instead of a checklist oftopic areas, the interviewer develops key questions for specific topic areas before the interview and creates a more detailed interview guide.The researcher standardizes the questions across all interviewees, so all of them will be asked the same key questions. However, the keyquestions do not have to be asked in the same order, and the interviewer has the option to pose probing questions to explore an area further.Thus, the semistructured interview often moves between structured and unstructured questions throughout the session.
The interview guide for a semistructured interview is more comprehensive than those used for unstructured interviews. It contains a writtenscript about why the research is being undertaken and how to conduct the interview as well as sets of standardized opening questions, keyquestions, and closing questions. Specific probing questions are also usually provided. The semistructured interview is more flexible than itsunstructured counterpart, as the standardized scripts and questions allow different interviewers to administer basically the same interview.
Semistructured interviews are advantageous in situations where unstructured interviews have already been conducted on the topic or when theresearcher wants to obtain a larger sample size. Standardized questions make the data easier to analyze and interpret. Even so, data analysis forsemistructured interviews follows the same protocols as for unstructured interviews.
Focus Groups 
Michael Blann/Getty Images
A focus group can be thought of as a group interview.
Focus groups are generally conducted when the researcher wants to collect dataon several individuals simultaneously, in the same room. Focus groups are criticalfor organizationally based research, especially action research approaches, and area popular method for studying political trends. A focus group can be thought of asa group interview, where participants share their thoughts, beliefs, experiences,and perspectives on a particular issue. Focus groups usually contain between 10and 12 individuals and meet together for about one to two hours to discuss aparticular topic. There is always a moderator present, who may or may not be theresearcher. He or she introduces the topics to be discussed, ensures that thediscussion remains on topic, and sees to it that no one participant dominates thediscussion (Leedy & Ormrod, 2010).
Similar to the interview guides used in unstructured and semistructuredinterviews, focus groups incorporate discussion guides to guide the discussion andkeep the group focused (Hennink et al., 2011). The discussion guide servesprimarily as a reminder of what topics and questions should be covered. Thestructure of the discussion guide is extremely important to the success of a focusgroup discussion because it helps the moderator introduce the topic, establish arapport among group participants, focus on key topic areas, and bring the discussion to a close (Hennink et al., 2011). Successful discussionguides contain an introduction that explains the nature of the study, any ethical issues, and how the discussion will proceed, as well asstandardized introductory questions, transition questions, key questions, and closing questions. As with other qualitative interview techniques,questions posed in focus groups should be open-ended.
There are several ways to analyze the data collected during a focus group interview. However, summarizing the transcript along with any fieldnotes is the most common and efficient. Because data from some focus groups are needed fairly quickly to address a timely topic, summariesare the most convenient way of communicating the results. In addition, because the data are fairly straightforward, a summary of theconclusions can easily be conducted. Data from focus groups can also be interpreted through content analysis, as discussed previously in thischapter, and through techniques that are beyond the scope of this book.
Pros and Cons of Focus GroupsAs with other qualitative methods, focus groups are used for exploratory and explanatory research. As Hennink et al. (2011) describe, focusgroups are very useful for exploring new topics, obtaining a range of views about a topic, understanding typical behaviors or norms,understanding group processes, and pairing with quantitative or other qualitative methods. Focus groups are especially beneficial whenexploring difficult or traumatic experiences because the group environment tends to be more supportive. For example, if the research topic wasabout losing a spouse from a traumatic accident, participants might find solace and comfort from others who have experienced the sametragedy.
It is important to determine whether a study will benefit more from a focus group or an unstructured or semistructured interview. For example,if the researcher wants to obtain detailed information about participants' experiences, a focus group may not be the best method to use. Sincefocus groups include interactions among various participants, the data collected may not fully represent the individual perspectives of eachparticipant as a one-to-one interview would. In addition, focus groups provide the researcher with very limited control over the discussions thatoccur, so the information obtained may not be consistent with, or fully address, the research questions proposed. And, unlike unstructured andsemistructured interviews, in focus groups the researcher cannot ensure confidentiality and anonymity of the participants because participantsmay share that information outside of the group.
Quantitative Structured InterviewsUnlike the flexible interview techniques used in qualitative research, quantitative research involves more structured and standardized datacollection methods. Structured interviews include a fixed set of either open-ended or closed-ended questions that are administered in a fixedorder. Thus, researchers develop questions prior to the interview and administer the same questions in exactly the same order to everyparticipant. Because of the standardized format, structured interviews are easily replicated and can be administered to large sample groups byvarious interviewers. In addition, the data collected from structured interviews is much easier to analyze than data from unstructured andsemistructured interviews because the standardized question format enables easy coding and interpretation.
Pros and Cons of Structured InterviewsUnlike qualitative interviewing techniques, structured interviews also provide a reliable source of data collection. However, this method is notwithout limitations. One significant weakness involves the limited amount of information that can be obtained during the interview process.Structured interviews are not intended to explore complex issues or opinions and provide no flexibility in the questions asked. If the questionsare poorly written, the interviewer cannot modify the questions or present additional probing questions to obtain further information. Anotherlimitation involves the quality of the data that are collected. Because the questions in structured interviews are standardized and more directive,they do not lend themselves to elicit in-depth responses. Thus, participants end up providing only very limited responses to the questions. Afurther discussion of interview and survey techniques for quantitative research is discussed in Chapter 4.
Reliability and Validity of InterviewsInterviews are an important data collection method but, like observational methods, they too impart problems with reliability and validity. And,because reliability requires consistency, it is often difficult to generate high levels of reliability using unstructured and semistructured interviews.Because unstructured and semistructured interviews differ among interviewees in their approach and process, there might be little consistencyacross interviews. For example, if unstructured interviews were administered to 10 participants, it is very unlikely that any 2 interviews willfollow the same process, cover the same material, or generate the same data. The interviewer's experiences with the topic being discussed mayalso influence how the data are analyzed and interpreted, and in larger studies, there are bound to be several interviewers. Additionally, as withany self-report measure, the interviewee's responses may be distorted or inaccurate based on what he or she believes the interviewer wants tohear. It is also possible that an interviewee may feel uncomfortable with the interviewer or the topic being discussed and may withholdimportant details. And sometimes, interviewees are simply unable to remember all the details of an experience, so the information they provideis not complete.
The validity of interviews is extremely variable and increases along with more structured methods. Thus, structured and semistructuredinterviews will generally have higher levels of validity than unstructured interviews owing to the more reliable data that the structured formatcan generate. Interviews that focus on specific topics and are analyzed by two or more evaluators also tend to have higher validity levels. Havingmore than one researcher agreeing on the findings increases the likelihood that the results are valid. Additionally, utilizing other types ofmeasurement methods, such as observations or experiments, to supplement the interview increases the validity of interview data.
When conducting any type of interview, the interviewer is considered the assessment or measurement tool (Aiken & Groth-Marnat, 2006). Thus,the interviewer is the key instrument used to collect data in the study. As a result, most reliability problems associated with interviews are theresult of the characteristics and behavior of the interviewer. For example, such interviewer characteristics as appearance, age, gender,demeanor, and personality can influence how engaged the interviewee becomes during the interview and the type of information he or she willdisclose. The interviewer's personal biases can also influence the direction of the interview and the type of data that is gathered. Since theinterviewer is in charge of the interview, the length of interview and the data collected depend on the interviewer's questions. Ignoring specificquestion areas, asking the wrong questions, or asking questions that elicit short responses will affect the type of information the intervieweeprovides.
Although some interviewer effects cannot be eliminated, Breakwell et al. (2000) discuss a few ways to control for them. One way to do thisinvolves having the same person conduct all interviews so that the effects of the interviewer are constant. While this technique ensures that theinterviewer's appearance and personal biases will likely be constants, it does not ensure that variation among the interviewees will beeliminated. Some interviewees may feel more comfortable with a male, for example, or be more willing to open up to someone who is middle-aged. Another way to control for interviewer effects is to have several interviewers randomly assigned to interviewees. Instead of holding theinterviewer constant across all interviews, utilizing different interviewers can minimize any strong effects that might be experienced with oneparticular interviewer. Finally, some researchers might find it helpful to match interviewers to interviewees based on age or gender. This isespecially useful if it is known that particular interviewees feel more comfortable with certain types of people.
Ethical GuidelinesWhen conducting interviews, several important ethical issues need to be addressed. First, it is imperative that the interviewer provide anexplanation of the purpose of the research, the intent of the interview, and any potential risks and benefits of participating (this is also knownas informed consent). Thus, all interviewees must be notified of all the features of the study so they can make intelligent decisions about theirwillingness to participate. If the interview includes sensitive or emotional topics, interviewees need to be informed that they will be asked todiscuss some painful or embarrassing experiences. In addition, interviewees need to be told how any identifying information will be keptconfidential as well as how the researchers will protect any information shared and collected.
As with all types of research, the participant (or in this case, the interviewee) must be protected from harm. Interviewers must take reasonablesteps to ensure that interviewees do not experience any harm during the interview or research process. In practice, this means that the risk ofharm for the interviewee is not greater than the harm that he or she would experience in everyday life and that the risk is outweighed by thebenefits of the study. (See APA and Other Ethical Guidelines in Chapter 1 for further discussion.)
3.3 Critiquing a Qualitative Study
How does one assess the overall worth and credibility of a qualitative research study or proposal? What characteristics constitute strongresearch studies, and what characteristics constitute weak ones? The methods and guidelines for evaluating research studies are fairly detailedand tedious. Not all studies are worthy or rigorous, and it is important that you, as a consumer of psychological research, are able to identifypotential problems. Just because a study claims to have valid and reliable results does not necessarily mean that it does. For example, somestudies may utilize incorrect statistical or data analysis procedures, so the results generated may not be correct or complete. Additionally, somestudies may use inappropriate sampling techniques for the type of research design being conducted. As professionals in the field, you will needto be able to identify which parts of a study are valid, which parts can be considered acceptable with caution, and which parts have significantlimitations or are downright misleading.
Leedy and Ormrod (2010) reviewed standards from experienced qualitative researchers and compiled a list of general criteria to apply whenevaluating a qualitative study:
Purposefulness: Does the research question(s) drive the research process and the methods to collect and analyze the data?
Explicitness of Assumptions and Biases: Does the researcher describe any assumptions, expectations, or biases that might influence how thedata are collected, analyzed, and interpreted?
Rigor: Does the researcher use rigorous, precise, and thorough methods to collect, record, and analyze the data? Does the researcher takesteps to remain objective throughout the study?
Open-mindedness: Is the researcher willing to modify interpretations when newly collected data do not support previously collected data?
Completeness: Does the researcher describe the phenomenon in all its complexity? Does the researcher spend sufficient time in the fieldexamining the phenomenon, detail all aspects of the phenomenon (e.g., setting, behaviors, perceptions), and provide a holistic picture of thephenomenon?
Coherence: Do the data show consistent findings with the measurement used and across multiple measurement methods used?
Persuasiveness: Does the researcher provide logical arguments, and does the evidence support one interpretation of the data?
Consensus: Do other studies and researchers in the field agree with the interpretations and explanations?
Usefulness: Does the study provide useful implications for future research, a more thorough understanding of the phenomenon, or lead tointerventions that could enhance the quality of life? (p. 187)
In addition to these criteria, there are several factors to consider when evaluating the various sections of a research study or proposal. The nextseven sections will discuss how to critically evaluate the literature review, the purpose statement, the sampling methods, the procedures, theinstruments, the results, and the discussion section of a qualitative study.
Evaluating the Literature Review SectionAs mentioned in Chapter 1, the purpose of the literature review is to support the need for research to be conducted. Literature reviews shouldbe thorough and comprehensive and contain all relevant research on the specific topic being studied. Literature reviews should also beobjective, showing no biases toward the selection of articles being reviewed, and include previous research that relates to the current study.The following questions, adapted from Houser (2009), will assist in the evaluation of the literature review:
Do the researchers present an adequate rationale for conducting the study?
What is the significance of the study? What difference will it make to the field?
Is the literature review thorough and comprehensive?
Do the researchers demonstrate any potential biases in the literature review?
Are all important concepts clearly defined by the researchers?
Do the researchers clearly describe previous methods that are relevant to understanding the purpose for conducting this study?
The purpose statement provides the aim or intent of the study. It is generally found in the Introduction section, as the last paragraph before theLiterature Review section. Purpose statements can be written as a declarative statement or in the form of a question or questions. They shouldinclude the type of research methods and design used and describe the variables and population studied. When evaluating the purposestatement, it is also important to examine whether the purpose and research problem are in fact researchable. Purpose statements andresearch problems are researchable only when the variables of interest can be operationalized—that is, defined in a measurable and objectiveway. Considering these requirements, the following questions, adapted from Houser (2009), can assist in the evaluation of the purposestatement:
Does the article clearly present the purpose statement?
Is the purpose statement clearly based on the argument developed in the literature review?
Are the variables of interest (i.e., independent and dependent) clearly identified in the purpose statement?
The Sampling section includes thorough and detailed information on the sample used and the techniques or methods used to select the sample.Descriptions of the sample should include all relevant demographic characteristics (e.g., age, ethnicity, sex) as well as size. Unlike quantitativeapproaches, which usually require large samples, qualitative techniques do not have any restrictions on sample size. Thus, sample size dependson what the research wants to know, the purpose of the inquiry, what it will be useful for, how credible it will be, and what can be done withavailable time and resources. Qualitative research can be very costly and time-consuming, so choosing information-rich cases will be mostvaluable. As noted by Patton (2002), "The validity, meaningfulness, and insights generated from qualitative inquiry have more to do with theinformation-richness of the cases selected and the observational/analytical capabilities of the researcher than with sample size" (p. 245).
The sampling techniques employed should also be discussed, including detailed information about how the sample was selected and whatsampling methods were used (e.g., purposive sampling, snowball sampling). In contrast to quantitative research, which strives for generalizablerepresentative sampling, qualitative research typically focuses on relatively smaller samples, and even sometimes only single cases, that areselected purposefully. "Purposeful sampling refers to selecting information-rich cases for study in depth" (Patton, 2002, p. 230). When evaluatingthe sampling methods section, it is important to examine whether appropriate sampling techniques were used for the type of research designthat was employed and the research questions proposed. The following list covers a few of the most common sampling procedures used inqualitative studies (these are discussed in more detail in Chapter 4):
Purposive sampling (or judgment sampling): The researcher selects a sample that will yield the most information to answer the researchquestions.
Quota sampling (a type of purposive sampling): The researcher determines the number of participants and what characteristics will beneeded, and then selects a sample based on those.
Theoretical sampling: The researcher selects a sample that will assist him or her in developing a theory.
Convenience sampling: The researcher selects anyone who shows up for the study, regardless of individual demographics.
Snowball sampling (a type of purposive sampling): The researcher collects data on a few participants that he or she has access to and thenasks those participants for referrals to other individuals who are within the same population.
All these approaches serve a somewhat different purpose. However, the underlying principle common to all of these techniques is selectinginformation-rich cases.
The following questions, adapted from Houser (2009), are provided to assist in the evaluation of the sampling methods section:
What type of sampling method is used?
Are the sampling procedures consistent with the purpose and research questions?
Are relevant demographic characteristics of the sample clearly identified?
Do the methods of sample selection provide a good representative sample, based on the population?
Are there any apparent biases in the selection of the sample?
Is the sample size large enough for the study proposed?
The procedures section provides a detailed description of everything that was conducted in the study. For qualitative studies, this involvesprimarily the type of research design that was employed. When evaluating the procedures section, it is important to examine whether theresearch design is appropriate for the study, as well as whether it is consistent with the purpose and research questions. The followingquestions, adapted from Houser (2009), are provided to assist in the evaluation of the procedures section:
What type of research design is used (e.g., case study, phenomenological study)?
Is the research design consistent with the purpose and research questions?
Did the researcher provide a detailed description of what was conducted?
Did the researcher introduce any bias in the procedures used?
The instruments section provides a detailed description regarding the types of instruments and measures that were used to collect the data. Inqualitative research, common instrumentation includes interviews, observations, and journals. When evaluating the instruments section, it isimportant to consider whether the instruments were appropriate for the study and the sample and whether there were any limitations in thetypes of instruments utilized. The following questions, adapted from Houser (2009), are provided to assist in the evaluation of the instrumentssection:
Is there a clear and adequate description of the instruments (e.g., data collection measures) used?
What types of measures were used in the study (observations, interviews, etc.)?
What are some potential problems or limitations of the types of measures used?
Does the instrument appear to be appropriate for the sample?
The results section describes findings from the study. Unlike quantitative studies, which focus on statistical analyses and results, qualitativestudies include descriptions about the findings. When evaluating the Results section, it is important to examine how the data were analyzed(using themes, patterns, codes, etc.), whether concrete examples supported the themes or concepts, and how adequate the descriptions wereto the findings. The following questions, adapted from Houser (2009), are provided to assist in the evaluation of the results section:
What strategies were used for coding and interpreting the data? Were they clearly described?
Are concrete examples provided that link to identified themes or concepts? Are the examples adequate?
The discussion section summarizes the purpose of the research and what the findings imply for future research and actual practice. Additionally,the discussion section includes alternative explanations and potential limitations of the findings. The following questions, adapted from Houser(2009), are provided to assist in the evaluation of the discussion section:
Do the researchers clearly restate the purpose and research questions?
Do the researchers clearly discuss the implications of the findings and how they relate to theories, other findings, and actual practice?
Do the researchers provide alternative explanations of the findings?
Do the researchers identify potential limitations of the study and the results?
Do the researchers identify possible directions for future research?
Although the format of a qualitative research proposal looks similar to the proposal provided in Chapter 1, Section 1.6, the content of some ofthe sections will differ from that of a quantitative study. Like quantitative studies, the qualitative proposal includes a title page, abstract page,and an introduction that discusses the research problem, statement of the problem, research questions, and importance of the study. (Pleaserefer to Chapter 1, Section 1.3, Research Problem and Questions, for further guidance.) However, the literature review and methods sections willdiffer with respect to focus and content. The following sections discuss the writing requirements for the qualitative literature review andmethods sections.
The Literature Review SectionAs discussed in Chapter 1, the primary purpose of the literature review is to cover theoretical perspectives and previous research findings onthe research problem you have selected (Leedy & Ormrod, 2010). The literature review should demonstrate how your study will clarify orprovide further information on shortcomings found in previous research as well as how your study will add to the existing literature. Thepurpose of the literature review for qualitative studies is slightly different from that of quantitative studies and will vary depending on the typeof research design you are using. Table 3.4 summarizes the purposes of the literature review with respect to research design.
| Table 3.4: Purposes of the literature review in qualitative research | |
| Type of QualitativeResearch | Purpose of the Literature Review |
| Ethnographical research | Review the literature to provide a background for conducting the study |
| Phenomenologicalresearch | Compare and combine findings from the study with the literature to determine current knowledge of aphenomenon |
| Grounded theoryresearch | Use the literature to explain, support, and extend the theory generated in the study |
| Case study research | Review the literature to provide a background for the study, as well as explain and support the study |
| Archival/historicalresearch | Review the literature to develop research questions and provide a source of data |
| Observational research | Review the literature to provide a background for conducting the study. |
Adapted from Burns & Grove, 2005, p. 95.
Part of your literature review should include information about the research design you have selected. So you will want to include informationfrom books and articles, as well as other research studies that have employed the same design.
The Method SectionAs discussed in Chapter 1, the Method section includes a detailed description of the method of inquiry (quantitative, qualitative, or mixeddesign approach), research method used, the sample, data collection procedures, and data analysis techniques. The key purpose of the Methodsection is to discuss your design and the specific steps and procedures you plan to follow in order to complete your study.
Similar to quantitative proposals, qualitative proposals include the research method that will be used. However, qualitative proposals requireexplanations on why other methods (such as quantitative or mixed designs) would have been less effective for the study. Another key differencein qualitative proposals is that they feature a discussion of the researcher's role during data collection procedures. Since the researcher isconsidered the assessment or instrument tool in most qualitative studies, the impact of researcher bias and researcher effects needs to bediscussed in detail. Additionally, because qualitative study samples are generally smaller than quantitative ones, the researchers should justifythe appropriateness of the sample size in relation to the research design and questions.
The Method section for qualitative proposals is generally lengthier than for quantitative proposals because more thoroughness is required whendescribing the procedures and data collection methods used. For example, if conducting ethnographic research, you will need to describe thesite that was selected, how the site was selected, how you will enter the site, how you will gain rapport with the subjects, and the various typesof data collection procedures you will use. You will also want to discuss the length of the data collection period and how you plan to exit thesite. Additionally, data collection can be more cumbersome since qualitative studies tend to employ different methods for it. And, because thedata collected are found in detailed narratives, you will want to describe the process you will use to analyze the narratives as well as the variousdata analysis procedures you will use.
3.5 Describing Data in Descriptive Research
To cap off our discussion of descriptive research designs, this section will cover the process of presenting descriptive data in both graphical andnumeric form. No matter how you present your data, a good description should be accurate, concise, and easy to understand. In other words,you have to represent the data accurately and in the most efficient way possible so that your audience can understand it. Another, moreeloquent way to think of these principles is to take the advice of Edward Tufte, a statistician and expert in the display of visual information.Tufte suggests that when people view your visual displays, they should spend time on "content-reasoning" rather than "design-decoding" (Tufte,2001). The sole purpose of designing visual presentations is to communicate your information. So the audience should spend time thinkingabout what you have to say, not trying to puzzle through the display itself. The following sections cover guidelines for accomplishing this goal inboth numeric and visual form.
Table 3.5 presents hypothetical data from a sample of 20 participants. In this example, we have asked people to report their gender andethnicity, as well as answer questions about their overall life satisfaction and level of daily stress. Each row in this table represents oneparticipant in the study, and each column represents one of the variables for which data were collected. In the following sections, we willexplore different options for summarizing these sample data, first in numeric form and then using a series of graphs. In this chapter, the focus ison ways to describe the sample characteristics. In later chapters, we will return to these principles when discussing graphs that display therelationship between two or more variables.
| Table 3.5: Raw data from a sample of 20 individuals | ||||
| Subject ID | Gender | Ethnicity | Life Satisfaction | Daily Stress |
| Male | European American | 40 | 10 | |
| Male | European American | 47 | ||
| Female | Asian | 29 | ||
| Male | European American | 32 | ||
| Female | Hispanic | 25 | ||
| Female | Hispanic | 35 | ||
| Female | European American | 28 | ||
| Male | Hispanic | 40 | ||
| Male | Asian | 37 | 10 | |
| 10 | Female | African American | 30 | 10 |
| 11 | Male | European American | 43 | |
| 12 | Male | Asian | 40 | |
| 13 | Male | European American | 48 | |
| 14 | Female | African American | 30 | |
| 15 | Female | European American | 37 | |
| 16 | Male | Hispanic | 40 | |
| 17 | Female | European American | 36 | |
| 18 | Male | African American | 45 | |
| 19 | Female | European American | 42 | |
| 20 | Female | African American | 38 | |
Raw data, as shown in Table 3.5, illustrate the actual characteristics or scores for every participant in the sample. To better understand rawdatasets, researchers often use numerical descriptions, or descriptive statistics, to summarize a set of scores or a distribution of numbers. Forexample, utilizing the raw data shown previously, a researcher may want to be able to communicate the total number of females and malesthat were included in the sample, as well as the average Life Satisfaction score across all participants. In order to calculate these, you would usedescriptive statistics such as frequencies (how many females and males were included in the sample); measures of central tendency (i.e., themean, median, and mode of the Life Satisfaction scores); and measures of variability or distribution (i.e., the variance and standard deviation ofthe Life Satisfaction scores). Descriptive statistics are generally used first to describe the sample (e.g., how many females and males are includedin the sample) and then to describe the scores. The following section will discuss common procedures used to summarize sets of data.
Frequency TablesOften, a good first step in approaching your dataset is to get a sense of the frequencies for your demographic variables—gender and ethnicity inthis example. The frequency tables shown in Table 3.6 are designed to present the number and percentage of the sample that fall into each ofa set of categories. As you can see in this pair of tables, our sample consisted of an equal number of men and women (i.e., 50% for eachgender). The majority of our participants were European American (45%), with the remainder divided almost equally between African American(20%), Asian (15%), and Hispanic (20%) ethnicities.
| Table 3.6: Frequency table summarizing ethnicity and sex distribution | ||||
| Gender | Frequency | Percentage | ValidPercentage | CumulativePercentage |
| Female | 10 | 50.0 | 50.0 | 50.0 |
| Male | 10 | 50.0 | 50.0 | 100.0 |
| Total | 20 | 100.0 | 100.0 | |
| Ethnicity | Frequency | Percentage | ValidPercentage | CumulativePercentage |
| African American | 4 | 20.0 | 20.0 | 20.0 |
| Asian | 3 | 15.0 | 15.0 | 35.0 |
| Hispanic | 4 | 20.0 | 20.0 | 55.0 |
| EuropeanAmerican | 9 | 45.0 | 45.0 | 100.0 |
| Total | 20 | 100.0 | 100.0 | |
We can gain a lot of information from numerical summaries of data. In fact, numeric descriptors form the starting point for doing inferentialstatistics and testing our hypotheses. We will cover these statistics in later chapters, but for now it is important to understand that two numericdescriptors can provide a wealth of information about our dataset: measures of central tendency and measures of dispersion.
Measures of Central TendencyThe first number we need to describe our data is a measure of central tendency, which represents the most typical case in our dataset. Thereare three indices for representing central tendency:
The mean is the mathematical average of our dataset, calculated using the following formula:
M=∑XN
The capital letter M is used to indicate the mean; the X refers to individual scores, and the capital letter N refers to the total number of datapoints in the sample. Finally, the Greek letter sigma, or Σ, is a common symbol used to indicate the sum of a set of values.
So, in calculating the mean, we add up all the scores in our dataset (ΣX) and then divide this total by the number of scores in the dataset (N).Because we are adding and dividing our scores, the mean can be calculated only using interval or ratio data (see Chapter 2, Section 2.3, for areview of the four scales of measurement). In our sample dataset, we could calculate the mean for both life satisfaction and daily stress. Tocalculate the mean value for life satisfaction scores, we would first add the 20 individual scores (i.e., 40 + 47 + 29 + 32 + . . . + 38), and thendivide this total by the number of people in the sample (i.e., 20).
M=∑XN=74220=37.1
In other words, the mean, or most typical satisfaction rating in this sample, is 37.1.
The median is another measure of central tendency, representing the number in the middle of our dataset, with 50% of scores both above andbelow it. The location of the median is calculated by placing the list of values in ascending numeric order, then using the following formula:
Mdn=(N+1)2
For example, if you have 9 scores, the median will be the fifth one:
Mdn=(N+1)2=(9+1)2=102=5
If you have an even number of scores, say 8, the median will fall between two scores:
| Mdn=(8+1)2=92=4.5 |
or the average of the fourth and fifth one.
This measure of central tendency can be used for ordinal, interval, or ratio data because it does not require mathematical manipulation toobtain. So in our sample dataset, we could calculate the median for either life satisfaction or daily stress scores. To find the median score for lifesatisfaction, we would sort the data in order of increasing satisfaction scores (which in this case has already been done). Next, we find theposition of the median using the formula
Mdn=(N+1)2
because we have an N of 20 scores:
Mdn=(N+1)2=20+12=212=10.5
In other words, the median will be the average of the 10th and 11th scores. The 10th participant scored a 37, and the 11th participant scored a38, for a median of 37.5. The median is another way to represent the most typical score on life satisfaction, so it is no accident that it is sosimilar to the mean (i.e., 37.1).
The final measure of central tendency, the mode, represents the most frequent score in our dataset, obtained either by visual inspection of thevalues or by consulting a frequency table like Table 3.6. Because the mode represents a simple frequency count, it can be used with any of thefour scales of measurement. In addition, it is the only measure of central tendency that is valid for use with nominal data (consisting of grouplabels) since the numbers assigned to these data are arbitrary.
So in our sample data we could calculate the mode for any variable in the table. To find the mode of life satisfaction scores, we would simplyscan the table for the most common score, which turns out to be 40. Thus, we have one more way to represent the most typical score on lifesatisfaction. Note that the mode is slightly higher than our mean (37.1) or our median (37.5). We will return to this issue shortly and discuss theprocess of choosing the most representative measure. Since we have been ignoring the nominal variables so far, let's also find the mode forethnicity. This is accomplished by tallying up the number of people in each category—or, better yet, by letting a computer program do thetallying for you. As we saw earlier, the majority of our participants were European American (45%), with the remainder divided almost equallyamong African American (20%), Asian (15%), and Hispanic (20%) ethnicities. So the modal (most typical) value of ethnicity in this sample wasEuropean American.
One important take-home point is that your scale of measurement largely dictates the choice between measures of central tendency—nominalscales can use only the mode, and interval or ratio scales can use only the mean. The other piece of the puzzle is to consider which measurebest represents the data. Remember that the central tendency is a way to represent the "typical" case with a single number, so the goal is tosettle on the most representative number. This process is illustrated by the examples in Table 3.7.
| Table 3.7: Comparing the mean, median, and mode | ||||
| Data | Mean | Median | Mode | Analysis |
| 1, 2, 3, 4,5, 11, 11 | 5.29 | 11 | • Both the mean and the median seem torepresent the data fairly well. | |
| 1, 1, 1, 5,10, 10,100 | 18.29 | • The mean is inflated by the atypicalscore of 100 and therefore does notrepresent the data accurately. | ||
Let's look at one more example, using the "daily stress" variable from our sample data in Table 3.5. The daily stress values of our 20 participantswere as follows: 1, 1, 3, 3, 4, 4, 7, 7, 7, 8, 8, 8, 8, 8, 9, 9, 9, 10, 10, and 10.
To calculate the mean of these values, we add up all the values and divide by our sample size of 20:
M=∑XN=13420=6.70
To calculate the median of these values, we use the formula
Mdn=(N+1)2
to find the middle score:
Mdn=(N+1)2=(21)2=10.5.
This tells us that our median is the average of our 10th and 11th scores, or 8.
To obtain the mode of these values, we can inspect the data and determine that 8 is the most common number because it occurs five times.
In analyzing these three measures of central tendency, we see that they all appear to represent the data accurately. The mean is a slightlybetter choice than the other two because it represents the lower values as well as the higher ones.
Measures of DispersionThe second measure used to describe our dataset is a measure of dispersion, or the spread of scores around the central tendency. Measures ofdispersion tell us just how typical the typical score is. If the dispersion is low, then scores are clustered tightly around the central tendency; ifdispersion is higher, then the scores stretch out farther from the central tendency. Figure 3.2 presents a conceptual illustration of dispersion.The graph on the left has a low amount of dispersion because the scores (yellow curve) cluster tightly around the average value (red dottedline). The graph on the right shows a high amount of dispersion because the scores (yellow curve) spread out widely from the average value(red dotted line).
Figure 3.2: Two distributions with a low versus high amount of dispersion 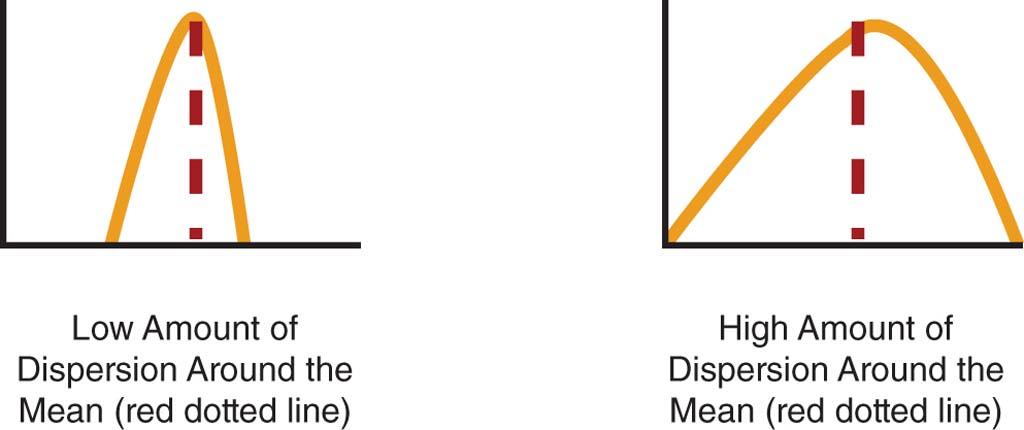
One of the most straightforward measures of dispersion is the range, which is the difference between the highest and lowest scores. In the caseof our daily stress data, the range would be found by simply subtracting the lowest value (1) from the highest value (10) to get a range of 9.The range is useful for getting a general idea of the spread of scores, although it does not tell us much about how tightly these scores clusteraround the mean.
The most common measures of dispersion are the variance and standard deviation, both of which represent the average difference between themean and each individual score. The variance (abbreviated S2) is calculated by subtracting each score from the mean to get a deviation score,squaring and summing these individual deviation scores, and then dividing by the sample size. The more scores are spread out around themean, the higher the sum of our deviation scores will be, and therefore the higher our variance will be. The deviation scores are squaredbecause otherwise their sum would always equal zero; that is, Σ(X – M) = 0. Finally, the standard deviation, abbreviated SD, is calculated bytaking the square root of our variance. This four-step process is illustrated in Table 3.8, using a hypothetical dataset of 10 participants.
Once you know the central tendency and the dispersion of your variables, you have a good sense of what the sample looks like. These numbersare also a valuable piece for calculating the inferential statistics that we ultimately use to test our hypotheses.
| Table 3.8: Steps to calculate the variance and standard deviation | |||
| Values | 1. Subtractvalues frommean. | 2. Square andsum deviationscores. | 3. Calculate variance. |
| (1 – 5.4) = –4.4 | –4.42 = 19.36 | S2=∑(X−X−−)N=82.410=8.24 | |
| (2 – 5.4) = –3.4 | –3.42 = 11.56 | ||
| (2 – 5.4) = –3.4 | –3.42 = 11.56 | ||
| (4 – 5.4) = –1.4 | –1.42 = 1.96 | ||
| (5 – 5.4) = –0.4 | –0.42 = 0.16 | ||
| (7 – 5.4) =1.6 | 1.62 = 2.56 | 4. Calculate standard deviation. | |
| (7 – 5.4) =1.6 | 1.62 = 2.56 | s=s2−−√=8.24−−−−√=2.87 | |
| (8 – 5.4) =2.6 | –.62 = 6.76 | ||
| (9 – 5.4) =3.6 | 3.62 = 12.96 | ||
| (9 – 5.4) =3.6 | 3.62 = 12.96 | ||
| mean= 5.40 | Σ = 0.00 | Σ = 82.40 | |
So far, we have been discussing ways to describe one particular sample in numeric terms. But what do we do when we want to compare resultsfrom different samples or from studies using different scales? Let's say you want to compare the anxiety levels of two people; unfortunately, inthis example, the people were measured using different anxiety scales:
Joe scored 25 on the ABC Anxiety Scale, which has a mean of 15 and a standard deviation of 2.
Deb scored 40 on the XYZ Anxiety Scale, which has a mean of 30 and a standard deviation of 10.
At first glance, Deb's anxiety score appears higher, but note that the scales have different properties: The ABC scale has an average score of 15,while the XYZ scale has an average score of 30. The dispersion of these scales is also different; scores on the ABC scale cluster more tightlyaround the mean (i.e., SD = 2 compared with SD = 10).
The solution for comparing these scores is to convert both of them to standard scores (or z-scores), which represent the distance of each scorefrom the sample mean, expressed in standard deviation units. The formula for a z-score is:
z=x−MSD
This formula subtracts the individual score from the mean and then divides this difference by the standard deviation of the sample. In order tocompare Joe's score with Deb's score, we simply plug in the appropriate numbers, using the mean and standard deviation from the scale thateach one completed. This lets us put scores from very different distributions on the same scale. So, in this case:
Joe: z=x−MSD=25−152=102=5
Deb: z=x−MSD=40−302=1010=1
The resulting scores represent each person's score in standard deviation terms: Joe is 5 standard deviations above the mean of the ABC scale,while Deb is only 1 standard deviation above the mean of the XYZ scale. Or, in plain English, Joe is actually considerably more anxious than Deb.
In order to understand just how anxious Joe is, it is helpful to know a bit about why this technique works. If you have taken a statistics class,you will have encountered the concept of the normal distribution (or "bell curve"), a symmetric distribution with an equal number of scores oneither side of the mean, as illustrated in Figure 3.3.
Figure 3.3: Standard deviations and the normal distribution 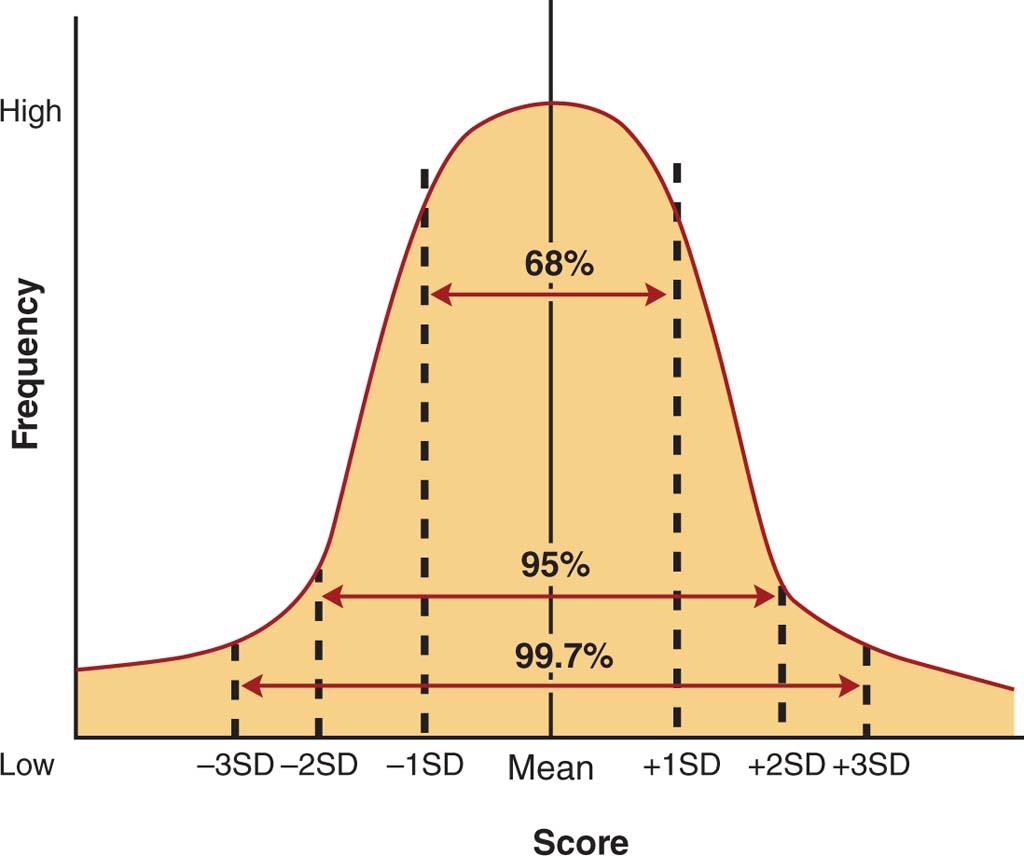
It turns out that lots of variables in the social and behavioral sciences fit this normal distribution, provided the sample sizes are large enough.The useful thing about a normal distribution is that it has a consistent set of properties, such as having the same value for mean, median, andmode. In addition, if the distribution is normal, each standard deviation cuts off a known percentage of the curve, as illustrated in Figure 3.3.That is, 68% of scores will fall within ± one standard deviation of the mean; 95% of scores will fall within ± two standard deviations; and 99.7%of scores will fall within ± three standard deviations.
These percentages allow us to understand our individual data points in even more useful ways, because we can easily move back and forthbetween z-scores, percentages, and standard deviations. Take our example of Joe and Deb's anxiety scores: Deb has a z-score of 1, which meansher anxiety is 1 standard deviation above the mean. And, as we can see by consulting the normal distribution, her anxiety level is higher than84% of the population. Poor Joe has a z-score of 5, which means his anxiety is 5 standard deviations above the mean. This also means that hisanxiety is higher than 99.999% of the population. (Click here for a handy online calculator that converts between z-scores and percentages.)
This relationship between z-scores and percentiles is also commonly used in discussions of intelligence test scores. Tests that purport tomeasure IQ are converted to a scale that has a mean of 100 and a standard deviation of 15. Because IQ is normally distributed, we are able tomove easily back and forth between z-scores and percentages. For example, someone who has an IQ test score of 130 falls 2 standarddeviations above the mean and falls in the upper 2.5% of the population. A person with an IQ test score of 70 is 2 standard deviations belowthe mean and thus falls in the bottom 2.5% of the population.
Ultimately, the use of standard scores allows us to take data that have been collected on different scales—perhaps in different laboratories anddifferent countries—and place them on the same metric (standard of measurement) for comparison. As we have discussed in several contexts,science is all about the accumulation of knowledge one study at a time. The best support for an idea comes when it is supported by data fromdifferent researchers, using different measures to capture the same concept. The ability to convert these different measures back to the samemetric is an invaluable tool for researchers who want to compare research results.
Visual DescriptionsDisplaying your data in visual form is often one of the most effective ways to communicate your findings—hence the cliché, a picture is worth athousand words. But what sort of visual aids should you use? Your choice of graphs should be guided by two criteria: the scale of measurementand the best fit for the results.
Displaying FrequenciesOne common type of graph is the bar graph, which also summarizes the frequency of data by category. Figure 3.4a presents a bar graph,showing our four categories of ethnicity along the horizontal axis and the number of people falling into each category indicated by the height ofthe bars. So, for example, this sample contains 9 European American participants and 4 Hispanic participants. You'll notice that these bar graphscontain exactly the same information as the frequency table in Table 3.6. When reporting your results in a paper, you would, of course, use onlyone of these methods; more often than not, graphical displays are the most effective way to communicate information.
Figure 3.4b shows another variation on the bar graph, the clustered bar graph, which summarizes frequency by two categories at one time. Inthis case, our bar graph displays information about both gender and ethnicity. As in the previous graph, our categories of ethnicity are displayedalong the horizontal axis. But this time, we have divided the total number of each ethnicity by the gender of respondents—indicated usingdifferent colored bars. For example, you can see that our 9 European American participants are divided into 5 males and 4 females; similarly,our 4 African American participants are divided into 1 male and 3 females.
Figure 3.4: Bar graph displaying (a) frequency by ethnicity and (b) clustered bargraph displaying frequency by ethnicity and gender| (a) |
|
| (b) |
|
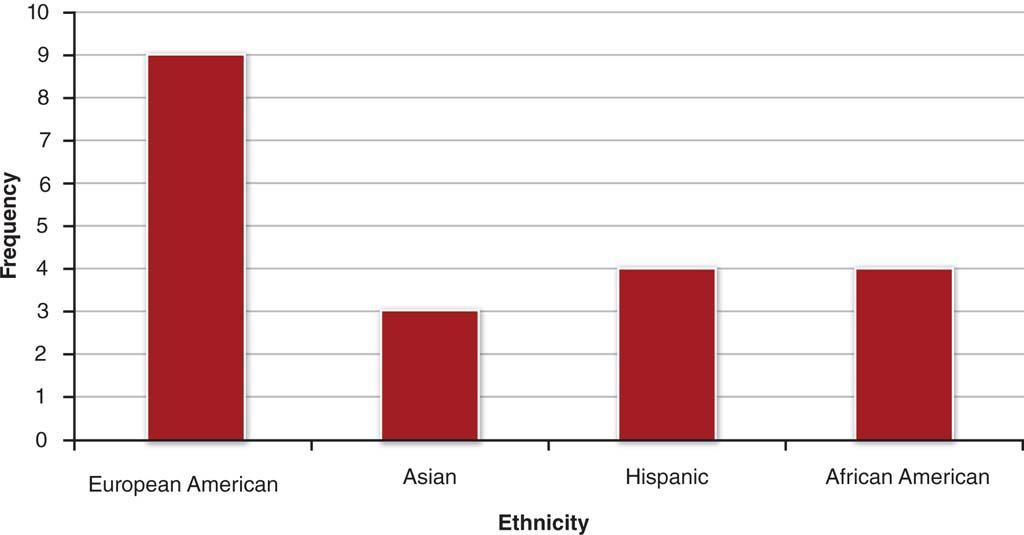
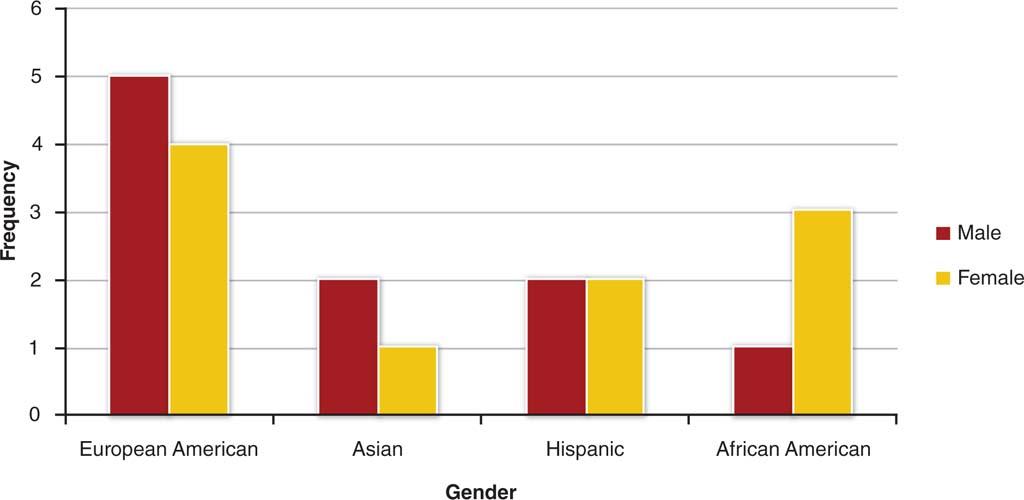
The important rule to keep in mind with bar graphs is that they are used for qualitative, or nominal, categories—that is, those that do not havea numerical value. We could just as easily have listed European American participants second, third, or fourth along the axis because ethnicity ismeasured on a nominal scale.
When we want to present quantitative data—that is, those values measured on an ordinal, interval, or ratio scale—we use a different kind ofgraph called a histogram. As seen in Figure 3.5a, histograms are drawn with the bars touching one another to indicate that the categories arequantitative and on a continuous scale. In this figure, we have broken down the "life satisfaction" values into three categories (less than 31, 31–40, and 41–50) and displayed the frequencies for each category in numerical order. For example, you can see that six people had life satisfactionscores falling between 31 and 40.
Finally, all our bar graphs and histograms so far have displayed data that have been split into categories. But, as seen in Figure 3.5b, histogramscan also present data on a continuous scale. Figure 3.5b has an additional new feature—a curved line overlaid on the graph. This curve is arepresentation of a normal distribution and allows us to gauge visually how close our sample data are to being normally distributed.
Figure 3.5: Histograms showing (a) frequencies by life satisfaction (quantitative) categories and (b) life satisfaction scores on a continuous scale| (a) |
|
| (b) |
|


Another common use of graphs is to display numeric descriptors in an easy-to-understand visual format. That is, we can apply the sameprinciples for displaying information about our sample frequencies to displaying the typical scores in the sample. If we refer back to our sampledata in Table 3.5, we have information about ethnicity and gender but also about reports of daily stress and life satisfaction. Thus, a naturalquestion to ask is whether there are gender or ethnic differences in these two variables. Figure 3.6 displays a clustered bar graph, displaying themean level of life satisfaction in each group of participants. One thing that jumps out is that males appear to report more life satisfaction than females, as seen by the fact that the red bars are always higher than the gold bars. We can also see some variation in satisfaction levels byethnicity: African-American males (45) seem to report slightly more satisfaction than European American males (42).
Figure 3.6: Clustered bar graph displaying life satisfaction scores by gender andethnicity 
These particular data are fictional, of course; but even if our graph were displaying real data, we would want to be cautious in ourinterpretations. One reason for caution is that this represents a descriptive study. We might be able to state which demographic groups reportmore life satisfaction, but we would be unable to determine the reasons for the difference. Another, more important reason for caution is thatvisual presentations can be misleading, and we would need to conduct statistical analyses to discover the real patterns of differences.
The best way to appreciate this latter point is to see what happens when we tweak the graph a little bit. Our original graph in Figure 3.6 is afair representation of the data: The scale starts at zero, and the y-axis on the left side increases by reasonable intervals. But if we were trying towin an argument about gender differences in happiness, we could always alter the scale, as shown in Figure 3.7. These bars represent the sameset of means, but we have compacted the y-axis to show only a small part of the range of the scale.
That is, rather than ranging from 0 to 50, this misleading graph ranges from 28 to 45, in increments of 1. To the uncritical eye, this appears toshow an enormous gender difference in life satisfaction; to the trained eye, this shows an obvious attempt to make the findings seem moredramatic. Any time you encounter a bar graph that is used to support a particular argument, always pay close attention to the scale of theresults: Does it represent the actual range of the data, or is it compacted to exaggerate the differences? Likewise, any time you create a graphto display results, it is your responsibility as a researcher to ensure that the graph accurately represents the data.
Figure 3.7: Clustered bar graph altered to exaggerate the differences 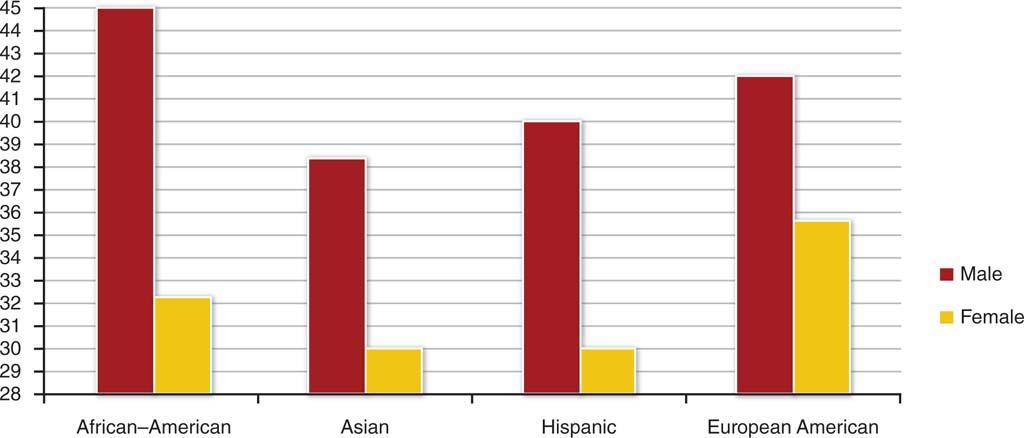
Summary
In this chapter, we have focused on qualitative and descriptive research designs, the latter being the first of three specific designs covered in thecontinuum of control. As discussed, qualitative methods differ from descriptive methods, with the latter allowing for the utilization of eitherqualitative, quantitative, or mixed-method approaches. Qualitative methods have minimal researcher control and are used to thoroughly explainor understand an event, situation, or phenomenon in great detail. On the other hand, the primary goal of descriptive designs is to describeattitudes and behavior, without any pretense of making causal claims. One common feature of both qualitative and descriptive designs is thatthey are able to assess behaviors that occur in their natural environment, or at least in something very close to it. Thus, this chapter firstcovered three qualitative designs and then three types of descriptive research: ethnographic, phenomenological, and grounded theory studies,and case studies, archival research, and observational research, respectively. Because each of the descriptive methods discussed has the goal ofdescribing attitudes, feelings, and behaviors, each one can be used from either a quantitative or a qualitative perspective; thus, they wereseparated from qualitative designs that utilize only qualitative techniques.
As mentioned previously, all the qualitative designs discussed are used to explore, explain, and understand events or situations in great detail.Thus, the goal of qualitative inquiry is to understand and explain the personal experiences of the participants from their perspective and in theirown environment. In qualitative research, only qualitative methods are applied.
In descriptive designs, such as a case study, the researcher studies an individual unit (such as a single person, group, or event) in great detailover a period of time. This approach is often used to study special populations and to gather detailed information about rare phenomena.Unlike qualitative designs, case studies can include either qualitative, quantitative, or mixed-method approaches to data collection. On the onehand, case studies represent one of the lowest points on our continuum of control, owing to the lack of a comparison group and the difficultyof generalizing from a single case. On the other hand, case studies are a valuable tool for beginning to study a phenomenon in depth. Wediscussed the example of Phineas Gage, who suffered severe brain damage and showed drastic changes in his personality and cognitive skills.Although it is difficult to generalize from the specifics of Gage's experience, this case helped to inspire more than a century's worth of researchinto the connections among mind, brain, and behavior.
Archival research involves drawing new conclusions by analyzing existing sources of data. This approach is often used to track changes over timeor to study things that would be impossible to measure in a laboratory setting. For example, we discussed Phillips's study of copycat suicides,which he conducted by matching newspaper coverage of suicides to subsequent spikes in fatality rates. There would be no practical or ethicalway to study these connections other than by examining the patterns as they occurred naturally. Archival studies are still relatively low on ourcontinuum of control, primarily because the researcher does not have much control over how the data are collected. In many cases, analyzingarchives involves a process known as content analysis—that is, developing a coding strategy to extract relevant information from a broadercollection of content. Content analysis involves a three-step process: identifying the most relevant archives, sampling from these archives, andfinally, coding and recording behaviors. For example, Weigel and colleagues studied race relations on television by sampling a week's worth ofprime-time programming and recording the screen time dedicated to portraying different races.
Observational research involves directly observing behavior and recording observations in a systematic way. This approach is well suited to awide variety of research questions, provided that the variables can be directly observed. That is, one can observe what people do but not whythey do it. In exchange for giving up access to internal processes, the researcher gains access to unfiltered behavioral responses—especiallywhen finding ways to observe people unobtrusively. We discussed three main types of observational research. Structured observation involvescreating a standardized situation, often in a laboratory setting, and tracking people's responses. Naturalistic observation involves observingbehavior as it occurs naturally, often in its real-world context. Participant observation involves having the researcher take part in the sameactivities as the participants in order to gain greater insight into their private behaviors. All three variations go through a similar three-stepprocess as archival research: Choose a hypothesis, choose a sampling strategy, and then code and record behaviors.
This chapter next covered principles for describing data in both visual and numeric form. To move toward conducting statistical analyses, it isalso useful to summarize data in numeric form. We discussed two categories of numeric summaries: central tendency and dispersion. Measuresof central tendency (i.e., mean, median, and mode) provide information about the "typical" score in a dataset, whereas measures of dispersion(i.e., range, variance, and standard deviation) provide information about the distribution of scores around the central tendency—that is, they tellus how typical the typical score is. We then covered the process of translating scores into standard scores (aka, z-scores), which expressindividual scores in terms of standard deviations. This technique is useful for comparing results from different studies that used differentmeasures.
Finally, we discussed guidelines for visual presentation. If you remember one thing from this section, it should be that the sole purpose of visualinformation is to communicate your findings to an audience. Thus, your descriptions should always be accurate, concise, and easy tounderstand. The most common visual displays for summarizing data are bar graphs (for nominal data) and histograms (for quantitative data).Regardless of the visual display you choose, it should represent your data accurately; it is especially important to make sure that the y-axisaccurately represents the range of your data.
5.3 Experimental Validity
Chapter 2 (Section 2.2) discussed the concept of validity, or the degree to which measures capture the constructs that they were designed tocapture. For example, a measure of happiness needs to actually capture differences in people’s levels of happiness. In this section, we return tothe subject of validity in an experimental context. Similar to our earlier discussion, validity refers here to whether the experimental results aredemonstrating what we think they are demonstrating. We will cover two types of validity that are relevant to experimental designs. The first is internal validity, which assesses the degree to which results can be attributed to independent variables. The second is external validity, whichassesses how well the results generalize to situations beyond the specific conditions laid out in the experiment. Taken together, internal andexternal validity provide a way to assess the merits of an experiment. However, each of these has its own threats and remedies, as discussed inthe following sections.
Internal ValidityIn order to have a high degree of internal validity, experimenters strive for maximum control over extraneous variables. That is, they try todesign experiments so that the independent variable is the only cause of differences between groups. But, of course, no study is ever perfect,and there will always be some degree of error. In many cases, errors are the result of unavoidable causes, such as the health or mood of theparticipants on the day of the experiment. In other cases, errors are caused by factors that are, in fact, under the experimenter’s control. In thissection, we will focus on several of these more manageable threats to internal validity and discuss strategies for reducing their influence.
Experimental ConfoundsTo avoid threats to the internal validity of an experiment, it is important to control and minimize the influence of extraneous variables thatmight add noise to a hypothesis test. In many cases, extraneous variables can be considered relatively minor nuisances, as when our moodexperiment was accidentally run in a depressing room. But now, let’s say we ran our study on temperature and mood, and owing to a lack ofcareful planning, we accidentally placed all of the warm-room participants in a sunny room, and the cool-room participants in a windowlessroom. We might very well find that the warm-room participants were in a much better mood. But would this be the result of warmtemperatures or the result of exposure to sunshine? Unfortunately, we would be unable to tell the difference because of a confoundingvariable, or confound (in the case of correlation studies, third variable). The confounding variable changes systematically with the independentvariable. In this example, room lighting would be confounded with room temperature because all of the warm-room participants were alsoexposed to sunshine, and all of the cool-room participants to artificial lighting. This combination of variables would leave us unable todetermine which variable actually had the effect on mood. The result would be that our groups differed in more than one way, which wouldseriously hinder our ability to say that the independent variable (the room) caused the dependent variable (mood) to change.

Digital Vision/Thinkstock
The demeanor of the person running astudy may be a confounding variable.
It may sound like an oversimplification, but the way to avoid confounds is to be very careful in designingexperiments. By ensuring that groups are alike in every way but the experimental condition, one cangenerally prevent confounds. This is somewhat easier said than done because confounds can come fromunexpected places. For example, most studies involve the use of multiple research assistants whomanage data collection and interact with participants. Some of these assistants might be more or lessfriendly than others, so it is important to make sure each of them interacts with participants in allconditions. If your friendliest assistant works with everyone in the warm-room group, for example, itwould result in a confounding variable (friendly versus unfriendly assistants) between room and researchassistant. Consequently, you would be unable to separate the influence of your independent variable(the room) from that of the confound (your research assistant).
Selection BiasInternal validity can also be threatened when groups are different before the manipulation, which isknown as selection bias. Selection bias causes problems because these inherent differences might be the driving factor behind the results.Imagine you are testing a new program that will help people stop smoking. You might decide to ask for volunteers who are ready to quitsmoking and put them through a 6-week program. But by asking for volunteers—a remarkably common error—you gather a group of peoplewho are already somewhat motivated to stop smoking. Thus, it is difficult to separate the effects of your new program from the effects of this apriori motivation.
One easy way to avoid this problem is through either random or matched-random assignment. In the stop-smoking example, you could still askfor volunteers, but then randomly assign these volunteers to one of the two programs. Because both groups would consist of people motivatedto quit smoking, this would help to cancel out the effects of motivation. Another way to minimize selection bias is to use the same people inboth conditions so that they serve as their own control. In the stop-smoking example, you could assign volunteers first to one program and thento the other. However, you might run into a problem with this approach—participants who successfully quit smoking in the first program wouldnot benefit from the second program. This technique is known as a within-subject design, and we will discuss its advantages and disadvantagesin the subsection “Within-Subject Designs” in Section 5.4, Experimental Designs.
Differential AttritionDespite your best efforts at random assignment, you could still have a biased sample at the end of a study as a result of differential attrition.The problem of differential attrition (sometimes called the mortality threat) occurs when subjects drop out of experimental groups for differentreasons. Let’s say you’re conducting a study of the effects of exercise on depression levels. You manage to randomly assign people to either 1week of regular exercise or 1 week of regular therapy. At first glance, it appears that the exercise group shows a dramatic drop in depressionsymptoms. But then you notice that approximately one third of the people in this group dropped out before completing the study. Chances areyou are left with those who are most motivated to exercise, to overcome their depression, or both. Thus, you are unable to isolate the effectsof your independent variable on depression symptoms. While you cannot prevent people from dropping out of your study, you can lookcarefully at those who do. In many cases, you can spot a pattern and use it to guide future research. For example, it may be possible todiscover a profile of people who dropped out of the exercise study and use this knowledge to increase retention for the next attempt.
Outside EventsAs much as we strive to control the laboratory environment, participants are often influenced by events in the outside world. These events—sometimes called history effects—are often large-scale events such as political upheavals and natural disasters. The threat to research is that itbecomes difficult to tell whether participants’ responses are the result of the independent variable or the historical event(s). One great exampleof this comes from a paper published by social psychologist Ryan Brown, now a professor at the University of Oklahoma, on the effects ofreceiving different types of affirmative action as people were selected for a leadership position. The goal was to determine the best way toframe affirmative action in order to avoid undermining the recipient’s confidence (Brown, Charnsangavej, Keough, Newman, & Rentfrow, 2000).For about a week during the data collection process, students at the University of Texas, where the study was being conducted, were protestingon the main lawn about a controversial lawsuit regarding affirmative action policies. The result was that participants arriving for this laboratorystudy had to pass through a swarm of people holding signs that either denounced or supported affirmative action. These types of outsideevents are difficult, if not impossible, to control. But, because these researchers were aware of the protests, they made a decision to excludefrom the study data gathered from participants during the week of the protests, thus minimizing the effects of these outside events.
Expectancy EffectsOne final set of threats to internal validity results from the influence of expectancies on people’s behavior. This can cause trouble forexperimental designs in three related ways. First, experimenter expectancies can cause researchers to see what they expect to see, leading tosubtle bias in favor of their hypotheses. In a clever demonstration of this phenomenon, the psychologist Robert Rosenthal asked his graduatestudents at Harvard University to train groups of rats to run a maze (Rosenthal & Fode, 1963). He also told them that based on a pretest, therats had been classified as either bright or dull. As you might have guessed, these labels were pure fiction, but they still influenced the way thatthe students treated the rats. Rats labeled “bright” were given more encouragement and learned the maze much more quickly than rats labeled“dull.” Rosenthal later extended this line of work to teachers’ expectations of their students (Rosenthal & Jacobson, 1968) and found support forthe same conclusion: People often bring about the results they expect by behaving in a particular way.
One common way to avoid experimenter expectancies is to have participants interact with a researcher who is “blind” (i.e., unaware) to thecondition that each participant is in. The researcher may be fully aware of the research hypothesis, but his or her behavior is unlikely to affectthe results. In the Rosenthal and Fode (1963) study, the graduate students’ behavior influenced the rats’ learning speed only because they wereaware of the labels “bright” and “dull.” If these had not been assigned, the rats would have been treated fairly equally across the conditions.
Second, participants in a research study often behave differently based on their own expectancies about the goals of the study. Theseexpectancies often develop in response to demand characteristics, or cues in the study that lead participants to guess the hypothesis. In a well-known study conducted at the University of Wisconsin, psychologists Leonard Berkowitz and Anthony LePage found that participants wouldbehave more aggressively—by delivering electric shocks to another participant—if a gun was in the room than if there were no gun present(Berkowitz & LePage, 1967). This finding has some clear implications for gun control policies, suggesting that the mere presence of gunsincreases the likelihood of violence. However, a common critique of this study is that participants may have quickly clued in to its purpose andfigured out how they were “supposed” to behave. That is, the gun served as a demand characteristic, possibly making participants act moreaggressively because they thought it was expected of them.
To minimize demand characteristics, researchers use a variety of techniques, all of which attempt to hide the true purpose of the study fromparticipants. One common strategy is to use a cover story, or a misleading statement about what is being studied. In Chapter 1 (Section 1.4,Hypotheses and Theories, and Section 1.7, Ethics in Research), we discussed Milgram’s famous obedience studies, which discovered that peoplewere willing to obey orders to deliver dangerous levels of electric shocks to other people. In order to disguise the purpose of the study, Milgramdescribed it to people as a study of punishment and learning. And the affirmative action study by Ryan Brown and colleagues (Brown et al.,2000) was presented as a study of leadership styles. The goal in using these cover stories is to give participants a compelling explanation forwhat they experience during the study and to direct their attention away from the research hypothesis.
Another strategy is to use the unrelated-experiments technique, which leads participants to believe that they are completing two differentexperiments during one laboratory session. The experimenter can use this bit of deception to present the independent variable during the firstexperiment and then measure the dependent variable during the second experiment. For example, a study by Harvard psychologist MargaretShih and colleagues (Shih, Pittinsky, & Ambady, 1999) recruited Asian American females and asked them to complete two supposedly unrelatedstudies. In the first, they were asked to read and form impressions of one of two magazine articles; these articles were designed to make themfocus on either their Asian American identity or their female identity. In the second experiment, they were asked to complete a math test asquickly as possible. The goal of this study was to examine the effects on math performance of priming different aspects of identity. Based onprevious research, these authors predicted that priming an Asian American identity would remind participants of positive stereotypes regardingAsians and math performance, whereas priming a female identity would remind participants of negative stereotypes regarding women and mathperformance. As expected, priming an Asian American identity led this group of participants to do better on a math test than did priming afemale identity. The unrelated-experiments technique was especially useful for this study because it kept participants from connecting theindependent variable (magazine article prime) with the dependent variable (math test).
A final way in which expectancies shape behavior is the placebo effect, meaning that change can result from the mere expectation that changewill occur. Imagine you wanted to test the hypothesis that alcohol causes people to become aggressive. One relatively easy way to do this wouldbe to give alcohol to a group of volunteers (aged 21 and older) and then measure how aggressive they became in response to being provoked.The problem with this approach is that people also expect alcohol to change their behavior, so you might see changes in aggression simplybecause of these expectations. Fortunately, there is an easy solution: Add a placebo control group to your study that mimics the experimentalcondition in every way but one. In this case, you might tell all participants that they will be drinking a mix of vodka and orange juice but onlyadd vodka to half of the participants’ drinks. The orange-juice-only group serves as the placebo control, so any differences between this groupand the alcohol group can be attributed to the alcohol itself.
External ValidityIn order to attain a high degree of external validity in their experiments, researchers strive for maximum realism in the laboratory environment. External validity means that the results extend beyond the particular set of circumstances created in a single study. Recall that science is acumulative discipline and that knowledge grows one study at a time. Thus, each study is more meaningful to the extent that it sheds light on areal phenomenon and to the extent that the results generalize to other studies. Let’s examine each of these criteria separately.
Mundane RealismThe first component of external validity is the extent to which an experiment captures the real-world phenomenon under study. One popularquestion in the area of aggression research is whether rejection by a peer group leads to aggression. That is, when people are rejected from agroup, do they lash out and behave aggressively toward the members of that group? Researchers must find realistic ways to manipulaterejection and measure aggression without infringing on participants’ welfare. Given the need to strike this balance, how real can things get inthe laboratory? How do we study real-world phenomena without sacrificing internal validity?
The answer is to strive for mundane realism, meaning that the research replicates the psychological conditions of the real-world phenomenon(sometimes referred to as ecological validity). In other words, we need not re-create the phenomenon down to the last detail; instead, we aimto make the laboratory setting feel like the real world. Researchers studying aggressive behavior and rejection have developed some ratherclever ways of doing this, including allowing participants to administer loud noise blasts or serve large quantities of hot sauce to those whorejected them. Psychologically, these acts feel like aggressive revenge because participants are able to lash out against those who rejected them,with the intent of causing harm, even though the behaviors themselves may differ from the ways people exact revenge in the real world.
In a 1996 study, Tara MacDonald and her colleagues at Queen’s University in Ontario, Canada, examined the relationship between alcohol andcondom use (MacDonald, Zanna, & Fong, 1996). The authors pointed out a puzzling set of real-world data: Most people reported that theywould use condoms when engaging in casual sex, but the rates of unprotected sex (i.e., having sexual intercourse without a condom) were alsoremarkably high. In this study, the authors found that alcohol was a key factor in causing “common sense to go out the window” (p. 763),resulting in a decreased likelihood of condom use. But how on earth might they study this phenomenon in the laboratory? In the authors’words, “even the most ambitious of scientists would have to conclude that it is impossible to observe the effects of intoxication on actualcondom use in a controlled laboratory setting” (p. 765).
To solve this dilemma, MacDonald and colleagues developed a clever technique for studying people’s intentions to use condoms. Participantswere randomly assigned to either an alcohol or placebo condition, and then they viewed a video depicting a young couple that was faced withthe dilemma of whether to have unprotected sex. At the key decision point in the video, the tape was stopped and participants were askedwhat they would do in the situation. As predicted, participants who were randomly assigned to consume alcohol said they would be morewilling to proceed with unprotected sex. While this laboratory study does not capture the full experience of making decisions about casual sex,it does a nice job of capturing the psychological conditions involved.
Generalizing ResultsThe second component of external validity is the extent to which research findings generalize to other studies. Generalizability refers to theextent to which the results extend to other studies, using a wide variety of populations and a wide variety of operational definitions (sometimesreferred to as population validity). If we conclude that rejection causes people to become more aggressive, for example, this conclusion shouldideally carry over to other studies of the same phenomenon, using different ways of manipulating rejection and different ways of measuringaggression. If we want to conclude that alcohol reduces intentions to use condoms, we would need to test this relationship in a variety ofsettings—from laboratories to nightclubs—using different measures of intentions.
Thus, each study that we conduct is limited in its conclusions. In order for your particular idea to take hold in the scientific literature, it must be replicated, or repeated in different contexts. These replications can take one of four forms. First, exact replication involves trying to re-createthe original experiment as closely as possible in order to verify the findings. This type of replication is often the first step following a surprisingresult, and it helps researchers to gain more confidence in the patterns. The second and much more common method, conceptual replication,involves testing the relationship between conceptual variables using new operational definitions. Conceptual replications would include testingour aggression hypotheses using new measures or examining the link between alcohol and condom use in different settings. For example,rejection might be operationalized in one study by having participants be chosen last for a group project. A conceptual replication might take adifferent approach: operationalizing rejection by having participants be ignored during a group conversation or voted out of the group. Likewise,a conceptual replication might change the operationalization of aggression by having one study measure the delivery of loud blasts of noise andanother measure the amount of hot sauce that people give to their rejecters. Each variation studies the same concept (aggression or rejection)but uses slightly different operationalizations. If all of these variations yielded similar results, this would provide further evidence of theunderlying ideas—in this case, that rejection causes people to be more aggressive.
The third method, participant replication, involves repeating the study with a new population of participants. These types of replication areusually driven by a compelling theory as to why the two populations differ. For example, you might reasonably hypothesize that the decision touse condoms is guided by a different set of considerations among college students than among older, single adults. Finally, constructivereplication re- creates the original experiment but adds elements to the design. These additions are typically designed to either rule outalternative explanations or extend knowledge about the variables under study. In our rejection and aggression example, you might test whethermales and females respond the same way or perhaps compare the impact of being rejected by a group versus an individual.
Internal Versus External ValidityWe have focused on two ways to assess validity in the context of experimental designs. Internal validity assesses the degree to which results canbe attributed to independent variables; external validity assesses how well results generalize beyond the specific conditions of the experiment.In an ideal world, studies would have a high degree of both of these. That is, we would feel completely confident that our independent variablewas the only cause of differences in our dependent variable, and our experimental paradigm would perfectly capture the real-worldphenomenon under study.
In reality, though, there is often a trade-off between internal and external validity. In MacDonald and colleagues’ study on condom use(MacDonald et al., 1996), the researchers sacrificed some realism in order to conduct a tightly controlled study of participants’ intentions. InBerkowitz and LePage’s (1967) study on the effect of weapons, the researchers risked the presence of a demand characteristic in order to studyreactions to actual weapons. These types of trade-offs are always made based on the goals of the experiment. To give you a better sense ofhow researchers make these compromises, let’s evaluate three fictional examples.
Scenario 1: Time Pressure and StereotypingDr. Bob is interested in whether people are more likely to rely on stereotypes when they are in a hurry. In a well-controlled laboratoryexperiment, participants are asked to categorize ambiguous shapes as either squares or circles, and half of these participants are given a shorttime limit to accomplish the task. The independent variable is the presence or absence of time pressure, and the dependent variable is theextent to which people use stereotypes in their classification of ambiguous shapes. Dr. Bob hypothesizes that people will be more likely to usestereotypes when they are in a hurry because they will have fewer cognitive resources to carefully consider all aspects of the situation. Dr. Bobtakes great care to have all participants meet in the same room. He uses the same research assistant every time, and the study is alwaysconducted in the morning. Consistent with his hypothesis, Dr. Bob finds that people seem to use shape stereotypes more under time pressure.
The internal validity of this study appears high—Dr. Bob has controlled for other influences on participants’ attention span by collecting all of hisdata in the morning. He has also minimized error variance by using the same room and the same research assistant. In addition, Dr. Bob hascreated a tightly controlled study of stereotyping through the use of circles and squares. Had he used photographs of people (rather thanshapes), the attractiveness of these people might have influenced participants’ judgments. But here’s the trade-off: By studying the socialphenomenon of stereotyping using geometric shapes, Bob has removed the social element of the study, thereby posing a threat to mundanerealism. The psychological meaning of stereotyping shapes is rather different from the meaning of stereotyping people, which makes this studyrelatively low in external validity.
Scenario 2: Hunger and MoodDr. Jen is interested in the effects of hunger on mood; not surprisingly, she predicts that people will be happier when they are well fed. Shetests this hypothesis with a lengthy laboratory experiment, requiring participants to be confined to a laboratory room for 12 hours with very fewdistractions. Participants have access to a small pile of magazines to help pass the time. Half of the participants are allowed to eat during thistime, and the other half is deprived of food for the full 12 hours. Dr. Jen—a naturally friendly person—collects data from the food-deprivationgroups on a Saturday afternoon, while her grumpy research assistant, Mike, collects data from the well-fed group on a Monday morning. Herindependent variable is food deprivation, with participants either not deprived of food or deprived for 12 hours. Her dependent variable consistsof participants’ self-reported mood ratings. When Dr. Jen analyzes the data, she is shocked to discover that participants in the food-deprivationgroup were much happier than those in the well-fed group.
Compared with our first scenario, this study seems high on external validity. To test her predictions about food deprivation, Dr. Jen actuallydeprives her participants of food. One possible problem with external validity is that participants are confined to a laboratory setting during thedeprivation period with only a small pile of magazines to read. That is, participants may be more affected by hunger when they do not haveother things to distract them. In the real world, people are often hungry but distracted by paying attention to work, family, or leisure activities.But Dr. Jen has sacrificed some external validity for the sake of controlling how participants spend their time during the deprivation period. Thelarger problem with her study has to do with internal validity. Dr. Jen has accidentally confounded two additional variables with her independentvariable: Participants in the deprivation group have a different experimenter and data are collected at a different time of day. Thus, Dr. Jen’ssurprising results most likely reflect the fact that everyone is in a better mood on Saturday than on Monday and that Dr. Jen is more pleasant tospend 12 hours with than Mike is.
Scenario 3: Math Tutoring and Graduation RatesDr. Liz is interested in whether specialized math tutoring can help increase graduation rates among female math majors. To test her hypothesis,she solicits female volunteers for a math skills workshop by placing flyers around campus, as well as by sending email announcements to allmath majors. The independent variable is whether participants are in the math skills workshop, and the dependent variable is whetherparticipants graduate with a math degree. Those who volunteer for the workshop are given weekly skills tutoring, along with informal discussiongroups designed to provide encouragement and increase motivation. At the end of the study, Dr. Liz is pleased to see that participants in theworkshops are twice as likely as nonparticipants to stick with the major and graduate.
The obvious strength of this study is its external validity. Dr. Liz has provided math tutoring to math majors, and she has observed a differencein graduation rates. Thus, this study is very much embedded in the real world. But, as you might expect, this external validity comes at a cost tointernal validity. The biggest flaw is that Dr. Liz has recruited volunteers for her workshops, resulting in selection bias for her sample. Peoplewho volunteer for extra math tutoring are likely to be more invested in completing their degree and might also have more time available todedicate to their education. Dr. Liz would also need to be mindful of how many people drop out of her study. If significant numbers ofparticipants withdrew, she could have a problem with differential attrition, so that the most motivated people stayed with the workshops. Onerelatively easy fix for this study would have been to ask for volunteers more generally, and then randomly assign these volunteers to take part ineither the math tutoring workshops or a different type of workshop. While the sample might still have been less than random, Dr. Liz would atleast have had the power to assign participants to different groups.
A Note on Qualitative Research Validity and ReliabilityAs discussed in Chapter 3, the validity of a quantitative study hinges on whether the experimental results demonstrate what we think they aredemonstrating; reliability refers to whether the experimental results will yield the same or similar results in other experiments. The concepts ofvalidity and reliability in qualitative research do not carry the same meanings as they do in quantitative research, nor is the goal to generalizethe results to individuals, sites, or places outside of those under study. As Creswell (2009) notes, qualitative validity “means the researcherchecks for the accuracy of the findings by employing certain procedures, while qualitative reliability indicates that the researcher’s approach isconsistent across different researchers and different projects” (p. 190). Because qualitative research does not include experimental results,numerical output, and data analyses, many qualitative researchers argue that they must evaluate the quality of their results differently and focusmore on the trustworthiness or overall worth of their data. Thus, they ask, are the findings worthy of attention? And, how do you evaluatethem?
To evaluate the trustworthiness or the validity and reliability of qualitative studies, Guba and Lincoln (1994) proposed the following alternativecriteria outlined in Table 5.2 that are utilized by many qualitative researchers.
| Table 5.2: Criteria for evaluating quantitative research and qualitative research | |
| Criteria for evaluating quantitative research | Alternative criteria for evaluating qualitative research |
| Internal validity
| Credibility
|
| External validity
| Transferability
|
| Objectivity
| Confirmability
|
| Reliability
| Dependability
|
There have been lengthy debates about the value of including alternative sets of criteria for judging qualitative research. Although the criteriafor evaluating validity and reliability in quantitative and qualitative research may seem similar and appear to be mere relabeling of concepts, itshould be noted that the procedures utilized to assess them are not. For example, to ensure validity in qualitative studies, researchers employone or more of the following strategies:
Triangulation: Using multiple sources of data collection to build justification for themes. If multiple sources of data confirm themes, thisprocess can be considered to add to the validity of the study.
Member checking: Asking participants to review the final report and confirm whether the descriptions or themes are accurate.
Providing rich, thick descriptions: Describing in detail the setting, participants, and procedures. This process can add to the validity of thefindings.
Clarifying researcher bias: Self-reflections on any bias the researcher brings to the study helps create an open and honest report.
Presenting negative or discrepant information: The researcher discussing any information that runs counter to the themes.
Peer debriefing: Utilizing peer debriefers that review and ask questions about the study.
Spending prolonged time in the field: Spending long periods of time in the field allows the researcher to develop in-depth understandings ofthe phenomenon of interest. The more experience a researcher has with participants in their natural setting, the more valid the findings willbe.
External auditors: Employing an independent reviewer who is not familiar with the research or project who can provide an objectiveassessment of the study.
To determine whether qualitative research approaches are consistent or reliable, researchers must first ensure that all steps of the proceduresare documented thoroughly. Gibbs (2007) suggests the following strategies:
Checking transcripts: The researcher checks written transcripts against tape-recorded information to ensure that mistakes were not madeduring transcription.
Ensuring codes are stable: Verifying that a shift in the meaning of codes did not occur during the process of coding. This is accomplished byconstantly comparing data with codes and providing detailed descriptions of the codes.
Coordinating communication: The researcher communicates the analyses to coders through regular documented meetings.
Cross-checking codes: The researcher cross-checks codes developed by other researchers and compares the results with his or her own.


