The Solar Cycle Directions: You may work individually, or in a group of size up to four people. If you work in a group turn in one project for the whole group. Identify all variables, include units wh
Name(s)__________________
Math 142 – Summer 2019
The Solar Cycle
Directions: You may work individually, or in a group of size up to four people. If you work in a group turn in one project for the whole group. Identify all variables, include units when appropriate. Use complete sentences and explain your reasoning. If your best fit curve in question 4 is not correct the project will be returned to you and will not be graded until that portion of the project is done correctly.
Part I – The Solar Cycle
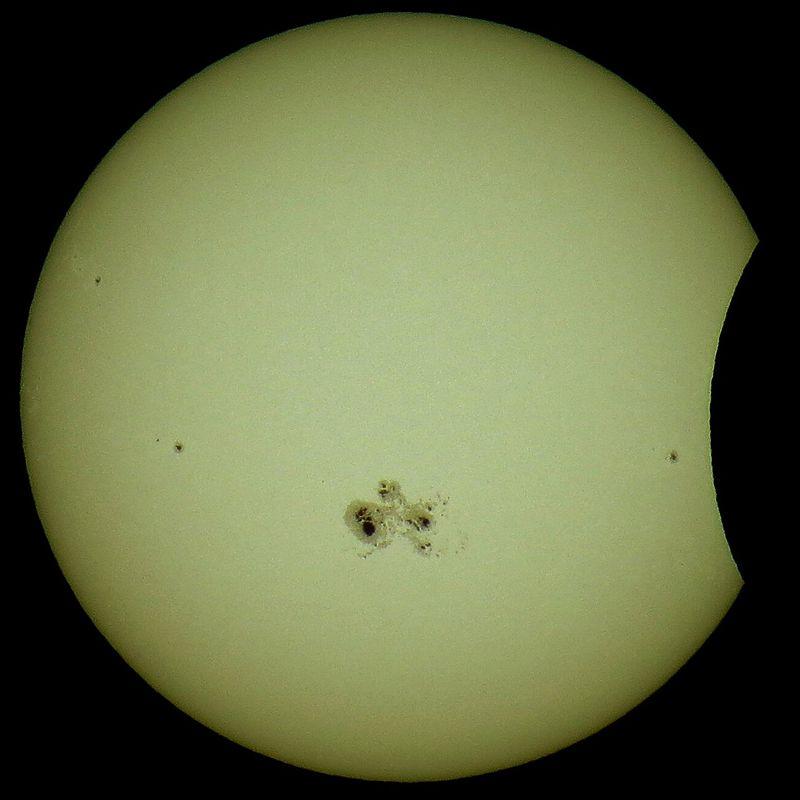
Sunspots are temporary visible spots on the surface of the sun. Sunspots have a periodic variation that has a period of about 11 years. To learn more about sunspots you can watch this NOVA documentary online.
http://tinyurl.com/Math141SunspotVideo
In the table below is record of the average number of sunspots detected from 1965 to 2007
Source: Wikipedia
| Year | Average number of sunspots | Year | Average number of sunspots | Year | Average number of sunspots | Year | Average number of sunspots | Year | Average number of sunspots |
| 1965 | 15.1 | 1975 | 15.5 | 1985 | 18 | 1995 | 17.5 | 2005 | 29.8 |
| 1966 | 47 | 1976 | 12.6 | 1986 | 13.4 | 1996 | 8.6 | 2006 | 15.2 |
| 1967 | 93.8 | 1977 | 27.5 | 1987 | 29.4 | 1997 | 21.5 | 2007 | 7.5 |
| 1968 | 105.9 | 1978 | 92.5 | 1988 | 100.2 | 1998 | 64.3 |
|
|
| 1969 | 105.5 | 1979 | 155.4 | 1989 | 157.6 | 1999 | 93.3 |
|
|
| 1970 | 104.5 | 1980 | 154.6 | 1990 | 142.6 | 2000 | 119.6 |
|
|
| 1971 | 66.6 | 1981 | 140.5 | 1991 | 145.7 | 2001 | 111 |
|
|
| 1972 | 68.9 | 1982 | 115.9 | 1992 | 94.3 | 2002 | 104 |
|
|
| 1973 | 38 | 1983 | 66.8 | 1993 | 54.6 | 2003 | 63.7 |
|
|
| 1974 | 34.5 | 1984 | 45.7 | 1994 | 29.9 | 2004 | 40.4 |
|
|
Table 1 – Source: wolframalpha.com
1) Create a scatterplot for the sunspot data, include a proper title for your graph and label both your axes. Copy and paste your scatterplot into the space below. Do not include a trendline in this scatterplot.
2) From the scatterplot in part 1) estimate all the years in which there was a minimum of solar activity.
3) From the scatterplot in part 1) estimate all the years in which there was a maximum of solar activity.
4) Create a scatterplot with a best fit curve for the sunspot data. Estimate values for A, B, C, and D and then use the ‘Calculate Regression’ tool to find the Best curve. Include a proper title and label your axes. Copy and paste below.
5) Write down the equation for the best fit curve. Identify variables used, include units, round values to the nearest hundredth.
6) Using the best fit curve what is the average number of sunspots?
7) What does the model predict the period of sunspot activity is? Round your answer to the nearest hundredth.
8) Solar scientists have numbered each solar cycle. For example the solar cycle that began in about 1975 is solar cycle 21. The one that began in about 1986 is solar cycle 22. We are presently in solar cycle 24 which began in 2008. According to your model in what year will solar activity reach a maximum?
9) Use your model to predict the number of sunspots in that year.
10) Solar cycle 24 has been described as “the weakest in 100 years.” and “off to a sputtering start”. Use the data in the table below to explain why solar cycle 24 is described in this way.
Hint: You might want to use your model from earlier to predict the average number of sunspots for each year listed below.
You can read more about this by reading the following article.
http://tinyurl.com/Math141SunspotArticle
| Year | Average number of sunspots |
| 2008 | 2.9 |
| 2009 | 3.1 |
| 2010 | 16.5 |
| 2011 | 55.7 |
| 2012 | 57.7 |
| 2013 | 65 |
| 2014 | 79 |
Table 2 – Source: wolframalpha.com


