hi all, in the below attached file you can see a statistics question, solve it by applying the correct method, you have to do only 3rd question in the paper and please look into the inflation and co2
Assignment Specifications
This assignment aims at Understand various qualitative and quantitative research methodologies and techniques, and other general purposes are:
Explain how statistical techniques can solve business problems
Identify and evaluate valid statistical techniques in a given scenario to solve business problems
Explain and justify the results of a statistical analysis in the context of critical reasoning for a business problem solving
Apply statistical knowledge to summarize data graphically and statistically, either manually or via a computer package
Justify and interpret statistical/analytical scenarios that best fits business solution
Assignment Structure should be as the following:
![]() This is an applied assignment. Students have to show that they understand the principles and techniques taught in this course. Therefore students are expected to show all the workings, and all problems must be completed in the format taught in class, the lecture notes or prescribed text book. Any problems not done in the prescribed format will not be marked, regardless of the ultimate correctness of the answer.
This is an applied assignment. Students have to show that they understand the principles and techniques taught in this course. Therefore students are expected to show all the workings, and all problems must be completed in the format taught in class, the lecture notes or prescribed text book. Any problems not done in the prescribed format will not be marked, regardless of the ultimate correctness of the answer.
(Note: The questions and the necessary data are provided under “Assignment and Due date” in the Blackboard.)
Instructions:
Your assignment must be submitted in WORD format only!
When answering questions, wherever required, you should copy/cut and paste the Excel output (e.g., plots, regression output etc.) to show your working/output.
Submit your assignment through Safe-Assign in the course website, under the Assignments and due dates, Assignment Final Submission before the due date.
You are required to keep an electronic copy of your submitted assignment to re-submit, in case the original submission is failed and/or you are asked to resubmit.
Please check your Holmes email prior to reporting your assignment mark regularly for possible communications due to failure in your submission.
Important Notice:
All assignments submitted undergo plagiarism checking; if found to have cheated, all involving submissions would receive a mark of zero for this assessment item.
Please read below information carefully and respond all questions listed. Question 1
The planet may be threatened by climate change due to unsustainable activities, possibly caused by burning fossil fuels (petroleum, natural gas and coal) that produce carbon dioxide (CO2). The table stored in file CO2 EMISSIONS.XLSX (in the course website) lists the top 15 producers of CO2 (millions of metric tonnes) from fossil fuels in 2009 and 2013. Using this data, answer the questions below.
(4 Marks)
(a) Use an appropriate graphical technique to compare the amount of CO2 emissions (in millions of metric tonnes) in 2009 and 2013, broken down by the producer countries. (1 mark)
(b) Use an appropriate graphical technique to compare the percentage value of the amount of CO2 emissions (in %) in 2009 and 2013, broken down by the producer countries. (1 mark)
(c) Comment your observations in parts (a) and (b). (2 marks)
Question 2.
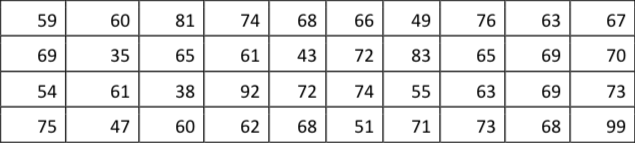
The amount of time (in seconds) needed for assembly-line workers to complete a weld at a car assembly plant in Adelaide was recorded for 40 workers. (8 Marks)
Construct a frequency distribution and a relative frequency distribution for the data. (2 marks)
Construct a cumulative frequency distribution and a cumulative relative frequency
distribution for the data.
c. Plot a relative frequency histogram for the data.
Construct an ogive for the data.
What proportion of the data is less than 65?
What proportion of the data is more than 75?
Use following class intervals to answer the above questions
(2 marks) (1 mark) (1 mark) (1 mark) (1mark)
| Classes | Frequency |
Relative Frequency | Cumulative Frequency |
Cumulative Relative Frequency |
| 35 - 44 | ||||
| 45 - 54 | ||||
| 55 - 64 | ||||
| 65 - 74 | ||||
| 75 - 84 | ||||
| 85 - 94 | ||||
| 95 - 104 |
Question 3. (18 Marks)
Because inflation reduces the purchasing power of the dollar, investors seek investments that will provide protection against inflation; that is, investments that will provide higher returns when inflation is higher. It is frequently stated that ordinary shares provide just such a hedge against inflation. The annual Australian inflation rate (as measured by percentage changes in the consumer price index) and the annual All-Ordinaries Index from 1995 to 2015 are stored in file INFLATION.XLSX (in the course website).
Using EXCEL, answer below questions:
Using an appropriate graphical descriptive measure (relevant for time series data) describe the
two variables. (1 mark)
Use an appropriate plot to investigate the relationship between RATE OF INFLATION and ALL- ORDINARIES INDEX. Briefly explain the selection of each variable on the X and Y axes and why?
(2 marks)
Prepare a numerical summary report about the data on the two variables by including the summary measures, mean, median, range, variance, standard deviation, and coefficient of variation, smallest and largest values, and the three quartiles, for each variable.
(3 marks)
Calculate the coefficient of correlation (r) between RATE OF INFLATION and ALL-ORDINARIES INDEX. Then, interpret it. (2 marks)
Estimate a simple linear regression model and present the estimated linear equation. Then,
interpret the coefficient estimates of the linear model.
Determine the coefficient of determination R2 and interpret it.
Test the significance of the relationship at the 5% significance level.
What is the value of the standard error of the estimate (se). Then, comment on the fitness of
the linear regression model? (1 mark)
(4 marks) (2 marks)
(3 marks)
Marking criteria
| Marking criteria | Weighting |
| 1. CO2 Emission analysis:
| 4 marks 1 mark 1 mark 2 marks |
| 2. Analysis of time of assembly:
| 8 marks 2 marks 2 marks 1 mark 1 mark 2 marks |
| 3. Estimation and testing significance level:
| 18 marks 1 mark 2 marks 3 marks 2 marks 4 marks 2 marks 3 marks 1 mark |
| TOTAL Weight | 30% |
| Assessment Feedback to the Student: |
Marking Rubric
| Excellent | Very Good | Good
| Satisfactory
| Unsatisfactory | |
| CO2 Emission analysis | Demonstration of outstanding knowledge on descriptive techniques | Demonstration of very good knowledge on descriptive techniques | Demonstration of good knowledge on descriptive techniques
| Demonstration of basic knowledge on descriptive techniques
| Demonstration of poor knowledge on descriptive techniques |
| Analysis of time of assembly | Demonstration of outstanding knowledge on descriptive measures | Demonstration of very good knowledge on descriptive measures | Demonstration of good knowledge on descriptive measures
| Demonstration of basic knowledge on descriptive measures
| Demonstration of poor knowledge on descriptive measures |
| Estimation and testing significance level | Demonstration of outstanding knowledge on correlation and regression analysis | Demonstration of very good knowledge on correlation and regression analysis | Demonstration of good knowledge on correlation and regression analysis
| Demonstration of basic knowledge on correlation and regression analysis
| Demonstration of poor knowledge on correlation and regression analysis |


