I need help with the following questions, 10 references and word limit of 1500 words SWOT, PESTEL, Perceptual Map must be created as well. Did Amazon succeed in China? What did it learn?Did Amazon ma

![]()
![]()


case W94C01 August 1, 2014
Revised November 7, 2019
Amazon in Emerging Markets
In the spring of 2014, Amazon.com, Inc. (“Amazon”), saw its chief competitor in China, Alibaba Group, file documents with the SEC for an initial public offering (IPO) that could be one of the largest in history. Meanwhile, its main competitor in Brazil, MercadoLibre, sustained an approximate 40% loss in stock price despite several years of profitability. On top of this, its two chief competitors in India, Flipkart and Snapdeal, formed separate mergers with other related firms. The intense battle for control of a country’s e-wallet was nothing new to Diego Piacentini, senior vice president of International Consumer Business, and Jeff Bezos, founder and CEO. In 2013, their decision to launch Amazon.in marked Amazon’s eleventh country-specific portal after nineteen years of operation. China was Amazon’s first emerging market website, and India only its third.
Compared to its experience in China and Brazil, Amazon followed a different business model and
What led to the differing approaches and which, if any, of Amazon’s emerging markets’ strategies and investments would succeed? The case starts by examining Amazon’s entry into India and then turns to Amazon’s experience in China and Brazil.
strategy in India.
Amazon’s International ExpansionIncorporated in 1994, Amazon had evolved from a small online vendor of books and other information-
“customer-centric” company serving consumers,
based products in 1997, into a global with operations in
twenty-two countries.
Amazon’s international
sellers, and developers when it acquired
Bookseller, Ltd. (bookseller.co.uk) in the United Kingdom and Telebook, Inc. (telebuch.de) in Germany. These two sites gave rise to what became Amazon.co.uk and Amazon.de, respectively. It was early in 2000, during this initial European expansion, that Amazon hired Piacentini, who had been Apple’s general manager for Europe. Since his hiring, Amazon launched nine other country-specific websites in Italy, France, Spain, Japan, China, Mexico, Brazil, Canada, and Australia. (See Appendix A for Amazon’s country-specific web pages.) In several other countries, from Costa Rica to South Africa to Australia, Amazon located customer service, software development, fulfillment, data centers, or back office operations.
expansion started in 1998
In 2013, Amazon’s Germany, UK, and Japan sites accounted for 85% of total international revenues
Overall, Amazon’s international markets (excluding its Canadian site) made up 40% of
Published by WDI Publishing, a division of the William Davidson Institute (WDI) at the University of Michigan.
of $30.0 billion.
©2014 Amy Nguyen-Chyung and Elliot Faulk. This case was written by Elliot Faulk and Amy Nguyen-Chyung (Assistant Professor of Strategy) of the Ross School of Business at the University of Michigan. It was created as a basis for class discussion, not to illustrate either the effective or ineffective handling of a business situation. Secondary research was performed to accurately portray information about the featured organization and to extrapolate the decision points presented in the case; however, company representatives were not involved in the creation of this case.
Amazon’s total revenues of $74.4 billion (see Appendix B1 for consolidated financial results). However, despite a growth of 14% in net sales between 2012 and 2013, Amazon’s international business had seen a period of declining rate of growth since 2011 (see Appendices B2 and B3 for a geographic breakout). Would this declining growth rate foreshadow what was to come for Amazon’s international markets, or be merely water under the bridge according to Bezos and Amazon’s “marathon” mind-set of emphasizing customer service and long-term gains in sacrifice of short-term profits?
The Indian E-Commerce MarketOn June 5, 2013, Amazon officially entered the Indian market with the launch of Amazon.in. Although the Indian government had liberalized its strict foreign direct investment (FDI) laws in September 2012, the resulting regulations still forbid foreign multi-brand retailers from having over 51% ownership.1 As a result, Amazon could not replicate its US business of selling its own products in addition to serving as a selling platform for third-party vendors. In India, Amazon would only be able to function as a pure marketplace that would connect domestic sellers to buyers in the market. For Amazon, these FDI considerations would be only the first hurdle encountered in the nascent but fast-growing Indian e-commerce market.
According to World Bank data, as of 2013 India had approximately 189.1 million internet users (15.1% of the 1.25 billion population) compared with only 60.7 million (5% of the population) just four years earlier (see Appendix C for a list of Internet users per 100 population for select countries; see Appendix D for mobile cellular subscriptions). The Associated Chambers of Commerce and Industry of India estimated the Indian e-commerce industry at $16 billion in 2013, a large increase from estimates of $8.5 billion in 2012 and $2.5 billion in 2009.2 On the other hand, Forrester Research reported that Indian e-commerce was worth only $1.6 billion in 2012 after online travel sales were factored out of the estimates.3 Fast growth was less debated; analysts from the Indian retail consultancy Technopak believed that the country’s e-commerce industry could grow 61 times over the next decade.4
Overall, mom-and-pop stores dominated India’s half-trillion-dollar retail market. According to Deloitte’s India group, organized retail in India comprised only 17% of the market versus over 85% of the market in the US.5 Moreover, in addition to stringent laws on FDI, India still had considerable import duties on certain foreign products. According to the International Chamber of Commerce, India ranked 64th out of 75 countries for overall trade and FDI openness in 2013.6
In terms of transportation infrastructure, many of India’s roads were in poor condition and overly congested. Even on the better roads, such as between New Delhi in the north and Mumbai on the western coast, driving took almost twice the amount of time it took to drive the same distance in the US, according to Google Maps. In addition, nearly 70% of India’s population lived in remote rural areas, which in some cases had limited access to major highways. Thirty-three percent of villages in India, primarily in the northern states, lacked all-weather roads, making them almost inaccessible during the monsoon season.7 Furthermore, addresses in India were notoriously difficult to find due to non-sequential numberings, lack of street signs, and narrow, winding streets. It was instead commonplace in India to describe locations with directions via landmarks.8 Retailers had tended to prefer commercial airfreight for delivery, but this option had led to increased delivery costs and a high risk of merchandise being offloaded to accommodate passengers.9
Over the past few years, India had experienced a series of major power failures allegedly due to a shoddily constructed electricity infrastructure. For example, in soaring temperatures in New Delhi on June 10, 2014, 16 million people were subject to power blackouts due to unmanageable demand.10 This power failure came only two years after a record-breaking electricity crisis in 2012 in which 600 million people
2
were left without power for two days.11
India also still had a highly impoverished population. In 2013, Organisation for Economic Cooperation and Development (OECD) researchers estimated that 42% of India’s 1.24 billion people lived on less than
$1.25 a day, reflective of its $4,000 GDP per capita.12,13 Much of India’s growth in computing and consumer spending, however, came from a growing middle class of over 160 million people.14 The Brookings Institution predicted that India’s middle class consumption would surpass that of the US by the year 2030.15 However, despite a growing population heavily involved in spending, cash payments remained dominant over credit or debit card payments in day-to-day commerce in India. Business Today cited that people in India averaged only six non-cash payments each year. As a result, a “cash on delivery” system had become widely accepted in the e-tailing space and accounted for roughly 50% to 80% of all e-commerce payments.16
Competition in IndiaThe Indian e-commerce market’s promise of rapid growth had already attracted several players, domestic and international, to the Indian e-tailing scene. Some of the largest in terms of revenue and market share included Flipkart, Snapdeal, and eBay.
Flipkart
In 2007, two ex-Amazon employees, Sachin Bansal and Binny Bansal (no relation), launched Flipkart, which became the leading domestic e-tailing company in India (see Appendix E). Having copied some of Amazon’s business model throughout the country, Flipkart’s founders had been able to capture 4.9% of the very fragmented Indian e-commerce market by 2013 (Amazon held 1.6% and eBay 1.2%).17 Flipkart found quick success by developing its own logistics network and by adopting the “cash on delivery” payment option in 2010 in order to adjust to the cash-centric payment habits of Indian consumers. Since its launch in 2007, Flipkart had been dependent primarily on funding from venture capital (VC) firms.
Flipkart used the VC investments to expand its product offerings through a string of acquisitions in the Indian online retail space. Its acquisitions included weRead (2010), a book review and recommendation site; Mime360 (2011), an Indian site for digital music, e-books, and online games; Chakpak.com’s catalogue of movies and film ratings (2011); and Letsbuy.com (2012), an Indian online electronics retailer.18 At the end of 2013, Flipkart was valued at approximately $1.6 billion and was selling 100,000 products daily to its 13.22 million unique visitors.19
In May 2014, Flipkart acquired a 100% stake in online fashion retailer Myntra.com for an estimated
$370 million, its largest acquisition. Following the acquisition, Flipkart raised $210 million from Russian venture capitalist Yuri Milner and his firm DST Global.20 This investment added to the nearly $550 million it had previously received from groups such as Dragoneer Investment Group, Accel Partners, Vulcan, Morgan Stanley, Tiger Global, Iconiq Capital, Naspers, and Sofina Capital.21,22 Similar to Flipkart, Myntra heavily relied on funding from private investors including Accel Partners, Tiger Global, Sofina Capital, and Premji Invest. With the acquisition, Flipkart became the largest online fashion retailer in India.23
Snapdeal
Although they founded Snapdeal.com as an e-coupon website in 2010 (similar to Groupon in the US), Kunal Bahl and Rohit Bansal decided to revamp their site after a trip to China in 2011 during which they witnessed the dynamic growth of the Chinese e-tailing giant Alibaba. Using Alibaba for inspiration, Bahl and Bansal re-created Snapdeal.com in 2011 as an e-commerce marketplace (see Appendix F). Valued at
$1 billion in June 2014, Snapdeal had relied heavily on funding from its investors.24 The largest of these
3
was American e-commerce firm eBay, which invested $50 million in 2013 and was the largest investor in Snapdeal’s approximately $134 million round of funding in the first quarter of 2014.25 Other investors in this round included Intel Capital, Saama Capital, Nexus Venture Partners, Bessemer Venture Partners, and Kalaari Capital.26
Attempting to replicate Alibaba’s business model in India, Snapdeal offered 5 million products from over 30,000 sellers—much more than Flipkart’s network of 3,000 sellers as of May 2014. Similar to Alibaba’s logistics strategy, Snapdeal opened 40 fulfillment centers in 15 cities across India where it stored and shipped sellers’ products for a fee.27 Snapdeal planned to open 35 more within the next year.28
Snapdeal had also expanded its reach through several acquisitions. In 2012 it acquired Esportbuy.com, an online sporting goods retailer, and in 2013 it bought Shopo.in, an online handicraft marketplace. In order to stake its position in the high-margin online fashion retailing space, Snapdeal acquired Doozton.com in May 2014, a site that helped users discover popular fashion trends and lifestyle products.29
eBay
The American e-commerce giant entered the Indian market in 2005 after it acquired Baazee.com, India’s largest online marketplace at the time, for $50 million plus acquisition costs.30 Initially, eBay took a cautious approach in India while other e-commerce startups were aggressively investing to grab market share early on. In its infancy, eBay.in concentrated only on selling gift items such as chocolates and flowers from third- party traders.31 However, eBay since invested heavily to ensure its place as a leader in the Indian e-commerce market. By 2014, eBay India listed over 2,000 specific product categories from 45,000 traders.32,33 Similar to its model in the US, eBay was functioning solely as a marketplace in India, and offered products for auction as well as for a set price.
Much of its investment had gone into logistics options for its traders as well as into other companies. In 2012, eBay.in launched its PowerShip program option, in which eBay coordinated shipping for its member traders among its logistics partners in India—FedEx, BlueDart, DTDC, and Aramex. For set PowerShip rates, eBay’s logistics partners would pick up products packaged in eBay packing material directly from sellers and ship them to the buyers. With PowerShip, sellers could offer prepayment or cash-on-delivery options to be handled by their eBay Paisapay account, an escrow account that transfered money from buyer to seller after receipt of the purchased goods.
As mentioned previously, eBay’s investments included funding Indian e-commerce retailer Snapdeal. In return for its investment, eBay acquired permission to access Snapdeal’s 20-million-person user database as well as its logistics network.34
Moving forward, eBay looked to more partnerships with Indian sellers and incorporating them into its global trading network. In April 2014, eBay partnered with the Confederation of All Indian Traders (CAIT) to be the recommended platform for small Indian sellers looking to market their products on the national and international stages. eBay planned to add more traders to its membership list and offer them the option of international export for their products.35 By partnering with eBay, member traders could sell their merchandise through any of eBay’s 39 global sites to over 145 million active eBay users worldwide.36
Amazon’s India ApproachPrior to Amazon.in, Amazon already had thousands of employees in India performing customer service, software development and back office functions.37 In addition, in February 2012, Diego Piacentini and Amazon’s VP for International Expansion, Amit Agarwal, led Amazon’s investment in Junglee.com, an online
4
product review site that listed over 10 million products, toward the Indian market in 2012. Through the site, customers could compare reviews, pricing, and shipping details for each product listed.38 Piacentini and Agarwal were determined to formulate a strategy that would best leverage their learnings from nearly a decade of operations in China. Rather than making piecemeal investments over their first few years of operation, Piacentini and Agarwal decided to invest big from the start. They recognized that their competitors had a head start of five to nine years to adapt their businesses to the Indian market, and so Amazon needed to develop a competitive strategy.
Agarwal brought local knowledge and deep company experience to this endeavor. The Mumbai-born new vice president and country manager for Amazon India had joined Amazon in 1999 after earning his computer science degrees at the Indian Institute of Technology-Kanpur and Stanford University. He rose through the ranks from software development at Amazon headquarters to managing director of Amazon’s Development Center in Bangalore and then “Shadow and Technical Advisor” to Bezos.39
After the launch of Amazon.in in June 2013, much of Amazon’s initial Indian investments went to its core strength in logistics, as the company learned to adjust to the difficulties of distribution in India. Just prior to the launch, Amazon had completed the construction of a 150,000-square-foot fulfillment center just outside Mumbai. It later built one of similar size in Bangalore to serve southern India. With so much of India’s retail space dominated by local mom and pop shops, Agarwal and Piacentini decided to offer a “Fulfillment by Amazon” program in which Amazon enabled sellers to store their products at Amazon distribution centers and have Amazon handle the delivery for a fee. Eventually three out of every four orders on Amazon.in were fulfilled by Amazon.40
Agarwal and Piacentini decided to further differentiate Amazon from its Indian competitors by being the first e-tailer to offer next-day shipping for the orders it fulfilled. In order to compensate for the difficulty of locating addresses and to ensure timely delivery of its sellers’ products, Agarwal also added PIN codes (postal codes similar to ZIP codes in the US) and landmark fields on the delivery information page, reaching 21,000 PIN codes versus other retailers’ 12,000.41
Since Amazon would function solely as a marketplace in India, seller acquisition was a major priority for establishing market share. To attract domestic sellers across India, Piacentini and Agarwal offered sellers a promotion for a two-year membership agreement with the first year free of cost. After the first year, members were only required to pay Rs 499 ($8.27) per month in addition to Amazon’s commission charge of 4%-8% (4% for most electronics, 8% for watches and jewelry) and a Rs 10 ($0.17) “closing fee” for each transaction. Piacentini and Agarwal also stressed educating Indian sellers on Amazon’s platform and services. For small retailers with little to no online selling experience, Amazon offered a pilot service called “Mainstreaming Sellers/SMEs” to teach them how to transact online, catalogue their products, and accept online payments. In addition, sellers could utilize the “Fulfillment by Amazon” option to give responsibility for delivery to Amazon.42
In order to attract buyers from India’s growing number of Internet users, Piacentini and Agarwal offered multiple incentives for those who referred customers to or bought products from Amazon.in. In the beginning stages of operation in India, Amazon offered free shipping for the orders it fulfilled. It also offered permanent free shipping on all orders fulfilled by Amazon over Rs 499.43 Piacentini and Agarwal also introduced the Amazon Associates Program, which offered a commission to all online publishers (e.g. bloggers, businesses, authors, nonprofits, and personal websites) who directed their viewers to Amazon.in via a link to a “contextually relevant product.” If a purchase was made, the commission for referrals would range between 5% for consumer electronics and 10% for most other product categories, such as books and movies, and would cover all purchases made by the referred customer.44 Piacentini and Agarwal also
5
attracted buyers by replicating the cash-on-delivery option it had offered in China. In addition to online payment options such as credit cards, debit cards, and bank transfers, cash-on-delivery would allow Amazon customers to pay for their merchandise at the time of delivery. However, this option had tended to delay payments to Amazon up to one week.45
E-retailers in India appeared to be fighting to offer the largest selection of products at the lowest cost and with the fastest delivery times. Just after Amazon introduced next day delivery, Flipkart announced that it would be offering “In-a-Day Guarantee” delivery. Soon after, both companies began to offer same day delivery in a number of cities if ordered before a certain time.46
Amazon and its competitors had further attempted to differentiate themselves through unique mobile features and by entering exclusive distribution agreements with producers. For example, in February 2014, Flipkart signed an agreement with Motorola to sell its new phone, Moto G, only online through Flipkart’s site. In addition, Snapdeal agreed to be the sole Indian seller of Oplus Technology’s (Taiwanese) newest tablet in January 2014. Snapdeal co-founder and CEO Bahl stated that 90% of its product offerings were unique to Snapdeal, concentrating the most on the “unorganized segment in categories like apparel.”47 Snapdeal further differentiated itself by being the first to launch its site in both Hindi and Tamil.48
Amazon was also competing for market share among mobile users. According to Avendus Capital, India had 67 million smartphone users in 2013, a figure that could reach 382 million by 2016.49 As of 2014, Snapdeal claimed that 30% of its business came from smartphone users; eBay claimed 31%.50,51 To cater to this demand, most e-tailers had developed comprehensive mobile apps for their sites, even offering exclusive deals to those who made purchases on their phone. Moving into India’s fiscal year 2015 (April 1-March 31), some of Amazon’s competitors had expressed interest in acquiring a mobile technology enterprise in order to exploit this market opportunity.52
While Amazon waited for its rivals to take the lead on the e-tailing side for many years in India, the firm had entered China a decade earlier in 2004.
The World’s Largest Market: ChinaIn 2002, China had an estimated 27 million online consumers,53 rising to over 80 million in 2004.54 By 2014, the country was expected to reach 650 million online consumers.55 In 2002, China’s e-commerce market was valued at an estimated $1.3 billion, growing to over $16 billion by 2005-2006.56 At the start of 2014, China’s e-commerce market was valued at over $300 billion, expected to reach $540 billion by 2015. Growing at a compound annual rate of nearly 70%, China’s e-commerce market was scheduled to surpass the US as the largest e-commerce market in the world.57 According to World Bank data, China recorded 621.7 million internet users in 2013, approximately 46% of China’s 1.4 billion population and more than double the amount of internet users in the US at 266.2 million.
At an investor conference in 2013, Jack Ma, founder and chairman of Chinese e-commerce giant Alibaba Group, remarked, “In other countries, e-commerce is a way to shop, in China it is a lifestyle.”58 Chinese consumers were known to use social media extensively. According to McKinsey & Co., China’s 300 million users of social media spent more than 40% of their time on the Internet browsing blogs and social networking sites.59 Using popular social media sites such as WeChat and Weibo, Chinese users often accessed and posted product reviews, got buy/don’t buy product advice from “key opinion leaders” and friends, and saw advertisements of featured products from retailers.60
Chinese consumers were also becoming very active shoppers on mobile devices. With the largest volume of mobile e-commerce transactions in the world, China expected purchases via mobile device to reach $41.4 billion by 2015 from only $7.8 billion in 2012. This volume of mobile transactions attested to the Chinese consumer’s craving for fast shopping at any time of the day.61
China, however, did not represent a consistent market from region to region. KPMG International highlighted that customers in “tier-1” cities such as Beijing and Shanghai varied drastically in their shopping preferences and purchasing decisions from other consumers in smaller markets, such as Xi’an and Fuzhou. Sales volume for higher-end goods, such as cars, jewelry, and handbags, was much greater in Shanghai than in smaller coastal and inland cities. This trend was also true for brand loyalty, as consumers in China’s smaller markets favored differed products and tended to stress current fashion styles less than those in larger cities.62
By operating in a communist-led country, Amazon faced limitations on its operations that it had not encountered in its prior international experience. Chinese law regulated and restricted Amazon’s internet content, as well as its sale of any media-related products or services. In addition, Chinese law demanded that Amazon’s website, www.amazon.cn, be operated by a Chinese-owned corporation in order to comply with local ownership laws.63
Competition in China, 2004-2014While the Chinese online commerce market had consolidated significantly by 2014, the competitive landscape in the nascent market of 2004 was far more fragmented. All the players started with somewhat different business models that would continue to evolve. Central competitors in the early battle for Chinese market share included EachNet, Alibaba, Joyo.com, and Jingdong.
EachNet
EachNet was founded in Shanghai in 1999 by two Chinese entrepreneurs who had studied in the US: Bo Shao and Haiyin Tan.64 As of 2002, EachNet had 3.5 million registered users and was the leading person- to-person online trading site in the growing Chinese e-commerce market when eBay announced its intent to acquire a 33% stake of the company for $30 million.65 Under CEO Meg Whitman, eBay completed the transaction in 2003 and brought in a German country manager and a technology executive from the US. Neither understood the language or the local market. eBay invested an additional $100 million into the entity which was soon renamed eBay EachNet.66
Alibaba
Founded in 1999 by Chinese entrepreneur Jack Ma, Alibaba.com was launched in Hangzhou as an online forum for Chinese manufacturers to sell their products to domestic and overseas buyers. In 2002, Alibaba made its first profit, only $1. It “badly trailed” EachNet, according to the Wall Street Journal.67 By 2014, Alibaba Group with Jack Ma as chairman operated several web services including two of China’s largest e-commerce sites, Taobao.com and Tmall.com. However, faced by competition from eBay EachNet, little- known Alibaba’s quest for market share in the early 2000s was not easy.
In response to the eBay-Eachnet acquisition, Alibaba launched Taobao.com in 2003 as a way of preventing eBay from taking away its customer base.68 Taobao.com began as a marketplace and auction site that would later serve as a pure marketplace which connected merchants of all sizes to a network of millions of consumers. According to Helen Wang, author of The Chinese Dream, given that Chinese users at the time were unfamiliar with internet auctions, only 10% of Taobao’s product listings were available for auction, as opposed to 40% for eBay EachNet. Alibaba also offered longer and more flexible listing periods
7
for its auction products. Furthermore, to cater to China’s 300 million cell phone users (compared with only 90 million internet users at the time), Taobao offered its buyers and sellers the option of communicating via instant messaging and voice mail.69
The marketing strategies of the two companies also reflected their different knowledge and experience. eBay purchased exclusive rights to internet ads on major Chinese portals Sina, Sohu, and Netease whereas Ma blitzed the major TV channels with Taobao ads. At the time, many more Chinese were in front of their TVs than on the Internet. Most importantly, Taobao charged no commission fees to its sellers. Signing-up was very easy—even five minutes was enough to register on the site.70 Many of these differences appealed to the Chinese and helped Taobao to quickly overtake eBay Eachnet. In 2013, Taobao recorded 7 million sellers and over 800 million product offerings.71
Tmall, was Alibaba’s next offering. It was a business-to-consumer marketplace designed for bigger merchants and major labels, such as Nike and Gap. Each business selling products on Tmall was required to pay a deposit to set up its business, and was then charged a fee on each transaction. Created in 2008 as part of Taobao.com, Tmall.com officially became its own website in June 2011.72 By the end of 2012, Tmall had attained a 51.5% share of the Chinese business-to-consumer marketplace (see Appendix G for Alibaba’s Tmall and Taobao web pages).73
In 2013, combined transaction volume for the two sites equaled $240 billion, more than the transactions for Amazon and eBay combined (approximately $100 billion and $75 billion, respectively); (see Appendices H1 and H2 to compare Alibaba with major western Internet companies). According to The Wall Street Journal, Alibaba controlled nearly 80% of all Chinese e-commerce in 2013.74
Alibaba Group filed for an IPO in the US on May 6, 2014, with analysts valuing the company at over
$150 billion. Alibaba sought to be listed on the New York Stock Exchange (NYSE) with the ticker, BABA. As of the time of the case, Alibaba had since filed various amendments throughout the summer in response to requests for additional information for SEC approval. The expected IPO date had been pushed back to September 2014.
Joyo.com
Founded in 2000, Joyo.com was the largest online retailer of books, music and videos in China as of 2004, according to Amazon.75 Joyo also sold software, toys and gifts, among other products.
Jingdong Mall / JD.com
Other major competition came from Jingdong Mall (JD.com), formerly known as 360buy.com. Reportedly founded in 1998, its marketplace went online in 2004. In 2012, Jingdong Mall had a market share of 22.7%, making it China’s third largest internet retailer.76 Total merchandise sales reached $16.39 billion in 2013.77,i In March 2014, TenCent Holdings, a leader in online games and mobile messaging (through WeChat) agreed to acquire at 15% stake in JD.com for $215 million in a move to enter the rapidly growing mobile commerce market.78
Amazon’s China Experience
Amazon first entered China in 2004 by acquiring Joyo.com for $75 million. Amazon’s entry came at a time when China’s GDP was growing at a rate near 10% each year, accompanied by a small but growing internet user base of 94.6 million people (7.3% of the 1.3 billion person population) and an e-commerce
i Gross merchandise volume for retailers is different from net sales. Based on Jingdong’s 2014 20-f filing with the SEC, the firm reported approximately 6.6 billion USD in net sales based on the 6.31 official average annual exchange rate of RMB per USD.
8
market estimated to be worth $8.6 billion. In 2004, Joyo.com had 5.2 million registered users as well as projected revenues of $15 million.79 Within six months of the acquisition, a little earlier than expected from the time of due diligence, the management team had departed.80
For its first year in China, Amazon operated under Joyo.com’s domain name, mainly offering books, DVDs, and CDs to its customers in China’s largest cities of Beijing, Shanghai, and Guangzhou. Despite the departure of Joyo’s management team, the transition was seamless to the Chinese consumer.81 By 2007, Amazon had increased its product offerings thirty-two fold, offering electronics, baby products, beauty care products, and watches. With $26.1 million in sales in the last quarter of 2006, Joyo.com’s market share had reached 12%.82 In 2007 Amazon changed the domain name from joyo.com to amazon.cn, with Joyo Amazon as its name in Chinese. Amazon was renamed Amazon China in 2011, pronounced in Mandarin as “Yamashi.”83 Amazon finally launched its Kindle e-reader in China in June 2013.
Amazon strived to replicate the acclaimed customer experience it delivered to consumers in developed markets. For instance, Piacentini liked to tell an anecdote about the delivery of a new Harry Potter book in Chinese on its publication date in 2005. Amazon China delivered 5,000 books on schedule. However, when a competitor undercut Amazon’s price by 5 RMB (less than $1), Amazon issued a refund for the difference to the customers, who were not expecting a refund. This gained Amazon much positive publicity, and Piancentini hailed it to be the firm’s best public relations and marketing move in China for the year.84
Amazon had to drastically adjust its logistics operation in China. To start, Amazon used Joyo.com’s three existing fulfillment centers located in Beijing, Shanghai, and Guangzhou. From there, Amazon distributed orders to its other thirty delivery centers across the country.85 Piacentini and his team eventually expanded Amazon’s distribution network by creating fifteen fulfillment centers across China, its largest logistics operation outside the US. Different than its US model at the time, Amazon played a large role in the last leg of the delivery process. Amazon started to handle deliveries in-house by hiring employees to transport the merchandise the “last mile” to the customer. Instead of vans or trucks, however, intra-city deliveries in China were commonly carried out on bicycles or scooters due to China’s tendency for traffic-filled roads.86 When Amazon entered China in 2004, overnight deliveries had only recently been made possible due to new developments in truck, rail, and aerial transport.87
Amazon initially faced payment challenges similar to those it encountered later on in India. In the early 2000s, many Chinese customers were reluctant to pay in advance for their purchases with credit card. As a result, Amazon’s China team adopted Joyo.com’s cash-on-delivery option. Furthermore, Amazon began to offer free shipping on all purchases through its site. Joyo.com also offered product recommendations to customers based on their past purchase history, something that had proved successful in other Amazon markets.88
Despite its early investment and efforts, Amazon’s share of the Chinese business-to-consumer e-commerce market stood at a mere 3.5% at the end of 2012.89 However, as noted by Piacentini, Amazon had at least made its way into the top five e-commerce websites by January 2014.90 On the one hand, Piacentini knew there had been mistakes in China, but on the other hand, the glass was half full.
Another Emerging Market: BrazilAmazon launched Amazon Brazil (home to Amazon’s namesake) in December 2012, just six months before launching its India site. Brazil joined China and India as one of the world’s largest emerging markets, ranked seventh in the world by GDP at $2.2 trillion. In 2013, 51.6% of Brazilians used the Internet, or 103.4
9
million people out of a population of 200.4 million. According to McKinsey & Company, 85% of Brazil’s population would have access to mobile broadband by 2015, a population that had increasingly used mobile applications to purchase products and follow retailers.91
Despite a record 7.5% GDP growth rate in 2010, however, Brazil experienced an economic downturn from the end of 2013 through the first half of 2014. Brazil’s GDP growth rate reached a mere 2.3% in 2013, and was expected to grow by only 1.5% through 2014. Low retail sales, declining commodity exports, and reduced production levels served as evidence of the downturn.92 At the start of 2014, Brazil’s e-commerce market was valued at over $11 billion.93
In 2014, Brazil ranked 116th in the World Bank’s “Ease of Doing Business” measure, ranking as low as 159th out of 189 countries in ease of paying taxes (see Appendix I). According to the professional services firm PricewaterhouseCoopers, it took approximately 2,600 hours for a firm to comply with Brazil’s complex tax code, mainly due to its complicated consumption tax system. In 2014, Brazil had a total tax rate of 68.3%.94 Labor laws and regulations in Brazil were also very costly due to requirements for employers to pay for meals, transportation, health insurance, 30 days of vacation, and mandatory bonuses for their employees.95
Parts of Brazil also varied drastically in terms of transportation infrastructure. Many major rail, road, and port construction projects that were started in the 1970s during the “Economic Miracle” period in Brazil had been left unfinished across the country. For example, over half of the Trans-Amazonian Highway, intended to connect the eastern and western regions of Brazil in 1972, remained unpaved as well as impassable during rainy seasons. According to Brazil’s National Confederation of Transportation, 69% of Brazil’s roads remained in poor condition, often narrow and dotted with potholes.96 Brazil’s poor roadways, inefficient railways, and crowded airspace had led the World Economic Forum to rank Brazil 104th out of 142 countries measured in terms of “quality of overall infrastructure.” Brazil ranked behind both China (69th) and India (86th).97
Competition in Latin AmericaMercadoLibre
Launched in 1999 by Stanford MBA student Marcos Galperin, MercadoLibre (MercadoLivre in Portuguese and “free market” in English) served as Brazil’s largest e-commerce marketplace for buyers and sellers (see Appendix J for MercadoLibre’s Brazilian homepage). With headquarters in Buenos Aires, Argentina, MercadoLibre offered country-specific sites in 13 countries throughout Latin America and in Brazil and Portugal. Benefiting from first-mover advantage in Brazil in October 1999, MercadoLibre’s marketplace had
20.2 million unique buyers and 5.1 million unique sellers by 2013. MercadoLibre’s Brazil site accounted for 43.7% of its total revenues of $472.6 million, reaching $206.4 million in 2013, 14.9% higher than the year before (see Appendices K1 and K2 for MercadoLibre financial results).98
In addition to its marketplace, MercadoLibre offered MercadoPago, an escrow-based payment service that was one of the firm’s most important revenue streams—enabling payments for transactions in an environment where credit card penetration was limited. Other business lines include MercadoEnvios, a shipping solution for sellers, Advertising Services, Classified, and Online Stores Service, which gave sellers the ability to create their own web stores integrated with the MercadoLibre marketplace.99
From its infancy, MercadoLibre had primarily relied on investors for funding its business initiatives. In addition to its start-up investments, MercadoLibre obtained two rounds of funding, one totaling $7.6 million in November 1999 and another totaling $46.7 million in May 2000, before raising $290 million in its IPO (NASDAQ: MELI) in 2007. With the IPO funds, MercadoLibre bought out the remaining operations of its rival DeRemate.
10
Although MercadoLibre reached an all-time high in its stock price on October 18, 2013, trading at
$141.77 after a period of triple-digit return on invested capital (ROIC), its stock dropped about 40% by May 2014 partly due to political economic instability in its Argentine and Venezuelan markets (see Appendix L for MELI stock information). As of June 2014, MercadoLibre’s ROIC was still high at 73% (compared with 17% for eBay and 4% for Amazon); however, increased competition resulting from the expired non-compete arrangement with eBay and the recent entry of Amazon could challenge MercadoLibre’s growth and market share in Brazil.100
Saraiva
Saraiva, Brazil’s largest bookstore chain and leading book publisher, was another competitor for Amazon. Selling books, CDs, and DVDs from its internet site (www.livrariasaraiva.com.br), Saraiva offered 15,000 Portuguese e-book titles in 2013 as opposed to Amazon’s 13,000.101 Perhaps in response, Amazon added 15,000 more e-books at the start of 2014. Amazon was rumored to have been in talks to buy Saraiva’s internet business in October 2012, just months before starting its Kindle Store in December. As of 2012, Saraiva refused to sell any of its own published 2,500 e-books to its competition, including Amazon.102
Amazon’s Approach in BrazilFaced with webs of tax codes, labor laws, logistics challenges, and strong competition from established Latin American e-commerce player MercadoLibre, Amazon ultimately launched in Brazil by only introducing its Kindle (e-book) Store. Estimates suggested that Brazilians purchased 435 million books in 2012 valued at
$2 billion.103 However, e-books accounted for only 3% of these sales.104 Upon its launch, Amazon listed 1.4 million e-book titles on its site, 13,000 of which were offered in Portuguese.105 Amazon’s launch of its Kindle Store, however, came only after lengthy negotiations with Brazilian book publishers who wanted control over pricing in fear of Amazon’s aggressive discounting strategies. To date, Amazon had formalized contracts with over thirty book publishers, prominently including the Distribuidora de Livros Digitais (DLD) group whose seven publishers controlled close to 35% of the market and whose demands caused Amazon to delay its entry into the country.106,107 As of February 2014, Amazon had increased its e-book selection to 28,000 titles in Portuguese, Brazil’s national language.108
In addition to its Kindle Store, Amazon introduced its Kindle e-reader in Brazil in February 2014. At the time, Amazon planned to leave logistics to its external partners in Brazil.109 In June 2014, Amazon’s Kindle Paperwhite retailed for R$479 (USD 215.62) on Amazon.com.br, nearly twice its price in the US of $119.110 This significant price difference could most likely be attributed to Brazil’s high duties on electronics imports. Amazon offered customers the option to pay for the Kindle in up to 12 installments, given the predilection for Brazilian consumers to use payment plans for expensive products.111,112 Amazon also offered free shipping on its Kindle products.113 The Kindle may not be the only physical product Amazon would choose to sell moving forward.
Other Markets: Diversity in Geography, Products, and CustomersMost recently, similar to its approach in Brazil, Amazon launched its Kindle Store in Mexico in August 2013 (www.amazon.com.mx), its 12th international expansion as of July 2014.114 On the other side of the globe, Amazon was also making a move. According to Forbes’ Russian language site, Amazon established its first office in Russia, rumored to be headed by Harvard Business School graduate Arkady Vitrouk, director for Kindle Content at Amazon EU.115 With 76.5 million internet users (53.3% of the population) and an e-commerce industry expected to grow to $36 billion by 2015 from only $12 billion in 2012, according to Morgan Stanley, Russia would be an attractive market for internet retailers in the years to come.116 However, Russian laws, political uncertainty, and poor infrastructure would inhibit e-commerce growth in this market.
11
Previously, in 2008, Amazon was rumored to have entered an exclusive distribution agreement with the Saudi Arabian e-commerce firm Taufeer.com to become a part of its e-channel retailers program. Through Taufeer.com, Amazon would be able to sell its products to millions of people across the Middle East.117 According to a March 15, 2009 article in Asharq Al-Awsat, an Arabic international newspaper, Amazon had sent $280 million of merchandise to the Kingdom of Saudi Arabia since 2007.118 However, no mention of such an agreement existed in Amazon’s company records and the Taufeer.com website was defunct as of 2014.
While Piacentini spearheaded Amazon’s international strategy, the rest of Amazon’s leadership continued to focus on developments in new products, services, and logistics. In order to increase its role in logistics, Amazon had tried its own hand at delivery with Amazon Fresh in select cities across the US. It had also been experimenting with 30-minute delivery using drone technology.
In terms of new products and services, Amazon introduced the second generation of the Kindle Paperwhite, the Kindle Fire HDX, and its Amazon Fire Phone in the year leading up to July 2014. Furthermore, Amazon was expanding its Amazon Web Services (AWS) to reach over 190 countries.119 In December 2011, Amazon announced a Sao Paulo Region for AWS (aws.amazon.com/pt/), and later introduced a Beijing Region in December 2013 (amazonaws.cn).120,121 Amazon also catered to AWS customers on the Indian subcontinent by opening edge locations in Chennai and Mumbai in July 2013.122 Through offerings such as AWS and its Kindle Store, it seemed that Amazon’s international strategy could perhaps transcend the domain of physical consumer products.
Whether Amazon would choose to continue its expansion in Latin America, capitalize on Russia’s dynamic e-commerce growth, export its business model to the Middle East, or stay focused on its current markets, the road to success in emerging markets would not be an easy one for Bezos and Piacentini. However, according to Bezos’ oft-repeated mantra, “it’s still Day 1” for Amazon, for every one of its markets around the world.
AcknowledgmentsThe authors thank Nowfal Khadar (MBA, 2014) for his insights in the creation of the India portion of this case.
12
Appendices Appendix AAmazon Country-Specific Web Pages
| Country | Web URL | Launch Year |
| Germany | www.Amazon.de | 1998 |
| United Kingdom | www.Amazon.co.uk | 1998 |
| France | www.Amazon.fr | 2000 |
| Japan | www.Amazon.co.jp | 2000 |
| Canada | www.Amazon.ca | 2002 |
| China | www.Amazon.cn | 2004 |
| Austria | www.Amazon.de1 | 2009 |
| Italy | www.Amazon.it | 2010 |
| Spain | www.Amazon.es | 2011 |
| Brazil | www.Amazon.com.br2 | 2012 |
| India | www.Amazon.in | June 2013 |
| Mexico | www.Amazon.com.mx2 | August 2013 |
| Australia | www.Amazon.com.au2 | November 2013 |
1 Amazon Austria (www.Amazon.at) operates within Amazon Germany (Amazon.de)
2 Web page functions solely as a Kindle Store
Source: “History & Timeline,” Amazon.com, Jul. 2014, Web.
Appendix B1Amazon Consolidated Financial Results ($millions, except per share data)
| Year Ended December 31 | |||||
| 2013 2012 2011 2010 2009 Statements of Operations: | |||||
| Net sales | $ 74,452 | $ 61,093 | $ 48,077 | $ 34,204 | $ 24,509 |
| Income from operations | $ 745 | $ 676 | $ 862 | $ 1,406 | $ 1,129 |
| Net income (loss) | $ 274 | $ (39) | $ 631 | $ 1,152 | $ 902 |
| Basic earnings per share | $ 0.60 | $ (0.09) | $ 1.39 | $ 2.58 | $ 2.08 |
| Diluted earnings per share | $ 0.59 | $ (0.09) | $ 1.37 | $ 2.53 | $ 2.04 |
| Weighted average shares used in computation of earnings per share: | |||||
| Basic | 457 | 453 | 453 | 447 | 433 |
| Diluted | 465 | 453 | 461 | 456 | 442 |
| Statements of Cash Flows: | |||||
| Net cash provided by (used in) operating activities | $ 5,475 | $ 4,180 | $ 3,903 | $ 3,495 | $ 3,293 |
| Purchases of property and equipment, incl. internal-use software and development | (3,444) | (3,785) | (1,811) | (979) | (373) |
| Free cash flow | $ 2,031 | $ 395 | $ 2,092 | $ 2,516 | $ 2,920 |
Source: 2013 Amazon.com Annual Report. 10 Apr. 2014. Web. http://phx.corporate-ir.net/phoenix.zhtml?c=97664&p=irol-reportsannual.
13
Appendix B2Amazon Geographic Break-out of Financial Results ($millions)
| Year Ended December 31 | |||
| 2013 | 2012 | 2011 | |
| Net Sales: | |||
| North America | $ 44,517 | $ 34,813 | $ 26,705 |
| International | 29,935 | 26,280 | 21,372 |
| Consolidated | $ 74,452 | $ 61,093 | $ 48,077 |
| Year-over-year Percentage Growth: | |||
| North America | 28% | 30% | 43% |
| International | 14 | 23 | 38 |
| Consolidated | 22 | 27 | 41 |
| Year-over-year Percentage Growth, excluding effect of exchange rates: | |||
| North America | 28% | 30% | 43% |
| International | 19 | 27 | 31 |
| Consolidated | 24 | 29 | 37 |
| Net Sales Mix: | |||
| North America | 60% | 57% | 56% |
| International | 40 | 43 | 44 |
| Consolidated | 100% | 100% | 100% |
Source: 2013 Amazon.com Annual Report. 10 Apr. 2014. Web. <http://phx.corporate-ir.net/phoenix.zhtml?c=97664&p=irol-reportsannual>.
Appendix B3Amazon Partial Break-out of International Revenues ($millions)
| Year Ended December 31 | |||
| 2013 | 2012 | 2011 | |
| Germany | $10,535 | $8,732 | $ 7,230 |
| Japan | 7,639 | 7,800 | 6,576 |
| United Kingdom | 7,291 | 6,478 | 5,348 |
Source: 2013 Amazon.com Annual Report. 10 Apr. 2014. Web. <http://phx.corporate-ir.net/phoenix.zhtml?c=97664&p=irol-reportsannual>.
14
Appendix CInternet Users (per 100 people)
| Country | 2009 | 2010 | 2011 | 2012 | 2013 |
| Brazil | 39.2 | 40.7 | 45.7 | 48.6 | 51.6 |
| China | 28.9 | 34.3 | 38.3 | 42.3 | 45.8 |
| France | 71.6 | 77.3 | 77.8 | 81.4 | 81.9 |
| Germany | 79.0 | 82.0 | 81.3 | 82.3 | 84.0 |
| India | 5.1 | 7.5 | 10.1 | 12.6 | 15.1 |
| Japan | 78.0 | 78.2 | 79.1 | 86.3 | 86.3 |
| Mexico | 26.3 | 31.1 | 37.2 | 39.8 | 43.5 |
| Russian Federation | 29.0 | 43.0 | 49.0 | 63.8 | 61.4 |
| South Africa | 10.0 | 24.0 | 34.0 | 41.0 | 48.9 |
| Turkey | 36.4 | 39.8 | 43.1 | 45.1 | 46.3 |
| United Arab Emirates | 64.0 | 68.0 | 78.0 | 85.0 | 88.0 |
| United Kingdom | 83.6 | 85.0 | 85.4 | 87.5 | 89.8 |
| United States | 71.0 | 71.7 | 69.7 | 79.3 | 84.2 |
Source: “Internet Users (per 100 people).” Data. World Bank. 2014. Web.
Appendix DMobile Cellular Subscriptions (per 100 people)
| Country | 2009 | 2010 | 2011 | 2012 | 2013 |
| Brazil | 87.5 | 100.9 | 119.0 | 125.0 | 135.3 |
| China | 55.3 | 63.2 | 72.1 | 80.8 | 88.7 |
| France | 92.1 | 91.4 | 94.1 | 97.4 | 98.5 |
| Germany | 126.2 | 106.5 | 109.7 | 111.6 | 119.0 |
| India | 44.1 | 62.4 | 73.2 | 69.9 | 70.8 |
| Japan | 91.3 | 96.8 | 102.0 | 108.7 | 115.2 |
| Mexico | 71.5 | 77.5 | 79.2 | 83.4 | 85.8 |
| Russian Federation | 160.1 | 165.5 | 142.0 | 145.3 | 152.8 |
| South Africa | 91.2 | 97.9 | 123.2 | 130.6 | 147.5 |
| Turkey | 88.1 | 85.6 | 89.4 | 91.5 | 93.0 |
| United Arab Emirates | 138.3 | 129.4 | 131.4 | 149.6 | 171.9 |
| United Kingdom | 124.0 | 123.6 | 123.6 | 124.8 | 123.8 |
| United States | 88.6 | 91.3 | 94.4 | 96.0 | 95.5 |
Source: “Mobile Cellular Subscriptions (per 100 people).” Data. World Bank. 2014. Web.
15
Appendix E Flipkart.com Home Page
Source: Flipkart.com. Jul. 2014. Web.
Appendix F Snapdeal.com Home Page
Source: Snapdeal.com. Jul. 2014. Web.
16
Appendix G Taobao.com and Tmall.com (Alibaba Group)

| Source: Taobao.com. Jul. 2014. Web. | Source: Tmall.com. Jul. 2014. Web. |
Appendix H1
Comparison of Selected Electronic Commerce / Technology Companies


Source: Osawa, Juro, Paul Mozur, and Rolfe Winkler. “Alibaba Flexes Muscles Before IPO.” The Wall Street Journal. 15 Apr. 2014.
17
Appendix H2Comparative Metrics, Selected Electronic Commerce / Technology Companies 2013


 Note: Alibaba total includes Taobao and Tmall only.
Source: Osawa, Juro, Paul Mozur, and Rolfe Winkler. “Alibaba Flexes Muscles Before IPO.” The Wall Street Journal. 15 Apr. 2014.
18
Amazon in Emerging Markets
Appendix I
Ease of Doing Business 2013 (Selected Countries)
19
| Economy | Ease of Doing Business Rank | Starting a Business | Dealing with Construction Permits | Getting Electricity | Registering Property | Getting Credit | Protecting Investors | Paying Taxes | Trading Across Borders | Enforcing Contracts | Resolving Insolvency |
| Singapore | 28 | 12 | |||||||||
| Hong Kong SAR, China | 89 | 19 | |||||||||
| New Zealand | 12 | 45 | 23 | 21 | 18 | 12 | |||||
| United States | 20 | 34 | 13 | 25 | 64 | 22 | 11 | 17 | |||
| Denmark | 40 | 18 | 28 | 34 | 12 | 32 | 10 | ||||
| Malaysia | 16 | 43 | 21 | 35 | 36 | 30 | 42 | ||||
| South Korea. | 34 | 18 | 75 | 13 | 52 | 25 | 15 | ||||
| United Kingdom | 10 | 28 | 27 | 74 | 68 | 10 | 14 | 16 | 56 | ||
| Taiwan, China | 16 | 17 | 31 | 73 | 34 | 58 | 18 | 84 | 16 | ||
| Chile | 34 | 22 | 101 | 43 | 55 | 55 | 34 | 38 | 40 | 64 | 102 |
| South A frica | 41 | 64 | 26 | 150 | 99 | 28 | 10 | 24 | 106 | 80 | 82 |
| Peru | 42 | 63 | 117 | 79 | 22 | 28 | 16 | 73 | 55 | 105 | 110 |
| Colombia | 43 | 79 | 24 | 101 | 53 | 73 | 104 | 94 | 155 | 25 | |
| Mexico | 53 | 48 | 40 | 133 | 150 | 42 | 68 | 118 | 59 | 71 | 26 |
| China | 96 | 158 | 185 | 119 | 48 | 73 | 98 | 120 | 74 | 19 | 78 |
| Brazil | 116 | 123 | 130 | 14 | 107 | 109 | 80 | 159 | 124 | 121 | 135 |
| Argentina | 126 | 164 | 181 | 80 | 138 | 73 | 98 | 153 | 129 | 57 | 97 |
| India | 134 | 179 | 182 | 111 | 92 | 28 | 34 | 158 | 132 | 186 | 121 |
| Nigeria | 147 | 122 | 151 | 185 | 185 | 13 | 68 | 170 | 158 | 136 | 143 |
| Libya | 187 | 171 | 189 | 68 | 189 | 186 | 187 | 116 | 143 | 150 | 81 |
| Central African Republic | 188 | 177 | 156 | 177 | 141 | 109 | 138 | 188 | 185 | 180 | 161 |
| Chad | 189 | 183 | 139 | 149 | 146 | 130 | 157 | 189 | 183 | 171 | 134 |
Source: “Economy Rankings.” Doing Business. The International Finance Corporation and The World Bank. 2014. Web.
Appendix J MercadoLibre Brazil Website (mercadolivre.com)
Source: Mercadolivre.com.br. Jul. 2014. Web.
20
Appendix K1MercadoLibre Consolidated Financial Results
| Years ended December 31, | |||||
| (in millions) | 2013 | 2012 | 2011 | 2010 | 2009 |
| Statement of income data: | |||||
| Net revenues | $ 472.6 | $ 373.6 | $ 298.9 | $ 216.7 | $ 172.8 |
| Cost of net revenues | (130.1) | (98.1) | (72.1) | (46.5) | (36.0) |
| Gross profit | 342.5 | 275.5 | 226.9 | 170.2 | 136.9 |
| Operating expenses: | |||||
| Product and technology development | (40.9) | (28.6) | (23.3) | (15.9) | (12.1) |
| Sales and marketing | (90.5) | (72.0) | (65.0) | (48.9) | (42.9) |
| General and administrative | (57.6) | (45.2) | (38.8) | (30.8) | (25.8) |
| Total operating expenses | (189.0) | (145.9) | (127.1) | (95.6) | (80.9) |
| Income from operations | 153.5 | 129.6 | 99.8 | 74.6 | 56.0 |
| Other income (expenses): | |||||
| Interest income and other financial gains | 10.7 | 11.9 | 9.9 | 4.9 | 2.7 |
| Interest expense and other financial charges | (2.4) | (1.1) | (3.6) | (7.6) | (13.4) |
| Foreign currency gain / (loss) | 1.3 | — | 2.4 | (0.1) | (2.7) |
| Other income (expenses), net | — | (0.2) | 0.1 | — | — |
| Net income before income / asset tax | 163.1 | 140.2 | 108.5 | 71.9 | 42.7 |
| Income / asset tax (expense) | (45.6) | (38.9) | (31.7) | (15.8) | (9.5) |
| Net income | $ 117.5 | $ 101.3 | $ 76.8 | $ 56.0 | $ 33.2 |
| Less: Net Income attributable to Noncontrolling | — | 0.1 | — | — | — |
| Net income available to common shareholders | $ 117.5 | $ 101.2 | $ 76.8 | $ 56.0 | $ 33.2 |
Source: 2013 MercadoLibre Annual Report. 3 Mar. 2014. Web. <http://investor.mercadolibre.com/secfiling.cfm?filingID=1193125-14-78151>
Appendix K2MercadoLibre % of Total Consolidated Revenues by Geographic Market
| Years ended December 31, | |||
| (% of total consolidated net revenues) (*) | 2013 | 2012 | 2011 |
| Brazil | 43.7% | 48.1% | 55.5% |
| Argentina | 25.8% | 23.7% | 19.0% |
| Venezuela | 17.9% | 14.6% | 11.6% |
| Mexico | 6.9% | 7.2% | 7.5% |
| Other Countries | 5.6% | 6.4% | 6.4% |
*Table above may not total due to rounding.
Source: 2013 MercadoLibre Annual Report. 3 Mar. 2014. Web. <http://investor.mercadolibre.com/secfiling.cfm?filingID=1193125-14-78151>
21
Appendix LAmazon (AMZN) vs. MercadoLibre (MELI) Stock Performance
| | |

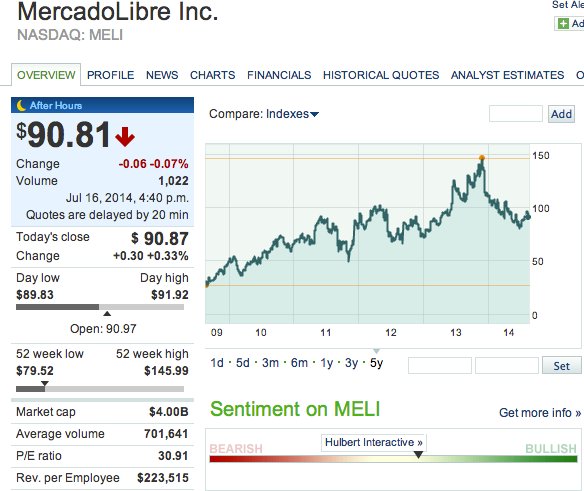
Source: Marketwatch. 16 Jul. 2014.
22
Endnotes1 Julka, Harsimran. “FDI in online retail: Rift arises as MNCs seek 100% FDI, domestic cos insist on partial opening-up.” The Economic Times. 9 Jan. 2014. Web. <http://articles.economictimes.indiatimes.com/2014-01-09/news/46030049_1_100-fdi- partial-opening-up-foreign-direct-investment>.
2 “India’s e-commerce market rose 88% in 2013: Survey.”The Economic Times. 30 Dec. 2013. Web. <http://articles.economictimes. indiatimes.com/2013-12-30/news/45711192_1_e-commerce-market-online-shoppers-survey>.
3 Dharmakumar, Rohin. “Amazon’s Perfect Timing for India.”Forbes India Magazine. 2 July 2013. Web. <http://forbesindia.com/ article/big-bet/amazons-perfect-timing-for-india/35517/1>.
4 Sen, Sunny. “Moth to a Flame: How China helped Amazon tweak its model for success in India.”Business Today. 16 Feb. 2014. Web. <http://businesstoday.intoday.in/story/how-amazon-is-faring-in-e-commerce-online-space-in-india/1/202613.html>.
5 “Changing times. Changing roles: Retail HR gearing up to become a strategic partner.”Deloitte Touche Tohmatsu India Pvt Ltd. 2013. Web. 8 June 2014.<http://www.deloitte.com/assets/Dcom-India/Local%20Assets/Documents/Thoughtware/Retail_ Sector_-_HR.pdf>.
6 “Open Markets Index.”The World Business Organization. International Chamber of Commerce. 2013. Web. 8 June 2014.<http:// www.iccwbo.org/Global-influence/G20/Reports-and-Products/Open-Markets-Index/>.
7 “India Transport Sector.”Transport in South Asia. The World Bank. 2013. Web. 10 June 2014. <http://web.worldbank.org/WBSITE/EXTERNAL/COUNTRIES/SOUTHASIAEXT/
EXTSARREGTOPTRANSPORT/0,,contentMDK:20703625~menuPK:868822~pagePK:34004173~piPK:34003707~theSitePK:579598,00.
html>.
8 Narayanswamy, Harihar. “Despite street-map and address, difficult to find location in India.”The Economic Times. 19 Aug. 2009. Web. <http://articles.economictimes.indiatimes.com/2009-08-19/news/27653360_1_map-postal-service-direct-marketing- industry>.
9 Bose, Nandita. “E-tailers growth ensnared in India’s logistics jungle.”Reuters. 10 June 2014. Web. <http://in.reuters.com/ article/2014/06/10/india-retail-idINKBN0EK1YI20140610>.
10 “Indian protests over power blackouts amid heatwave spread to New Delhi.”Asia: South China Morning Post. 12 June 2014. Web.
<http://www.scmp.com/news/asia/article/1530342/indian-protests-over-power-blackouts-amid-heatwave-spread-new-delhi>.
11 Butkiewicz, Lynann. “India’s Electricity Crisis: Background on the Issues.” The National Bureau of Asian Research. 7 Aug. 2012. Web. <http://www.nbr.org/research/activity.aspx?id=267>.
12 “Special Focus: Inequality in Emerging Economies (EEs).”Divided We Stand: Why Inequality Keeps Rising. OECD. 2011. Web.
<http://www.oecd.org/els/soc/49170475.pdf>.
13 “India.”The World Factbook. Central Intelligence Agency. 2014. Web. <https://www.cia.gov/library/publications/the-world- factbook/geos/in.html>.
14 Varma, Pavan K. “India’s middle class awakes.” The Times of India. 23 Nov. 2013. Web. <http://timesofindia.indiatimes.com/ home/opinion/edit-page/Indias-middle-class-awakes/articleshow/26221440.cms>.
15 Kharas, Homi. “The Emerging Middle Class in Developing Countries.” Brookings Institution. The World Bank, June 2011. Web. <http://siteresources.worldbank.org/EXTABCDE/
Resources/7455676-1292528456380/7626791-1303141641402/7878676-1306699356046/Parallel-Sesssion-6-Homi-Kharas.pdf>.
16 Das, Goutam. “Cash-on-delivery: Necessary Evil.” Business Today. 16 Feb. 2014. Web. <http://businesstoday.intoday.in/story/ cash-on-delivery-impact-on-e-commerce-companies-customers/1/202680.html>.
17 “Flipkart raises $210 million; will utilise funds for acquisitions.”The Economic Times. 26 May 2014. Web. <http://articles. economictimes.indiatimes.com/2014-05-26/news/50099162_1_binny-bansal-iconiq-capital-flipkart>.
18 Hector, Dearton Thomas. “Flipkart snaps up Letsbuy.com.”Business Today. 13 Feb. 2012. Web. <http://businesstoday.intoday.in/ story/flipkart-letsbuy/1/22296.html>.
19 Nair, Radhika P. “Flipkart and Myntra enter final lap in negotiation.”The Economic Times. 14 Apr. 2014. Web. <http://articles. economictimes.indiatimes.com/2014-04-14/news/49126133_1_mukesh-bansal-sachin-bansal-flipkart-and-myntra>.
20 “Flipkart raises $210 million.”
21 Verma, Shweta. “Is Flipkart ready to take on Amazon in India?”CXOtoday.com. 10 Oct. 2013. Web. <http://www.cxotoday.com/ story/is-flipkart-ready-to-take-on-amazon-in-india/>.
22 “Flipkart raises $210 million.”
23 “Flipkart acquires Myntra, gears up to take on Amazon.” The Economic Times. 23 May 2014.<http://articles.economictimes. indiatimes.com/2014-05-23/news/50055305_1_myntra-flipkart-binny-bansal>.
23
24 Rajagopal, Divya. “How Kunal Bahl’s Snapdeal scaled a valuation of $1 billion in two years.”The Economic Times. 20 June 2014. Web.<http://economictimes.indiatimes.com/panache/how-kunal-bahls-snapdeal-scaled-a-valuation-of-1-billion-in-two-years/ articleshow/36867721.cms>.
25 “Why eBay Raised Its Stake In India’s Snapdeal.”Forbes. 4 Mar. 2014. Web. <http://www.forbes.com/sites/ greatspeculations/2014/03/04/why-ebay-raised-its-stake-in-indias-snapdeal/>.
26 “EBay Inc. Makes Strategic Investment in Snapdeal.”eBay Inc. 26 Feb. 2014. Web.<http://blog.ebay.com/snapdeal/>.
27 Chilkoti, Avantika. “India’s Snapdeal seeks to follow Alibaba playbook.”Financial Times. 22 June 2014. Web. <http://www.ft.com/ intl/cms/s/0/ad7388b6-f9cf-11e3-a412-00144feab7de.html>.
28 Gooptu, Biswarup. “Snapdeal plans to acquire up to 4 companies in FY15.”The Economic Times. 29 May 2014. Web. <http:// articles.economictimes.indiatimes.com/2014-05-29/news/50182059_1_kunal-bahl-snapdeal-shopo-in>.
29 Gooptu, Biswarup. “Snapdeal.”
30 “EBay to Acquire India’s Baazee.com.”eBay Inc. 22 June 2004. Web. <http://investor.ebay.com/releasedetail. cfm?ReleaseID=137656>.
31 Bose, Nandita. “eBay shifts gears in India as rivals step up.” Reuters. 27 Apr. 2012. Web. <http://www.reuters.com/ article/2012/04/27/ebay-india-idUSL3E8FO5L120120427>.
32 Batra, Avinder. “eBay India, CAIT pact may help traders grow business by up to 20%.” The Economic Times. 22 Apr. 2014. Web.
<http://articles.economictimes.indiatimes.com/2014-04-22/news/49318874_1_ebay-india-cait-latif-nathani>.
33 “Apparel Fast Facts.” The Company: Online Media Centre. Ebay.in. Undated. Web. Accessed 16 June 2014. <http://pages.ebay.in/ community/aboutebay/news/pressreleases/category/apparel.html>.
34 “Why eBay Raised Its Stake In India’s Snapdeal.”
35 Batra, Avinder.
36 “Retail Exports at eBay India.”eBay Inc. 31 Mar. 2014. Web. <http://pages.ebay.in/community/aboutebay/news/retail-exports- at-ebay-india.html>.
37 Piacentini, Diego. “Customer Focus Builds Global Growth [Entire Talk] - Diego Piacentini from Amazon.” The Entrepreneurial Thought Leaders Lectures. 3 Nov. 2010.Web. <http://ecorner.stanford.edu/authorMaterialInfo.html?mid=2484>
38 Sen, Sunny. 16 Feb. 2014.
39 Agarwal, Amit. LinkedIn. Accessed 7 Aug. 2015 <https://www.linkedin.com/pub/amit-agarwal/0/33/86b>.
40 Sen, Sunny. 16 Feb. 2014.
41 Sen, Sunny. 16 Feb. 2014.
42 Sen, Sunny. 16 Feb. 2014.
43 Rai, Anand. “Amazon.in cheapest to buy books with promotional shipping policy, Flipkart cheaper for heavy book buyers.”Techcircle.in. 6 June 2013. Web. <http://techcircle.vccircle.com/2013/06/06/amazon-in-cheapest-to-buy-books-with- promotional-shipping-policy-flipkart-cheaper-for-heavy-book-buyers/>.
44 “Amazon introduces ‘Amazon Associates Program’ in India.”Press Releases. Amazon.in. 8 July 2013. Web. <http://www.amazon.in/ gp/feature.html?ie=UTF8&docId=1000734323>.
45 Sen, Sunny. 16 Feb. 2014.
46 Sen, Sunny. 16 Feb. 2014.
47 Nair, Radhika P. “Amazon to use own logistics network for product delivery in 2 years.” The Economic Times. 18 Feb. 2014. Web.
<http://articles.economictimes.indiatimes.com/2014-02-18/news/47451273_1_amazon-india-flipkart-sachin-bansal>.
48 Nair, Radhika P. 18 Feb. 2014.
49 “India’s mobile internet: The revolution has begun.” Avendus Capital. September 2013. Web. <http://www.avendus.com/Files/ Fund%20Performance%20PDF/Avendus_Report-India’s_Mobile_Internet-2013.pdf>.
50 Nair, Radhika P. 18 Feb. 2014.
51 Abbas, Muntazir. “eBay India bets on rising smartphone usage to fuel internet shopping in India.”The Economic Times. 30 May 2014. Web.<http://articles.economictimes.indiatimes.com/2014-05-30/news/50211041_1_internet-shopping-mobile-devices- feature-phones>.
52 Gooptu, Biswarup. “Snapdeal.”
53 eBay Inc. Press Release. 17 Mar 2002. Web. <http://investor.ebay.com/releasedetail.cfm?ReleaseID=74802>
54 Amazon.com Inc. Press Release, 2004. Web. < http://phx.corporate-ir.net/phoenix.zhtml?c=176060&p=irol-newsArticle&ID=6053 26&highlight=>
24
55 “E-commerce in China: Gain entrance into a completely different world,” 18 Jun. 2013. Web. <http://www.ptl-group.com/blogs/ e-commerce-in-china-gain-entrance-into-a-completely-different-world>.
56 eBay Inc. Press Release. 17 Mar 2002. Web.
57 KPMG Global China Practice, “E-commerce in China: Driving a new consumer culture.”China 360. Jan. 2014. Web.<http://www. kpmg.com/CN/en/IssuesAndInsights/ArticlesPublications/Newsletters/China-360/Documents/China-360-Issue15-201401-E- commerce-in-China.pdf>.
58 “E-commerce in China: Gain entrance into a completely different world,” 18 Jun. 2013. Web.
59 Chiu, Cindy. “Understanding social media in China.”McKinsey & Company. Apr. 2012. Web. <http://www.mckinsey.com/insights/ marketing_sales/understanding_social_media_in_china>.
60 KPMG Global China Practice. 18 Jun. 2013.
61 KPMG Global China Practice. 18 Jun. 2013.
62 KPMG Global China Practice. 18 Jun. 2013.
63 Amazon 2013 Annual Report. 10 Apr. 2014. Web. <http://phx.corporate-ir.net/phoenix.zhtml?c=97664&p=irol-reportsannual>.
64 eBay Inc. Press Release. 17 Mar 2002. Web.
65 eBay Inc. Press Release. 17 Mar 2002. Web.
66 Wang, Helen, “How eBay Failed in China.” Forbes. 12 Sep 2010. Web. <http://www.forbes.com/sites/china/2010/09/12/how- ebay-failed-in-china/>
67 Osawa, Juro, Paul Mozur, and Rolfe Winkler. 15 Apr. 2014.
68 Wang, Helen.
69 Wang, Helen.
70 User interview.
71 Osawa, Juro. “How Does Alibaba Make Money?”Digits. Wall Street Journal, 9 Sept. 2013. Web. <http://blogs.wsj.com/ digits/2013/09/09/how-does-alibaba-make-money/>.
72 Osawa, Juro “Alibaba Isn’t the Amazon of China.”The Wall Street Journal. 16 Oct. 2013. Web. <http://blogs.wsj.com/ digits/2013/10/16/alibaba-isnt-the-amazon-of-china/>.
73 Wang, Xin, and Z. Justin Ren. “How to Compete in China’s E-Commerce Market.” MIT Sloan Management Review. 18 Sep. 2012. Web. <http://sloanreview.mit.edu/article/how-to-compete-in-chinas-e-commerce-market/>.
74 Osawa, Juro, Paul Mozur, and Rolfe Winkler. “Alibaba Flexes Muscles Before IPO.” The Wall Street Journal. 15 Apr. 2014.
75 Amazon.com Inc. Press Release, 2004. Web. < http://phx.corporate-ir.net/phoenix.zhtml?c=176060&p=irol-newsArticle&ID=6053 26&highlight=>
76 Wang, Xin, and Z. Justin Ren.
77 Tong, Frank. “China’s No. 2 online retailer posts its first profits.”Top 500 Asian E-Retailers. Internet Retailer. 2 Jan. 2014. Web.
<http://www.internetretailer.com/2014/01/02/chinas-no-2-online-retailer-posts-its-first-profits>.
78 Osawa, Juro, Paul Mozur, and Rolfe Winkler. “Alibaba Flexes Muscles Before IPO.” The Wall Street Journal. 15 Apr. 2014.
79 Wiles, Greg. “Amazon to buy Joyo for access to China.” China Daily. North American edition. 21 Aug. 2004. Web. <http://english. peopledaily.com.cn/200408/21/eng20040821_154103.html>.
80 “Customer Focus Builds Global Growth [Entire Talk] - Diego Piacentini from Amazon.”
81 Piacentini, Diego. 3 Nov. 2010. <http://ecorner.stanford.edu/authorMaterialInfo.html?mid=2484>
82 Tsuruoka, Doug. “Amazon Streaming into China Market with New Services; ‘Fastest-Growing Geography’; U.S. e-tail kingpin planning to double its investment in Chinese unit Joyo Amazon.”Investor’s Business Daily. 26 Jun. 2007. Web. <http://news. investors.com/technology/062607-434999-amazon-streaming-into-china-market-with-new-services-fastest-growing-geography- us-e-tail-kingpin-planning-to-double-its-investment-in-chinese-unit-joyo-amazon.htm>.
83 Sen, Sunny. “Amazon Inc. wants to invest a lot in India and very fast: Diego Piacentini.” Business Today. 29 Jan. 2014. Web.
<http://businesstoday.intoday.in/story/amazon-diego-piacentini-on-india-investment-plans/1/202790.html>.
84 “Customer Focus Builds Global Growth [Entire Talk] - Diego Piacentini from Amazon.”
85 Wiles, Greg.
86 Tong, Frank. “Amazon China builds its own delivery network.” Top 500 Asian E-Retailers. Internet Retailer, 14 Mar. 2014. Web.
<http://www.internetretailer.com/2014/03/14/amazon-china-builds-its-own-delivery-network>.
87 Tsuruoka, Doug.
88 Tsuruoka, Doug.
25
89 Wang, Xin, and Z. Justin Ren.
90 Sen, Sunny. “Amazon Inc. wants to invest a lot in India and very fast: Diego Piacentini.”
91 Chanes, Livia, Fernanda Hoefel, and Anna Gabriela Martins. “Brazil Briefing: Where is the e-commerce market going?” Consumer and Shopper Insights. McKinsey & Company. July 2012. Web. <http://mckinseyonmarketingandsales.com/brazil-briefing-where-is- the-e-commerce-market-going>.
92 Trevisani, Paulo, and Loretta Chao. “Brazil’s Economy Seen in a Major Downturn.”The Wall Street Journal. 14 Feb. 2014. Web.
<http://online.wsj.com/news/articles/SB10001424052702304703804579383274090741140>.
93 Israel, Esteban, and Marcela Ayres. “Amazon tests Brazil’s retail jungle with its Kindle.” Reuters. 7 Feb. 2014. Web. <http://www. reuters.com/article/2014/02/07/us-amazon-brazil-idUSBREA160XM20140207>.
94 “Paying Taxes 2014.” Paying Taxes 2014: The Global Picture. PricewaterhouseCoopers and Doing Business, 2014. Web.<http:// www.pwc.com/gx/en/paying-taxes/assets/pwc-paying-taxes-2014.pdf>.
95 Novais, Andréa. “Brazilian Employment Law in a Nutshell.” The Brazil Business. 15 May 2012. Web. <http://thebrazilbusiness. com/article/brazilian-employment-law-in-a-nutshell>.
96 Novais, Andréa. “Logistics in Brazil.”The Brazil Business. 10 Sep. 2012. Web.
97 “Section II: Infrastructure.” The Global Competitiveness Report 2011-2012. World Economic Forum, 2011. Web. <http:// thebrazilbusiness.com/article/logistics-in-brazil>.
98 MercadoLibre Inc. 2013 10-K.
99 MercadoLibre Inc. 2013 10-K.
100 Trainer, David. “MercadoLibre in Zona Peligrosa.”Forbes. 16 June 2014. Web. <http://www.forbes.com/sites/ greatspeculations/2014/06/16/mercadolibre-in-zona-peligrosa/>.
101 Sciaudone, Christiana. “Amazon Threat Fails to Damp Saraiva Leading Retail Rally.” Bloomberg. 19 Apr. 2013. Web. <http://www. bloomberg.com/news/2013-04-19/amazon-threat-fails-to-damp-saraiva-leading-retail-rally.html>.
102 Carrenho, Carlo. “Google and Amazon launch Brazilian e-bookstores, minutes apart.” Publishing Perspectives. 6 Dec. 2012. Web.
<http://publishingperspectives.com/2012/12/google-and-amazon-launch-brazilian-e-bookstores-minutes-apart/>.
103 Israel, Esteban, and Marcela Ayres.
104 “E-books chegam a 3% das vendas de livros.”Ilustrada. Folha de S.Paulo, 1 Apr. 2014. Web. <http://www1.folha.uol.com.br/ ilustrada/2014/01/1392978-e-books-chegam-a-3-das-vendas-de-livros.shtml>.
105 Lunden, Ingrid. “Amazon Reclaims Its Namesake, Launches In Brazil With Kindle Store; Kindle Devices Coming In ‘Weeks.’” TechCrunch. 6 Dec. 2012. Web. <http://techcrunch.com/2012/12/06/amazon-finally-reclaims-its-namesake-launches-in-brazil- with-kindle-store/>.
106 Israel, Esteban. “Exclusive: Amazon to take on Brazil’s ecommerce jungle.”Reuters. 29 June 2012. Web.<http://www.reuters.com/ article/2012/06/29/us-amazon-brazil-idUSBRE85S1FU20120629>.
107 Carrenho, Carlo. “Is Amazon Really Buying Brazil’s Biggest Bookstore Chain?”Publishing Perspectives. 19 Oct. 2012. Web.<http:// publishingperspectives.com/2012/10/is-amazon-really-buying-brazils-biggest-bookstore-chain/>.
108 Mari, Angelica. “Amazon kicks off physical goods operation in Brazil.” ZDNet. 10 Feb. 2014. Web. <http://www.zdnet.com/ amazon-kicks-off-physical-goods-operation-in-brazil-7000026146/>.
109 Israel, Esteban, and Marcela Ayres.
110 Israel, Esteban, and Marcela Ayres.
111 Chanes, Livia, Fernanda Hoefel, and Anna Gabriela Martins.
112 Israel, Esteban, and Marcela Ayres.
113 Israel, Esteban, and Marcela Ayres.
114 “News: Amazon Launches Mexico Kindle Store!” Amazon Kindle Forum. Amazon.com, 29 Aug. 2013. Web. <http://www.amazon. com/forum/kindle?_encoding=UTF8&cdForum=Fx1D7SY3BVSESG&cdThread=Tx1FU6VLCA6H0NA>.
115 Zhohova, Anastasia, and Peter Rudenko. “Amazon Came to Russia.” Forbes. 19 Apr. 2013. Web. <http://www.forbes.ru/kompanii/ potrebitelskii-rynok/237640-amazon-prishel-v-rossiyu>.
116 Lunden, Ingrid. “Amazon is finally setting up shop in Russia, says report, expanding its international footprint again.”
TechCrunch. 19 Apr. 2013. Web. <http://techcrunch.com/2013/04/19/amazon-is-finally-setting-up-shop-in-russia-says-report/>.
117 “Amazon joins Taufeer.com e-channel program.” Middle East Company News. 7 Sep. 2008. <http://search.proquest.com.proxy.lib. umich.edu/docview/232799912?accountid=14667>.
118 “Amazon.com shipped $280 million products.” Info-Prod Research. 16 Mar. 2009. Web. <http://search.proquest.com.proxy.lib. umich.edu/docview/457418994?accountid=14667>.
26
119 “Global Infrastructure.” Amazon Web Services. Amazon.com, 2014. Web. <https://aws.amazon.com/about-aws/ globalinfrastructure/>.
120 “Announcing the AWS China (Beijing) Region.” What’s New? Amazon.com, 18 Dec. 2013. Web. <https://aws.amazon.com/about- aws/whats-new/2013/12/18/announcing-the-aws-china-beijing-region/>.
121 “Announcing the South America (Sao Paulo) Region.”What’s New? Amazon.com, 14 Dec. 2011. Web. <http://aws.amazon.com/ about-aws/whats-new/2011/12/14/announcing-the-south-america-sao-paulo-region/>.
122 “Amazon CloudFront and Route 53 Add India Edge Locations in Chennai and Mumbai.” What’s New? Amazon.com, 28 July 2013. Web. <https://aws.amazon.com/about-aws/whats-new/2013/07/28/amazon-cloudfront-route53-announce-india-edge- locations/>.
27

![]()
Established at the University of Michigan in 1992, the William Davidson Institute (WDI) is an independent, non-profit research and educational organization focused on providing private-sector solutions in emerging markets. Through a unique structure that integrates research, field-based collaborations, education/training, publishing, and University of Michigan student opportunities, WDI creates long-term value for academic institutions, partner organizations, and donor agencies active in emerging markets. WDI also provides a forum for academics, policy makers, business leaders, and development experts to enhance their understanding of these economies. WDI is one of the few institutions of higher learning in the United States that is fully dedicated to understanding, testing, and implementing actionable, private-sector business models addressing the challenges and opportunities in emerging markets.


