Please see the attached file. thanks
What is the purpose of Critical Path Method? (10 points)
The figure shows a chart where activities are in the nodes. The arrows show the precedence structure. Each node is connected to its immediate precedents.

The numbers show the duration of each activity on the arrows from each node.
Which activities are in the critical path?
Which activities have slack time?
How many week of slack time have those activities? (15 points)
Given the following information:
| Week | 10 | |||||||||
| Rate of performance | 40% | 83% |
|
|
|
|
|
|
|
|
| Planned value | $8,000 | $12,000 |
|
|
|
|
|
|
| $75,000 |
| Actual cost | $10,000 | $13,000 |
|
|
|
|
|
|
|
|
Estimate how many weeks the project is delayed.
Estimate how much the budget will be over the planned amount.
Produce a plot showing planned and actual values from start to end of the project. (15 points)
Create a schedule for the following data that starts Dec 14, 2017. Assume that one can work 7 days a week (10 points).
| Code | Description | Immediate | Duration | |
| 1 | Strategic plan phase |
| 30 | |
| 2. | Team formation | 40 | ||
| 3 | Master facility plan | 100 | ||
| 4. | Space programming | 60 | ||
Show a Gantt chart for the schedule.
Make sure that the chart shows the critical path. Create the chart and copy the chart into the word document (do not provide your project management files)
What is precision medicine? How is precision medicine different from predictive medicine? (10 points)
Given the following information and formulae from the lecture, calculate earned value and cost variance (10 points):
Rate of performance: 65%
Planned value: $4000
Actual cost: $6000
Using the data in the table, and provided severity of CHF, MI, Diabetes, Hypertension, alcohol use, assess the overall severity of the nine cases in Table below. Plot the patient's length of stay against overall severity of illness. (10 points)
| Case | 1st Diagnosis | 2nd Diagnosis | 3rd Diagnosis | 4th Diagnosis | 5th Diagnosis | Length of stay | MI | CHF | Diabetes | Hypertension | Alcohol use | OVERALL SEVERITY |
| 1 | MI | CHF |
|
|
| 1 | 1 | 0 | 0 | 0 |
| |
| 2 | MI |
| Diabetes |
|
| 1 | 0 | 1 | 0 | 0 |
| |
| 3 | MI | CHF | Hypertension |
| Alcohol use | 1 | 1 | 1 | 0 | 1 |
| |
| 4 | MI | CHF |
|
|
| 1 | 1 | 0 | 0 | 0 |
| |
| 5 | CHF | Diabetes |
|
| Alcohol use | 0 | 1 | 1 | 0 | 1 |
| |
| 6 | MI | Hypertension |
|
|
| 1 | 0 | 0 | 1 | 0 |
| |
| 7 | MI | Diabetes | CHF | Hypertension | Alcohol use | 1 | 1 | 1 | 1 | 1 |
| |
| 8 | MI | Alcohol use |
|
|
| 1 | 0 | 0 | 0 | 1 |
| |
| 9 | CHF | Diabetes |
|
|
| 0 | 1 | 1 | 0 | 0 |
| |
|
|
|
|
|
|
| Severity | 0 | 1.2 | 0.2 | 0.8 | 1.0 |
|
Identify which 2 patients in the following table could serve as matched controls for the cases. Blanks indicate patients who did not fall in the time period. Select the possible controls randomly using the lowest random number. Match on age. (10 points)
| Patient ID | Received Intervention | Age | Months to Fall | Random Number | ||
| Observation Period | Follow-up Period | |||||
| No | 65 | 1 | 0.24 | |||
| Yes | 62 |
| 0.85 | |||
| Yes | 85 |
| 0.74 | |||
| No | 82 |
| 0.60 | |||
| No | 78 |
| 0.17 | |||
| No | 64 |
| 0.72 | |||
9.In the following questions assume that we have a clinician, Dr. Jones, and constructed the decision tree in following figure:
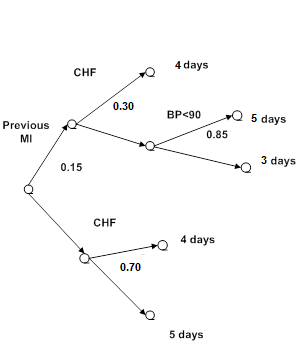
What is the expected length of stay for Dr. Jones (10 points)?


