Statistic and probability
What probability distribution would you assume the random variable X follow? Be specific and provide the values of the population parameters of your probability distribution or provide a formula for the probability distribution function P(X)
Using your answer to part (a), estimate the probability that more than 40% of the 200 smartphone users surveyed in Canberra have downloaded the COVIDSafe App.
State the null (H0) and alternative (HA) hypotheses of your test using proper statistical notation for the population parameters
Calculate the value of your statistic for this hypothesis test. (please show your working by providing the equation you used to calculate your test statistic)
Calculate the p-value of your test and interpret its meaning (Note: Please also provide the mathematical expression you used to calculate your p-value)
Do you have statistical evidence to support your alternative hypothesis given the data? (Assuming a significance level of
 =0.05) Why or why not? State your conclusion of the test in the context of the question.
Construct a 99% confidence interval estimate of the population proportion of smartphone users in Canberra who have downloaded the COVIDSafe APP. (Note: please show your working by providing the formula you used to calculate your confidence interval
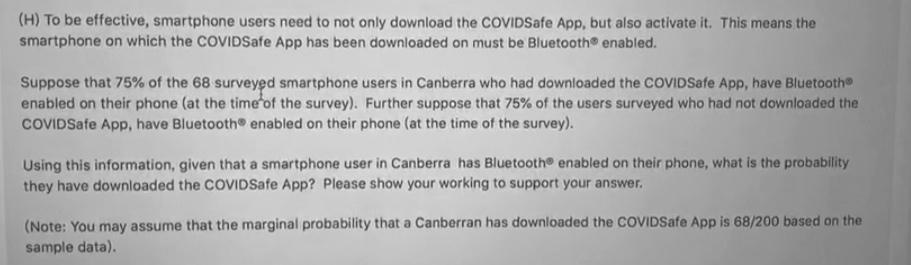
(H)