I have attached a file
Question 1:
Specific Motors of Detroit has developed a new Automobile known as the M car. 24 M cars and 28 J cars (from Japan) were road tested to compare miles-per-gallon (mpg) performance. Sample 1(M-Cars) Sample 2 (J Cars)
| Sample 1(M-Cars) | Sample 2 (J Cars) |
| n1 = 24 | n2= 28 |
| X1 = 29.8 | X2 = 27.3 |
S1 = 2.56 S2 = 1.81
Calculate a 90% confidence interval for the difference between mpg performance of the 2 car models.
A.) The manager claims that there is no difference in the mpg performance of M and J cars.
B.) Write out the null and alternative hypothesis to test the manager’s claim.
C.) Calculate the test statistic.
D.) Calculate the p-value.
E.) At a 5% level of significance do you accept or reject Ho.
Question 2:
Twenty undergraduate students are discussing the number of hours they need to study statistics for the final exam. They have three different plans. The entries in the table for the different plans are:
| Plan 1 | Plan 2 | Plan 3 |
| 7.5 | ||
| 4.5 | ||
The resulting ANOVA table is shown below:
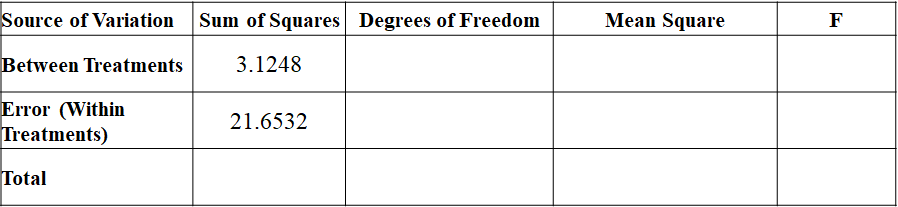
Test the hypothesis that the mean of the 3 plans are the same, at 5% level of significance. State the null and alternative hypotheses.
Question 3:
Suppose that Vancouver School Board wants to examine the effect of new curriculum on three different discitis: Vancouver, Richmond and Delta. It collects a sample of students’ marks in the National Beard Exam of three different schools from each district.
Using the hypothetical data provided below, test whether the mean of students’ marks for each district is the same.
Use α=5%.
Table ANOVA.1
| Vancouver district | Richmond district | Delta district |
| 643 | 469 | 484 |
| 702 | 525 | 402 |
| 655 | 427 | 456 |
 666.67 473.67 447.33
S: 31.18 49.17 41.68
State the null and alternative hypotheses.
Calculate the appropriate test statistic
Obtain the Critical Value
Question 4:
A university administrator wants to investigate if there is any relationship between international student’s IELTS exam score (X) and the number of admitted students at university (Y). A sample of 16 students is randomly selected and the results are summarized in the ANOVA table below:
| ANOVA | ||||
|
| df | SS | MS | F |
| Regression | 1 | 372.707 | 372.707 | 42.927 |
| Residual | 15 | 130.234 | 8.682 | |
| Total | 16 | 502.941 |
|
|
|
| Coefficients | Standard Error | t Stat | P-value |
| Intercept | 45.623 | 3.630 | 12.569 | 0.000 |
| Price | 0.107 | 0.016 | 6.552 | 0.000 |
What is the estimated regression equation that relates the number of admitted students at university (Y) to the exam score in IELTS (X)?
What is the estimated number of admitted students if a student got a score of 8.0 in IELTS?
Is the regression relationship significant? Use the p-value approach and 2% level of significance
Compute the coefficient of determination between the exam score in accounting and the exam score in mathematics. Interpret the result in the context of the problem.
Question 6:
Obtain regression equation of Y on X and estimate Y when X=60 from the following:
| 55 | 43 |
| 45 | 65 |
| 43 | 60 |
| 65 | 75 |
| 70 | 65 |
| 55 | 53 |
| 40 | 35 |


