Using the data that’s already completed/ collected and perform a statistical to analyze the results.· For this signature assignment:- take these results and put them into a written report, similar to
DATA ANALYSIS 11
Data analysis biostatistics
Data analysis biostatistics
1. Calculation of descriptive statistics
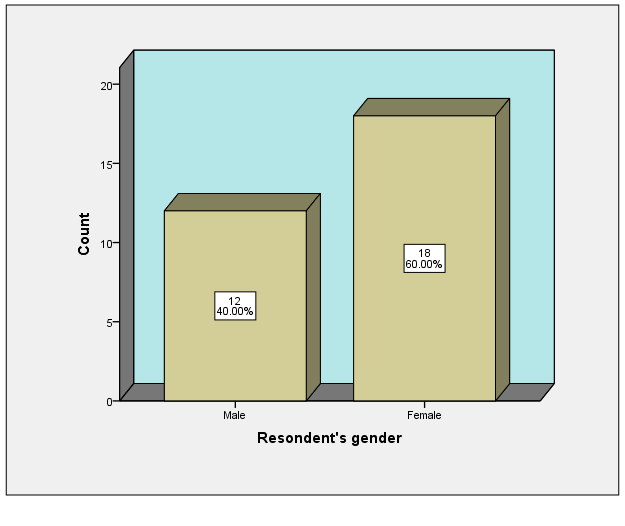
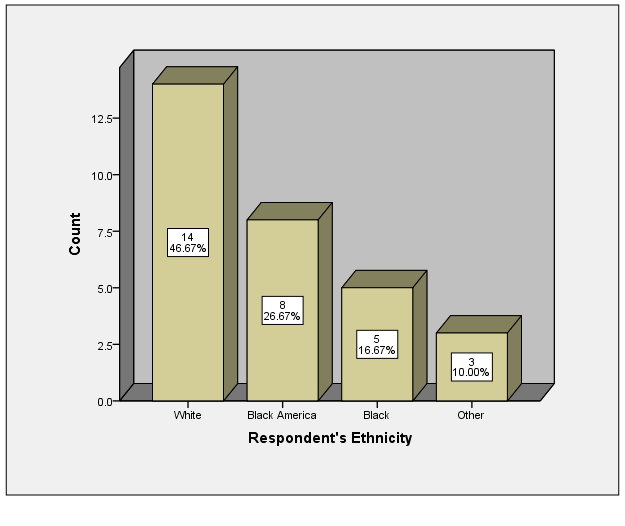
a. Create a bar chart for the participants’ gender and ethnicity.
The results indicated in the bar chart below show that most respondents; 18 (60%) were females compared to the male colleagues accounting for 12 (40%), (David, 2017).
In addition, the results on the ethnicity indicate that most respondents; 14 (46.67%) were Whites followed by the Black Americans accounting for 8 (26.67%). Additionally, the Black and Other ethnics accounted for 5 (16.67%) and 3 (10.0%) respectively, (Opie, 2019).
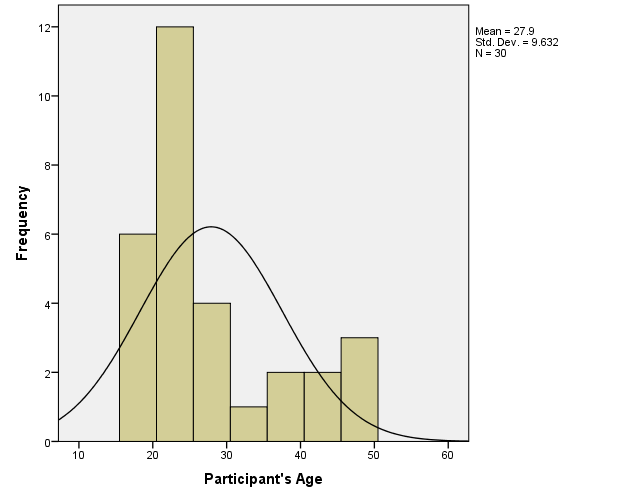
b. Create a histogram for participants’ age
The mean age is 27.9 with a standard deviation of 9.63. The age is positively skewed with the normal curve drawn, (Campbell, 2016).
2. Calculate descriptive statistics for your dependent variable
The results in the table below indicate that a majority of the respondents; 19 (63.3%) were satisfied with the current VTE risk assessment while only 11 (36.7%) were not satisfied with the current VTE assessment, (Guerrero, 2019).
| Respondent's satisfaction with the current VTE risk assessment | |||||
| | Frequency | Percent | Valid Percent | Cumulative Percent | |
| Valid | Yes | 19 | 63.3 | 63.3 | 63.3 |
| No | 11 | 36.7 | 36.7 | 100.0 | |
| Total | 30 | 100.0 | 100.0 | ||
3. Create a summary table of your descriptive statistics.
a.
Categorical variables
| Respondent’s gender | |||||
| | Frequency | Percent | Valid Percent | Cumulative Percent | |
| Valid | Male | 12 | 40.0 | 40.0 | 40.0 |
| Female | 18 | 60.0 | 60.0 | 100.0 | |
| Total | 30 | 100.0 | 100.0 | ||
| Marital status | |||||
| | Frequency | Percent | Valid Percent | Cumulative Percent | |
| Valid | Married | 16 | 53.3 | 53.3 | 53.3 |
| Widowed | 2 | 6.7 | 6.7 | 60.0 | |
| Divorced | 5 | 16.7 | 16.7 | 76.7 | |
| Single | 7 | 23.3 | 23.3 | 100.0 | |
| Total | 30 | 100.0 | 100.0 | ||
| Respondent's race | |||||
| | Frequency | Percent | Valid Percent | Cumulative Percent | |
| Valid | White | 14 | 46.7 | 46.7 | 46.7 |
| Black America | 8 | 26.7 | 26.7 | 73.3 | |
| Black | 5 | 16.7 | 16.7 | 90.0 | |
| Other | 3 | 10.0 | 10.0 | 100.0 | |
| Total | 30 | 100.0 | 100.0 | ||
| VTE risk assessment has provision for the in-service and/or educational programs | |||||
| | Frequency | Percent | Valid Percent | Cumulative Percent | |
| Valid | Strongly Disagree | 4 | 13.3 | 13.3 | 13.3 |
| Disagree | 7 | 23.3 | 23.3 | 36.7 | |
| Not Sure | 1 | 3.3 | 3.3 | 40.0 | |
| Agree | 10 | 33.3 | 33.3 | 73.3 | |
| Strongly Agree | 8 | 26.7 | 26.7 | 100.0 | |
| Total | 30 | 100.0 | 100.0 | ||
| I would recommend venous thromboembolism (VTE) among inpatient postpartum to clients | |||||
| | Frequency | Percent | Valid Percent | Cumulative Percent | |
| Valid | Strongly Disagree | 2 | 6.7 | 6.7 | 6.7 |
| Disagree | 4 | 13.3 | 13.3 | 20.0 | |
| Not Sure | 3 | 10.0 | 10.0 | 30.0 | |
| Agree | 12 | 40.0 | 40.0 | 70.0 | |
| Strongly Agree | 9 | 30.0 | 30.0 | 100.0 | |
| Total | 30 | 100.0 | 100.0 | ||
| Conducting early mobilization protocol in the recovery unit helps to prevent venous thromboembolism (VTE) | |||||
| | Frequency | Percent | Valid Percent | Cumulative Percent | |
| Valid | Strongly Disagree | 4 | 13.3 | 13.3 | 13.3 |
| Disagree | 6 | 20.0 | 20.0 | 33.3 | |
| Not Sure | 1 | 3.3 | 3.3 | 36.7 | |
| Agree | 13 | 43.3 | 43.3 | 80.0 | |
| Strongly Agree | 6 | 20.0 | 20.0 | 100.0 | |
| Total | 30 | 100.0 | 100.0 | ||
| Early mobilization protocol in the recovery unit in preventing venous thromboembolism (VTE) enhances customer satisfaction | |||||
| | Frequency | Percent | Valid Percent | Cumulative Percent | |
| Valid | Strongly Disagree | 3 | 10.0 | 10.0 | 10.0 |
| Disagree | 5 | 16.7 | 16.7 | 26.7 | |
| Not Sure | 2 | 6.7 | 6.7 | 33.3 | |
| Agree | 12 | 40.0 | 40.0 | 73.3 | |
| Strongly Agree | 8 | 26.7 | 26.7 | 100.0 | |
| Total | 30 | 100.0 | 100.0 | ||
| VTE risk assessment ensures shared decision making in the recovery unit in preventing venous thromboembolism (VTE) | |||||
| | Frequency | Percent | Valid Percent | Cumulative Percent | |
| Valid | Strongly Disagree | 5 | 16.7 | 16.7 | 16.7 |
| Disagree | 7 | 23.3 | 23.3 | 40.0 | |
| Not Sure | 4 | 13.3 | 13.3 | 53.3 | |
| Agree | 8 | 26.7 | 26.7 | 80.0 | |
| Strongly Agree | 6 | 20.0 | 20.0 | 100.0 | |
| Total | 30 | 100.0 | 100.0 | ||
Continuous variables
| Statistics | ||
| Participant's Age | ||
| N | Valid | 30 |
| Missing | 0 | |
| Mean | 27.90 | |
| Std. Deviation | 9.632 | |
| Minimum | 18 | |
| Maximum | 50 | |
4. Hypothesis formulation and testing
a. An independent samples t-test was used to test the hypothesis listed below.
b. Write the null and alternate hypotheses.
Null hypothesis: There is not a statistically significant mean difference in age for those satisfied with the current VTE risk assessment and those not satisfied with the current VTE risk assessment.
Alternative hypothesis: There is a statistically significant mean difference in age for those satisfied with the current VTE risk assessment and those not satisfied with the current VTE risk assessment.
Results output:
| Group Statistics | |||||||||||||||||
| Respondent's satisfaction with the current VTE risk assessment | N | Mean | Std. Deviation | Std. Error Mean | |||||||||||||
| Participant's Age | Yes | 19 | 22.26 | 3.212 | .737 | ||||||||||||
| No | 11 | 37.64 | 9.266 | 2.794 | |||||||||||||
| Independent Samples Test | |||||||||||||||||
| | Levene's Test for Equality of Variances | t-test for Equality of Means | |||||||||||||||
| F | Sig. | t | df | Sig. (2-tailed) | Mean Difference | Std. Error Difference | 95% Confidence Interval of the Difference | ||||||||||
| Lower | Upper | ||||||||||||||||
| Participant's Age | Equal variances assumed | 18.668 | .000 | -6.644 | 28 | .000 | -15.373 | 2.314 | -20.113 | -10.634 | |||||||
| Equal variances not assumed | -5.321 | 11.409 | .000 | -15.373 | 2.889 | -21.705 | -9.042 | ||||||||||
c. What is the calculated statistic value?
The calculated statistic value when the equal variances assumed is -6.644
d. What is the p and critical statistic value?
The p and critical statistic value are 0.0005 and 6.28, respectively.
e. Is the p value significant? Is calculated statistic value greater than critical value?
Yes, the p value calculated is highly significant; p-value<0.05. However, the calculated statistic value is lower than critical value; -6.644<6.28, (Anderson, et, al, 2020).
f. What is your conclusion?
In conclusion, The mean of the participants not satisfied with the current VTE risk assessment; 37.64 with a standard deviation of 9.26 is higher than the mean of the participants satisfied with the current VTE risk assessment; 22.26 with a standard deviation of 3.21. Hence, we reject the null hypothesis and conclude that there is a statistically significant mean difference in age for those satisfied with the current VTE risk assessment and those not satisfied with the current VTE risk assessment, (Anderson, et, al, 2020).
References
Anderson, D. R., Sweeney, D. J., Williams, T. A., Camm, J. D., & Cochran, J. J. (2020). Modern business statistics with Microsoft Excel. Cengage Learning.
Anderson, D. R., Sweeney, D. J., Williams, T. A., Camm, J. D., & Cochran, J. J. (2020). Essentials of modern business statistics with Microsoft Excel. Cengage Learning.
Campbell, M. (2016). Normal distributions. African Journal of Midwifery and Women's Health, 10(2), 59-61.
David, M. (2017). Statistics for managers, using Microsoft excel. Pearson Education India.
Guerrero, H. (2019). Excel data analysis. Springer Berlin Heidelberg,.
Opie, C. (2019). USING EXCEL/SPSS IN YOUR RESEARCH. Getting Started in Your Educational Research: Design, Data Production and Analysis, 309.
Section A: Demographic Information
I would like to ask you some questions about yourself. Please answer as truthfully as you possibly can. Tick only one appropriate statement (response) in each question.
1. Kindly state your age:_____________________years
2. Select your appropriate gender.
Male
Female
3. What is your marital status?
Married
Widowed
Divorced
Single
4. What is your Race?
White
Black America
Black
Other_________________(specify)
5. Are you satisfied with the current VTE risk assessment? (Dependent Variable)
Yes
No
Section B: Attitude towards VTE risk assessment (Independent variables)
This section contains five items on the attitude towards VTE risk assessment. Kindly rate the following statements using a scale of SA-strongly agree [1], A-agree [2], NS-Not Sure [3], D-disagree [4], SD-strongly disagree [5].
Mark the correct box with either tick [√] or [x]
| NO | STATEMENTS | RESPONSE | ||||
| AT- 1 | VTE risk assessment has provision for the in-service and/or educational programs | |||||
| AT- 2 | I would recommend venous thromboembolism (VTE) among inpatient postpartum to clients | |||||
| AT- 3 | Conducting early mobilization protocol in the recovery unit helps to prevent venous thromboembolism (VTE) | |||||
| AT-4 | Early mobilization protocol in the recovery unit in preventing venous thromboembolism (VTE) enhances customer satisfaction | |||||
| AT- 5 | VTE risk assessment ensures shared decision making in the recovery unit in preventing venous thromboembolism (VTE) | |||||


