I will Attach 4 things below, 1- The lab manual, you should follow the manual as it is and answer the 8 questions in the manual. 2- Letter on how to write a lab report. 3- Letter on the grading criter
Temple University physics
Magnetic Field Due to Currents
The magnetic field produced by permanent magnets is familiar to many from refrigerator magnets or those horseshoe-shaped ones in classic cartoons. However, there is another very useful source of magnetic field: moving electric charges. We know that electric currents are made up of moving charges, lots and lots of them. Here we’ll map out how the field looks in the region around the wire, and we’ll investigate how the magnetic field strength and orientation depends on the current.
Learning Goals for This Lab:
Understand what factors contribute the magnetic field strength and orientation near a current-carrying wire.
Learn how to develop experimental procedures for obtaining conclusive data.
Understand power limitations in circuit components.
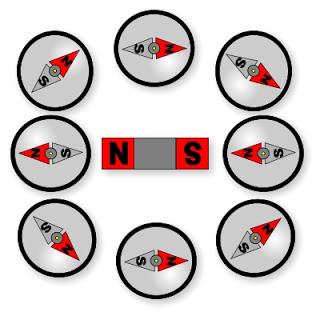
A compass is a permanent magnet that sits on a low friction pivot so that it can easily rotate to align to the Earth’s magnetic field. This illustrates the behavior of ferromagnets in an external field: they align parallel to the field. This is also consistent with the idea that opposite poles attract. This is illustrated in the figure below:
Question 1. If you know the red end of a compass needle is a magnetic north pole like those in the figure above, how can you the compass to determine whether earth’s geographic north pole is a magnetic south pole or magnetic north pole?
Watch this video explaining how Hans Oersted discovered that electric currents produce magnetic fields: https://youtu.be/RwilgsQ9xaM
Question 2. Note how Oersted’s setup was simply a wire connected to a battery. One precaution that must be taken in this experimental setup is to avoid passing too much current through the wire, otherwise it could become very hot and start a fire. If the wire connected to the battery has a resistance of 10 ohms, and is able to safely dissipate the heat from 3 Watts of power, what is the maximum current we should use in our experiment?
Question 3. Briefly describe a measurement you can do using a compass to determine information on the direction and/or strength of the magnetic field passing through the wire in Oersted’s experiment. Include your prediction on how you expect the compass reading to vary as you change one parameter (e.g. distance or current through the wire).
Question 4. Being critical of your measurement described in the previous question, what errors or complications could arise that would prevent you from obtaining conclusive results? Include a precaution or extra steps that could be undertaken to ensure conclusive results. (One optional choice here is how to deal with the background signal produce by Earth’s magnetic field.)
Part II. Characterize the Magnetic Field of a SolenoidA solenoid is simply a long wire wound into a cylinder. By passing current through it, it becomes an electromagnet because each loop of the wire contributes to the overall magnetic field. If you imagine superimposing the fields of hundreds of you can see that solenoids generate much higher magnetic fields than a single wire. Another advantage of the solenoid is that the magnetic field can be quickly switched on and off, unlike a permanent magnet. For this reason, solenoids have many practically uses. Can you name any?
Question 5. Name one way that solenoids are used in everyday experience.
Open the PhET simulation “magnets-and-electromagnets_en.jar” (The file is provided on Canvas, or you can find it through google). If the file doesn’t open due to security settings, try navigating to the download location and open the file from there. Explore the simulation then do the following.
Click on the electromagnet tab at the top. Check the box to show the field meter. Use the slider control on the battery to change the voltage through the wire while observing what happens to the magnetic field. Record your observations to use to answer the following questions and include them in the data section of your report.

Question 6. How does the direction of the current affect the direction of the magnetic field?
Question 7. How does the magnitude of the current affect the magnitude of the magnetic field? Support your answer with evidence.
Question 8. How does the field along the axis direction compare with the magnitude of the field along the radial direction of the solenoid at a given distance? See the figure at right indicating axial and radial directions.
Use the field meter to measure the magnetic field (in units of Gauss) along the axial direction as a function of distance from the solenoid. You can use the grid of magnet field needles to measure arbitrary units of distance.
From your data, make two graphs: 1) B vs. distance, 2) B vs. 1/distance^2.
See the grading rubric below for what is expected in your report.
| Sections | A (90-100%) | B (80-90%) | C (70-80%) | D/F (0-70%) | |
10% | Clear and concise organization, formatting, and language. | Minor organizational problems. Text is unedited. | Several organizational issues. Text is in rough draft form. | Major problems with organization. | |
10% | 1-3 sentences summarizing the main goals and how they are obtained by experimentation. | Not concise. Goals unclear. | Poor understanding of the goals. Generic statements. | Cursory or missing introduction. Copied from Manual | |
Calculations Fitting 30% | Clear, concise equations and calculations. Care taken with units. Averages and standard deviation from the mean reported as necessary. All essential data displayed in graphical or tabular format. No excessive data given. All axes labeled with units included. Graphs fit with appropriate functions (lines or curves) with fitting parameters reported. | Calculations mostly correct. Excessive detail or repetition of similar calculations. Excessive raw data included. One of items at left poorly labeled or missing. | Major calculations missing or clearly needs improved organization. Some essential data missing or plotted incorrectly. More than one fit or equation missing. | No calculations given. Data reported without showing work. Major issues with data presentation. No fitting done. | |
30% | Correct and complete answers to all questions in lab manual. | Mostly correct and complete answers to questions. | Incomplete answers or several wrong answers. | Mostly incorrect or missing answers. | |
20% | Summary of conclusions drawn with references to values obtained. Discussion of: 1) actual vs expected results 2) fitting results 3) reproducibility 4) effects from sources of error/precautions | Conclusion not comprehensive. Missing one of the items at left. | Only cursory summarization. | Conclusion inappropriate or missing. |
4
7/12/2020 11:02 AM


