I will Attach 5 things below, 1- The lab manual, you should follow the manual as it is and answer the 5 questions in the manual. 2- The "collected data". 3- Letter on how to write a lab report. 4- Let
MAPPING THE ELECTROSTATIC POTENTIAL AND ELECTRIC FIELD 0
Mapping the Electrostatic Potential and Electric Field
7/3/2020
Mapping the Electrostatic Potential and Electric Field
Introduction
This lab's objective is to examine potentials, equipotential curves, and electric field caused by two-dimensional electrostatic charge distribution. The electric force is conservative. We exploit this fact and consider the force to be associated with electric potential V. it is extremely difficult to measure electric fields directly.
Procedure
Apparatus
Voltage meter
Electrodes
Meter probes
D.C. Power supply
Conducting paper
Power supply wires
Procedure
Part I: Point Source and Guard Ring
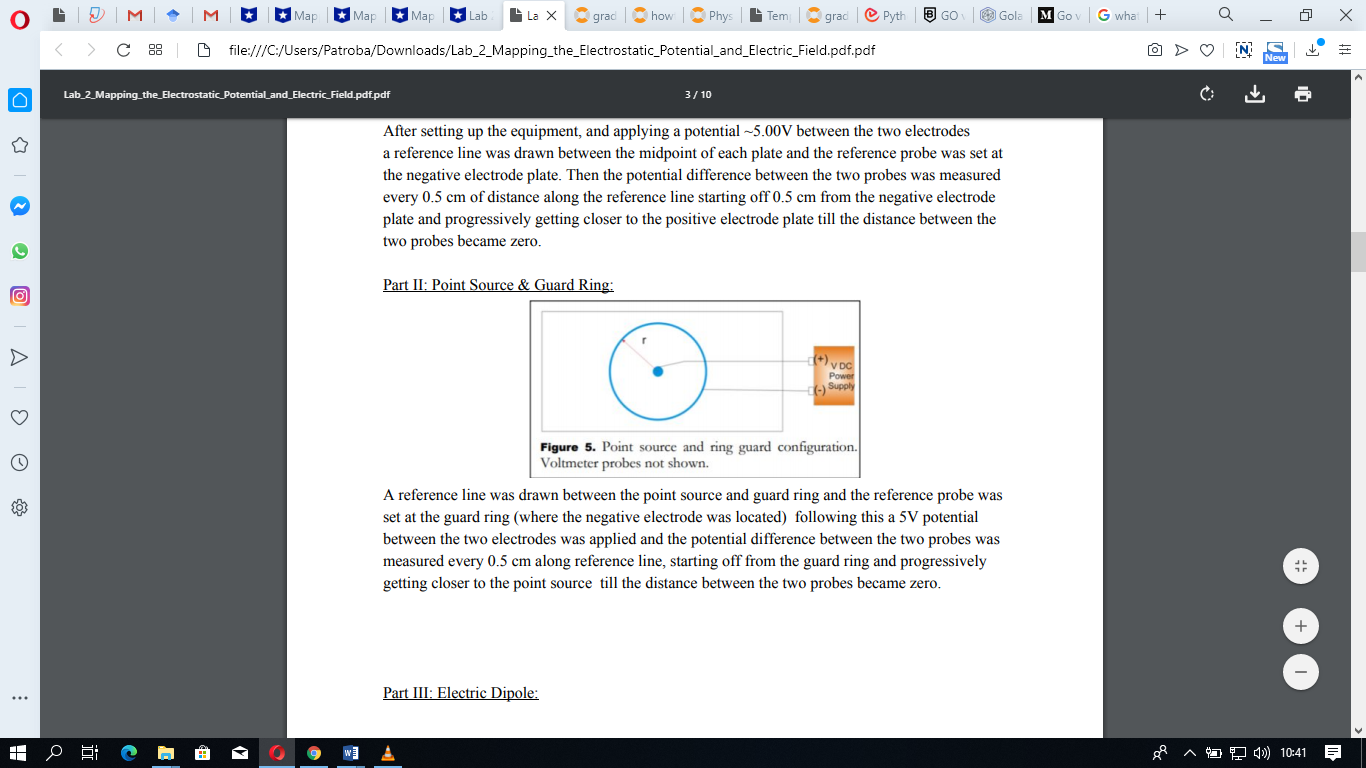
Figure 1:Point source ring and guard configuration
The reference line amid the source point and guard ring was drawn—reference probe set at the guard ring, a region that comprises of negative charges. A potential difference of 5V was applied, and the potential difference between the probe measured after every 2mm, starting the guard ring.
Part II: Mapping Potential Dipole.
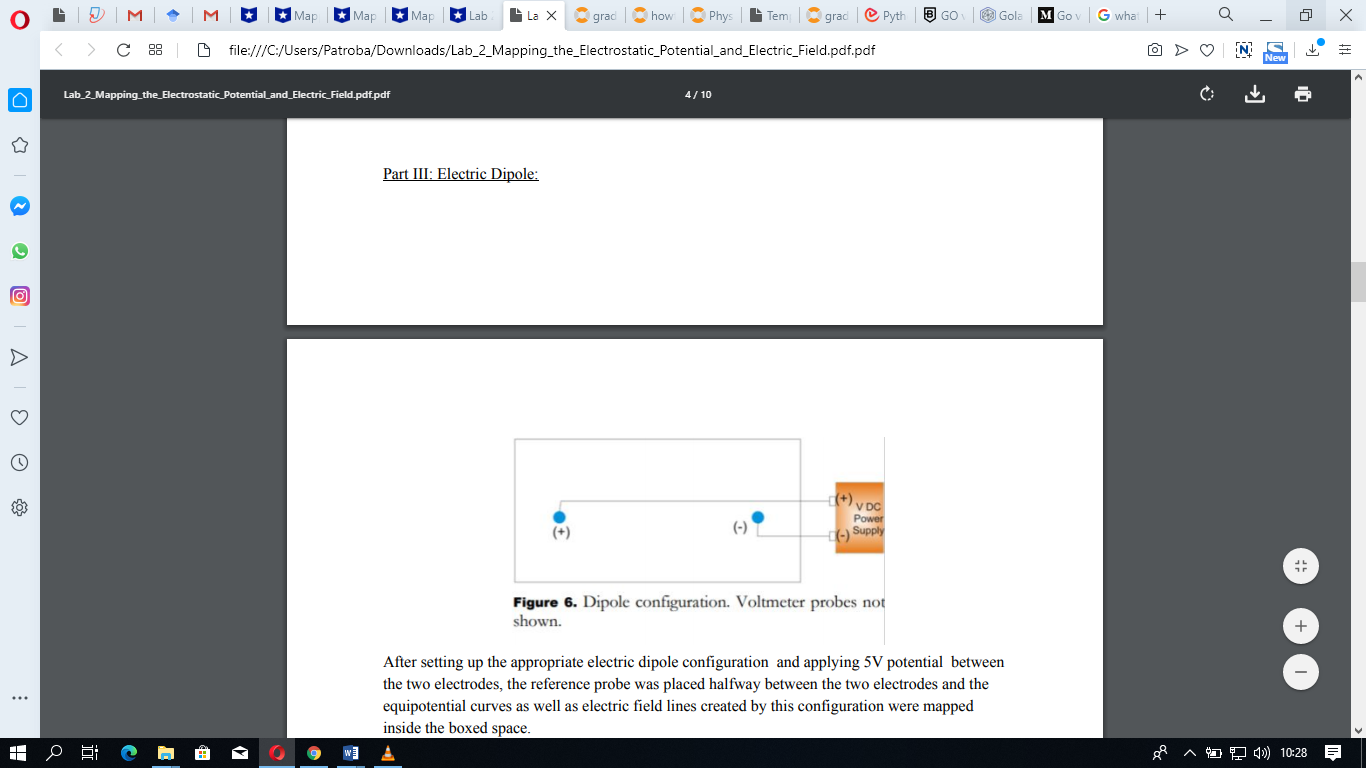
Figure 2:Mapping Potential Dipole Configuration
After setting up the right electric dipole configuration followed by the application of 5V potential difference between the two electrodes, a reference probe was placed at the midpoint of the two electrodes. Equipotential curves and electric field lines were created, and configuration mapped inside the boxed space.
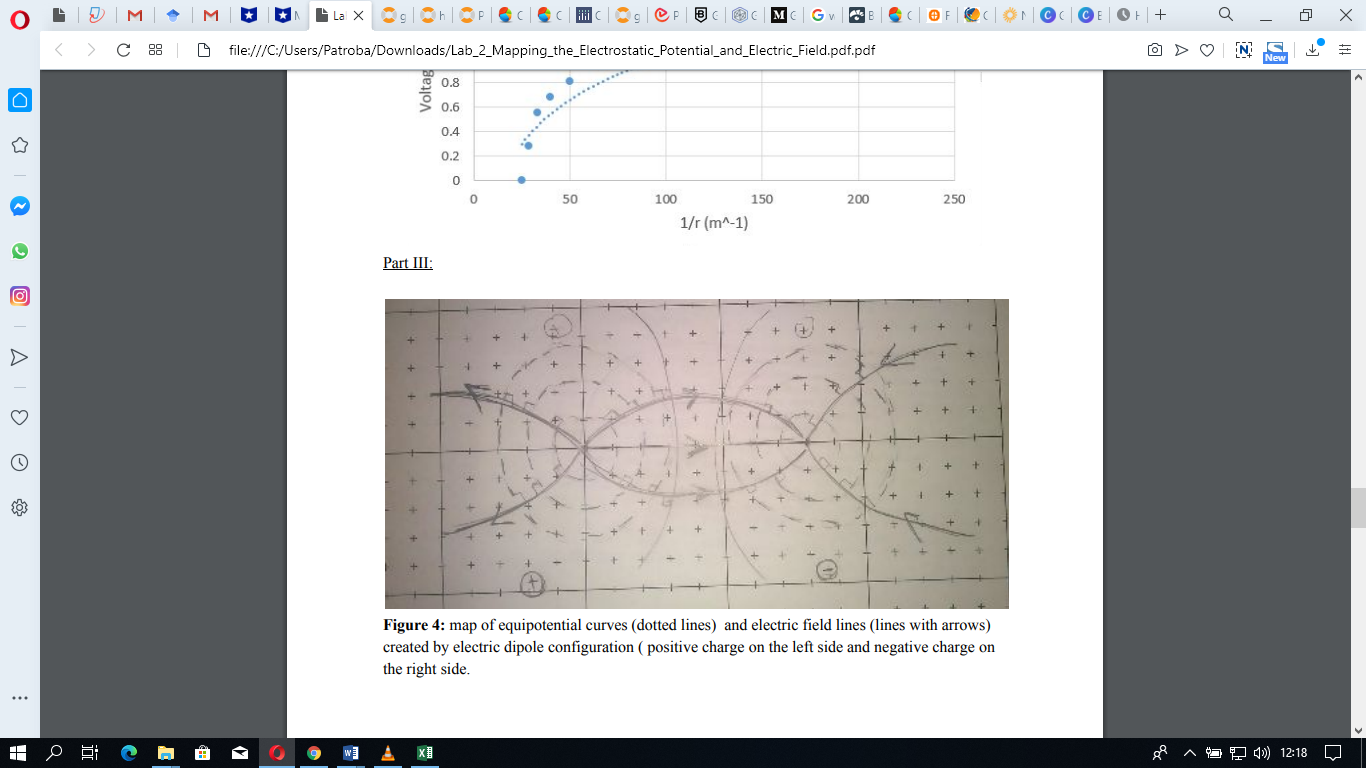
Part III: Like Charges in a Box
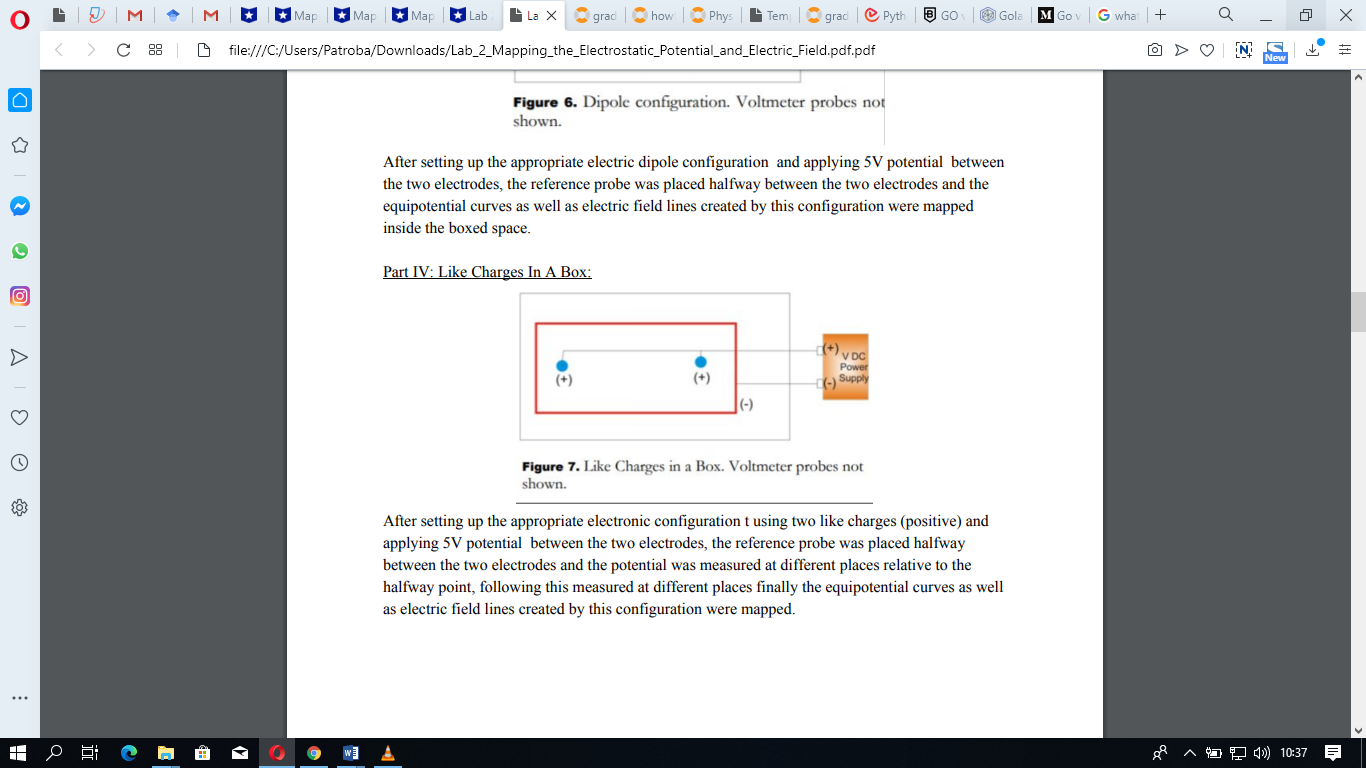
Figure 3: Like Charges in a Box configuration
After the suitable electronic configuration was set up using two positive charges and a potential of 5V applied amid the electrodes, the reference probe was situated relatively in the middle. The equipotential curves and electric field lines were drawn at different points created by the configuration, and they were mapped.
Part IV: Parallel Plates.
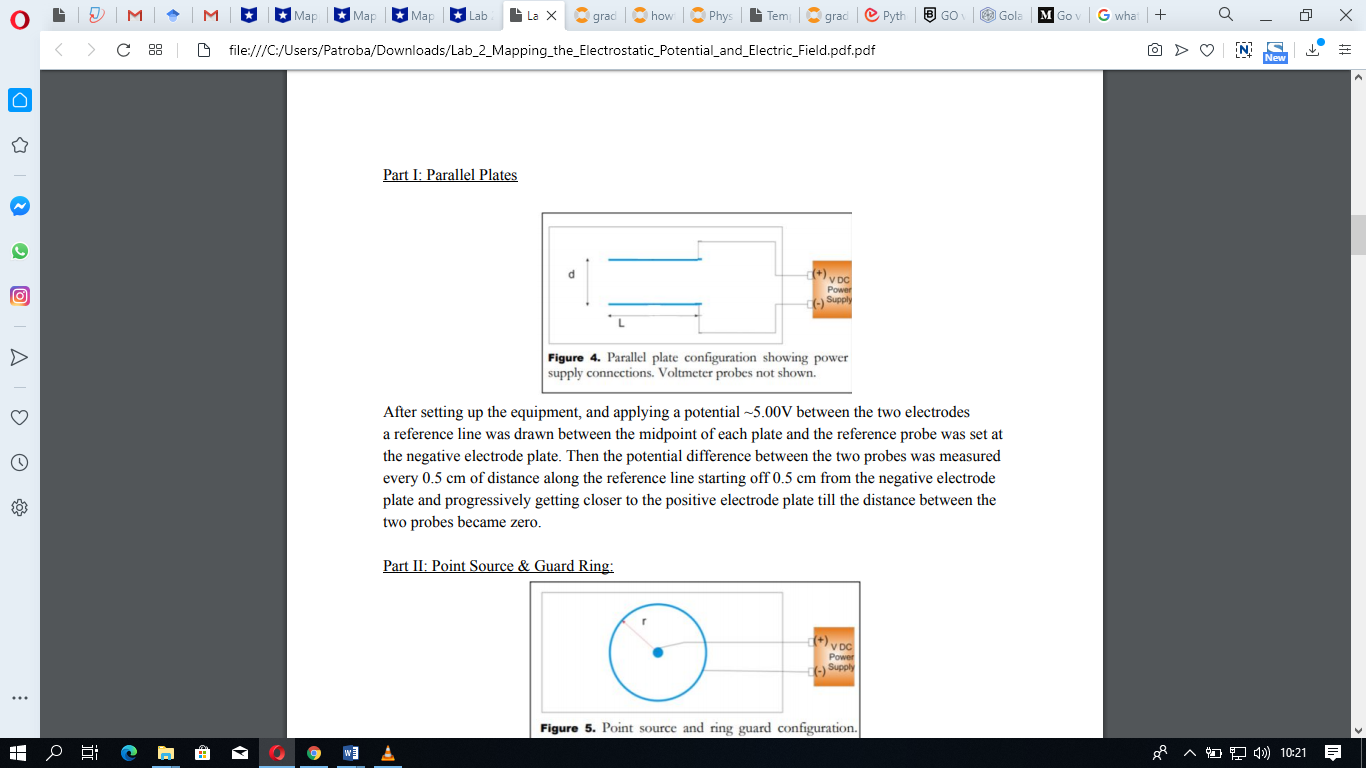
Figure 4: Parallel Plates configuration
The equipment was set up, as shown in the figure above, and the potential of 5.00 V applied across the electrodes. A reference line was drawn at the midpoint of the plates, and a negative electrode was set as the reference point. The potential difference between the probes was measured every 0.5 cm along the reference line, beginning from the negative electrode's 0.5cm mark. The measurement moved closer until the difference was zero.
Precautions and Sources of Error
Data, Calculations, and Fittings
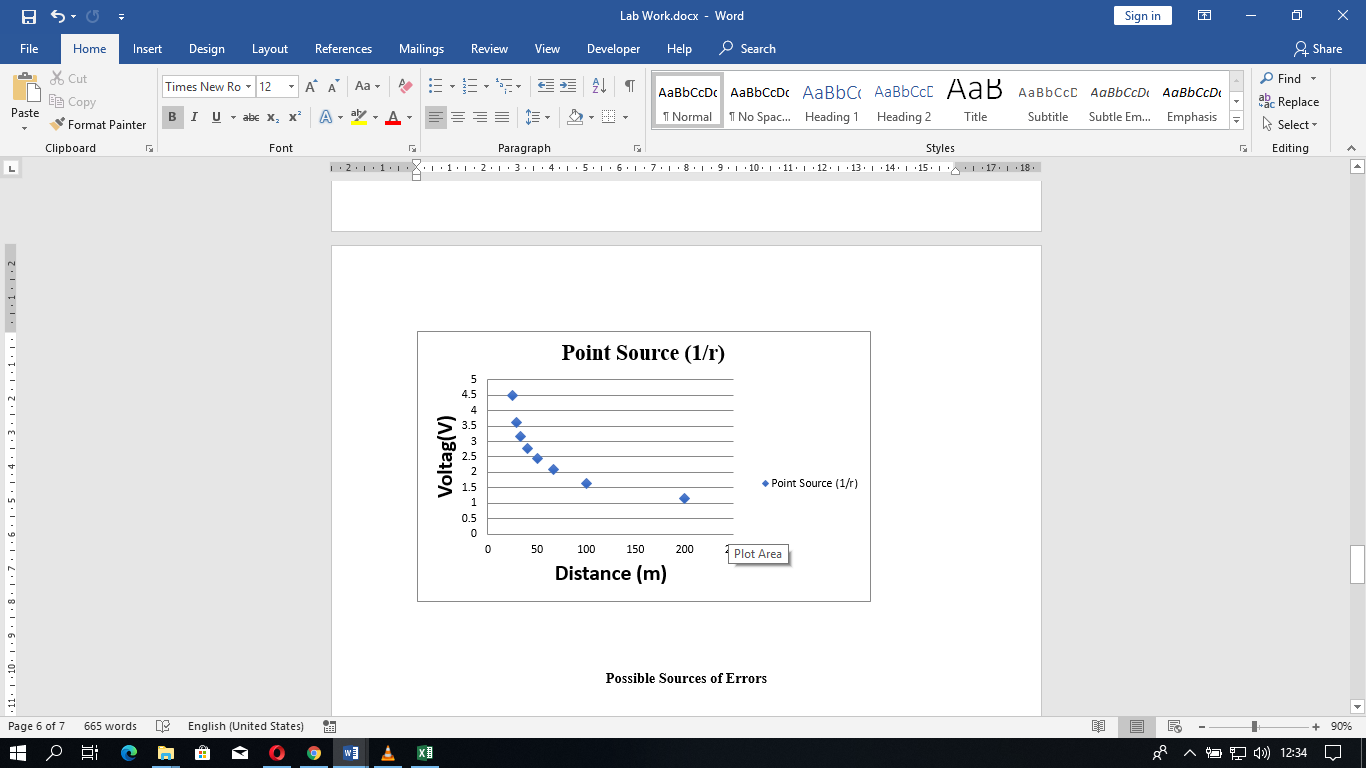
Part 1
| Distance (m) | Potential (V) |
| 0.02 | 4.10 |
| 0.04 | 2.95 |
| 0.06 | 2.42 |
| 0.08 | 2.41 |
| 0.10 | 1.869 |
| 0.12 | 1.554 |
| 0.14 | 1.358 |
| 0.16 | 1.050 |
| 0.18 | 0.896 |
| 0.20 | 0.777 |
Graph of voltage vs. Distance for point
Part II
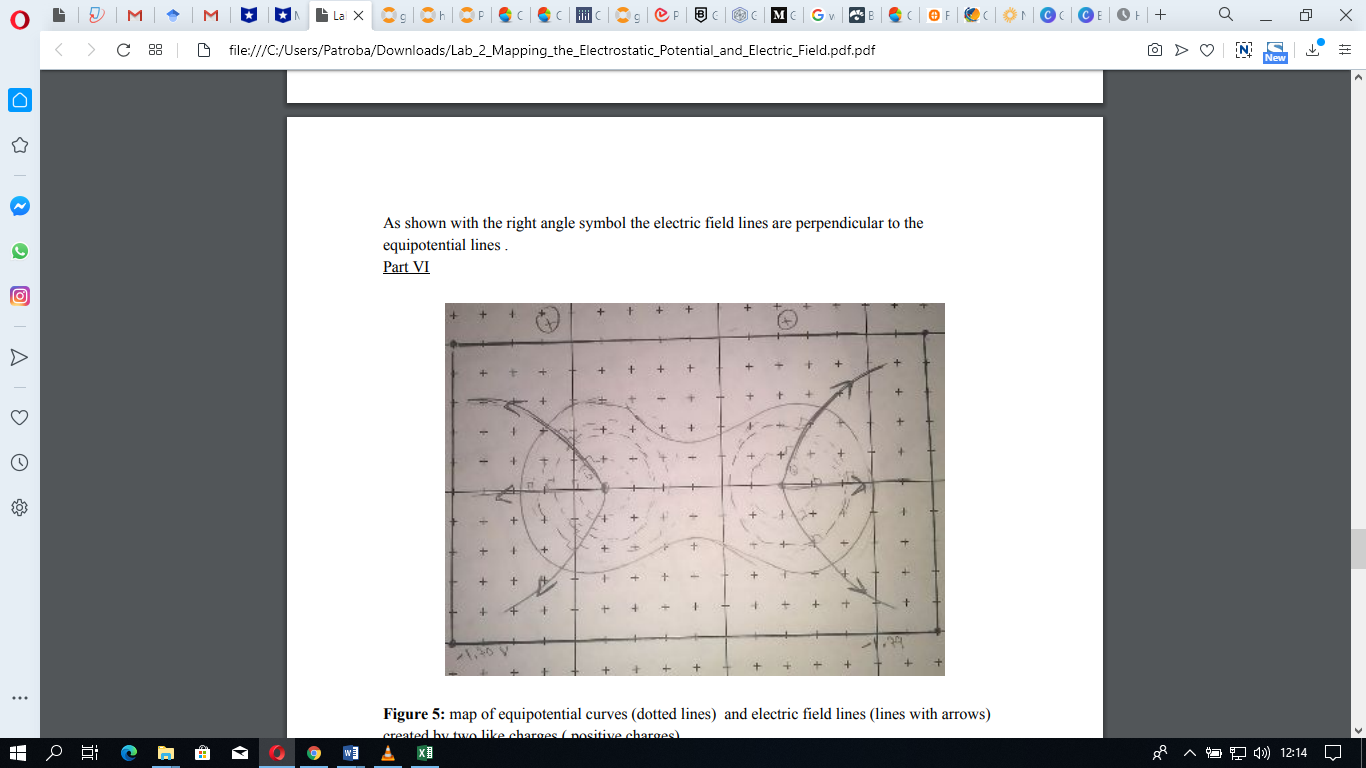
Electric field lines are normal to the equipotential lines.
Part III
There is a high potential close to charges and low potential as one moves far away from the charges. The electric field is also seen to be perpendicular to equipotential.
Part IV
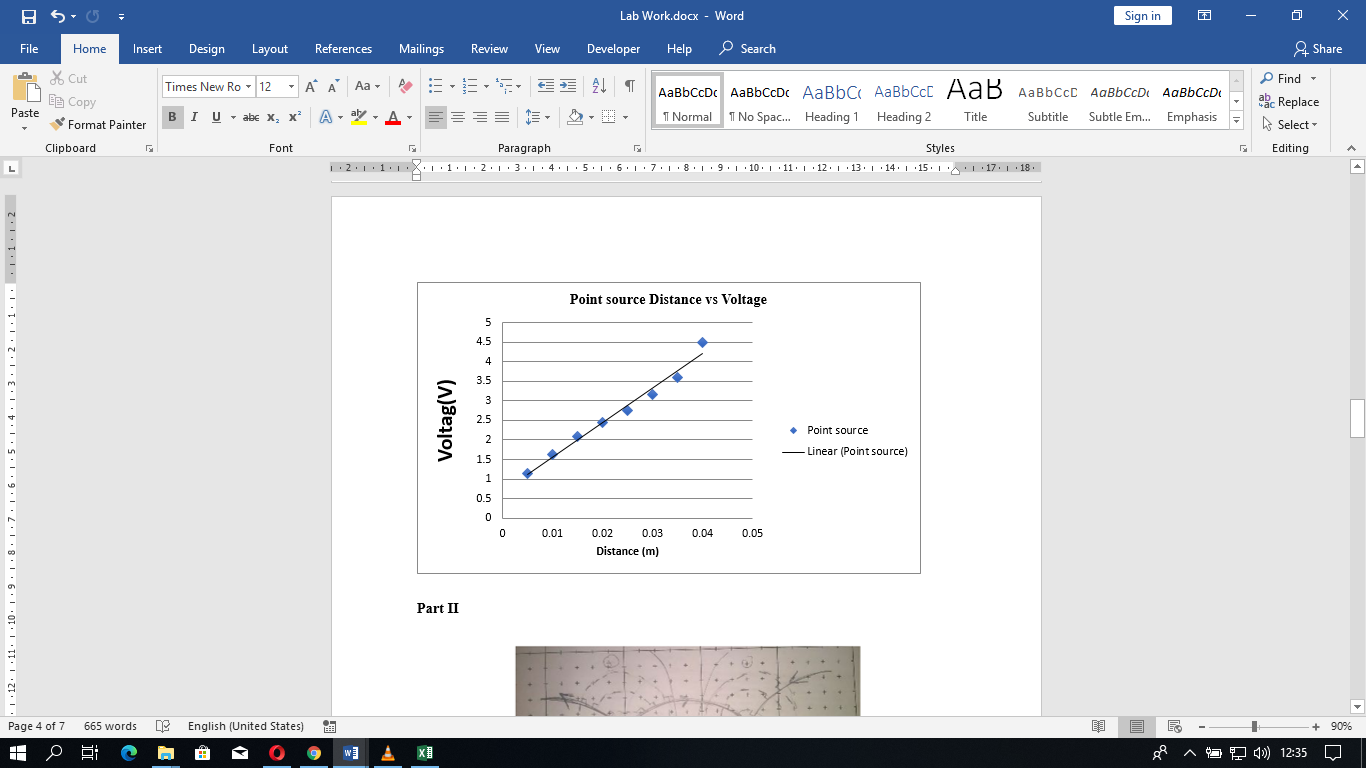
Data for point source and guard ring
| Distance (m) | Potential (V) |
| 0.005 | 1.139 |
| 0.01 | 1.624 |
| 0.015 | 2.08 |
| 0.02 | 2.76 |
| 0.025 | 3.15 |
| 0.03 | 3.6 |
| 0.04 | 4.5 |
Graph
Possible Sources of Errors
The absence of data points taken for potential differences can enhance inaccuracy in potential difference vs. distance graph also, constant fluctuation in multimeter results in the inability to offer precise potential value.
Questions
Question 1
Any reference point that lies within the parallel lines results in an equipotential similar to parallel plates. The potential
Question 2
If a different reference point were selected, any reference point within the lines would eventually result in equipotential since plates are parallel.
Question 3
No. The potential does not vary. This is because there is no interaction between the positive and the negative charges.
Question 4
Equipotential lines look like curves that progress in half circles. The unique equipotential line is the one that is vertically right in the middle of the two charges.
Question 5
The potential is furthest from the relative halfway point while it's very close to the positive electrodes. Potential does not vary outside the box because the box creates a boundary of the electric field.
Question 6
About the graph, an increase in distance results in a decrease in potential.
Potential and inverse are inversely proportional—an increase in distance results in a decrease in potential.
Conclusion
The experiment enhances familiarity in the discipline of the electric field as well as equipotential curves that result from charges. This is best understood by mapping the lines in many configurations. The students also enhance their skills necessary in connecting simple circuits.


