Situation Assessment and Analysis (1–3 pages) In your first assignment your team conducted a SWOT analysis for Allround. Work within your team to update your SWOT analyses based on what you know at th
‘

.
| Industry Outlook - Year 7 | ||
| Economic Outlook for the Industry | ||
| Current | Forecast | |
| Population Growth | 0.9% | 0.9% |
| Industry Growth | 4.1% | Same |
| Inflation Rate | 3.8% | 5.0% |
| Distribution | ||
| % Direct | 64.1% | |
| % Wholesales | 35.9% | |
| Cost of Sales Force | ||
| Sales Rep Salary | $38,092 | |
| Average Expenses | $19,046 | |
| Training | $12,697 | |
| Cost of Marketing Research | ||
| Test Market | $126,973 | |
| Consumer Survey | $126,973 | |
| Operating Statistics | $57,138 | |
| Sales Force | $25,395 | |
| Advertising | $44,441 | |
| Digital Marketing | $44,441 | |
| Promotion | $44,441 | |
| Channel Sales | $31,743 | |
| Pricing | $25,395 | |
| Shopping Habits | $19,046 | |
| Shelf Space | $31,743 | |
| Recommendations | $25,395 | |
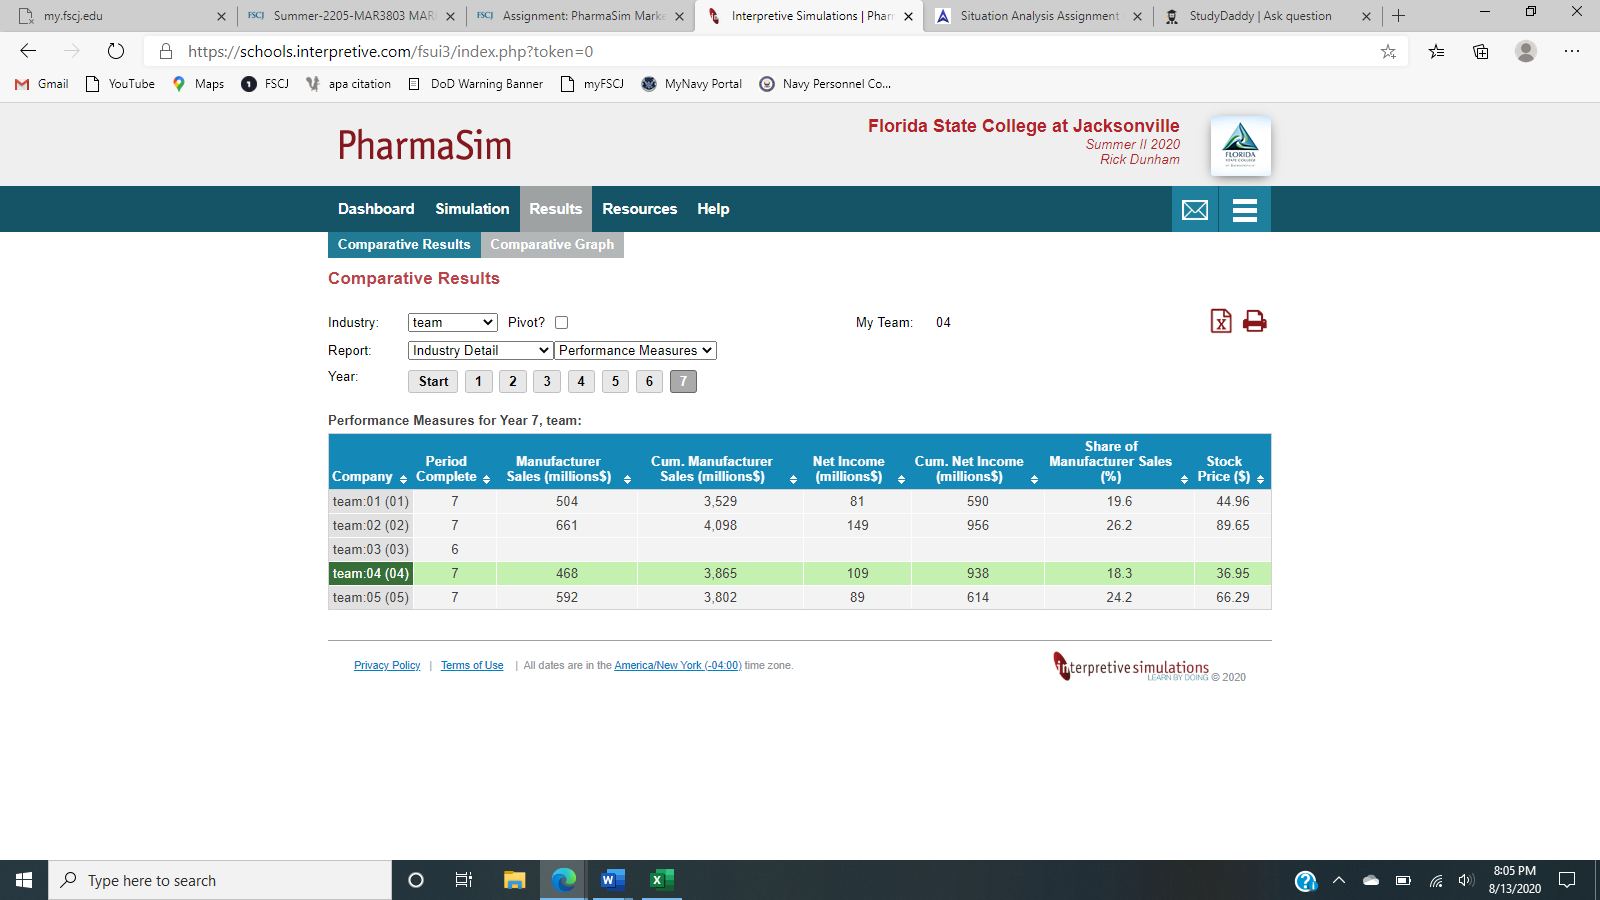
| Performance Summary - Year 7 | ||||||||||||||||||||||||||||||||||||
| Summary of Results | Selected Industry Data | |||||||||||||||||||||||||||||||||||
| Allround | AllroundPlus | Total | ||||||||||||||||||||||||||||||||||
| Mfr. Suggested Retail Price | $6.75 | $5.46 | Total Manufacturer Sales | $2,554.9 | ||||||||||||||||||||||||||||||||
| Average Discount | 18.6% | 23.4% | 19.7% | Total Unit Sales | 633.2 | |||||||||||||||||||||||||||||||
| Unit Sales | 66.4 | 24.6 | 91.0 | Total Sales Force Spending | $80.3 | |||||||||||||||||||||||||||||||
| Manufacturer Sales | $364.7 | $103.0 | $467.7 | Total Advertising Spending | $147.3 | |||||||||||||||||||||||||||||||
| Promotion Allowance | $58.4 | $15.4 | $73.8 | Total Digital Marketing Spending | $17.2 | |||||||||||||||||||||||||||||||
| Cost of Goods Sold | $92.8 | $31.5 | $124.3 | Total Promotional Spending | $82.5 | |||||||||||||||||||||||||||||||
| Gross Margin | $213.6 | $56.0 | $269.6 | Total Net Income | $618.8 | |||||||||||||||||||||||||||||||
| Promotional Expenditures | $11.0 | $5.8 | $16.8 | Note: dollar amounts (except Manufacturer Suggested Retail Price, Stock Price, and Marketing Efficiency Index) are in millions. | ||||||||||||||||||||||||||||||||
| Advertising Expenditures | $21.6 | $4.8 | $26.4 | Unit Sales values are in millions. | ||||||||||||||||||||||||||||||||
| Digital Marketing Expenditures | $2.6 | $1.0 | $3.6 | Shelf space is shown in linear feet. | ||||||||||||||||||||||||||||||||
| Product Contribution | $178.4 | $44.4 | $222.8 | |||||||||||||||||||||||||||||||||
| Sales Force | $20.6 | |||||||||||||||||||||||||||||||||||
| Administration | $15.4 | |||||||||||||||||||||||||||||||||||
| Fixed Costs | $77.8 | |||||||||||||||||||||||||||||||||||
| Net Income | $109.0 | |||||||||||||||||||||||||||||||||||
| Cumulative Net Income | $938.2 | |||||||||||||||||||||||||||||||||||
| Stock Price | $36.95 | |||||||||||||||||||||||||||||||||||
| Marketing Efficiency Index | $1.62 | |||||||||||||||||||||||||||||||||||
| Capacity Utilization | 75.9% | |||||||||||||||||||||||||||||||||||
| Share of Retail Sales | 14.2% | 4.1% | 18.3% | |||||||||||||||||||||||||||||||||
| Share of Mfr. Sales | 14.3% | 4.0% | 18.3% | |||||||||||||||||||||||||||||||||
| Share of Unit Sales | 10.5% | 3.9% | 14.4% | |||||||||||||||||||||||||||||||||
| Average Shelf Space | 1.8 | 1.2 | ||||||||||||||||||||||||||||||||||
| Trade Rating | 7.3 | 6.7 | ||||||||||||||||||||||||||||||||||
| Brand Awareness | 86.7% | 54.1% | ||||||||||||||||||||||||||||||||||
| Consumer Satisfaction | 65.5% | 49.0% | ||||||||||||||||||||||||||||||||||


