Please have a look at my assignments
Delete this page before submission
MATH 1053 - Quantitative Methods for Business
Assignment 1 (SP5 2020) DUE: Thursday 10th September at 10:00 AM (Morning)
This assignment must be completed using this template.
You may add extra sections to this template, change the visual style including font, colour, you can add a company logo, extra figures, tables, etc., as you see fit, however the questions must be answered in either the Report Body or Appendix, as indicated in this template, otherwise the answer will not be marked.
Submission Instructions
Assignment submission is via learnonline. If you have problems submitting, keep proof of your submission attempt and shoot me an email at [email protected]
Once submitted do not edit any electronic files of your work.
Assignment Instructions
This assignment covers Weeks 0-3 and counts for 15% of your overall grade:
| Assignment component | Mark |
| Business report | 40 |
| Appendix | 50 |
| Presentation | 10 |
| TOTAL | 100 |
Assignments submitted late, without an extension being granted, will attract a penalty of 10 marks per each working day or any part thereof beyond the due date and time. Please refer to the Course Outline for the course policy regarding extensions.
An incorrectly or partially filled cover sheet will result in lost marks and delays in the marking and return of your assignment.
Not deleting the pages/text as requested will result in a loss of presentation marks.
Your assignment submission should be typed and observe the page limits. Hand-written answers will be disregarded.
Delete this page before submission
Delete this page before submission
Plagiarism
If you are unsure about what constitutes Academic Integrity after reading the information below you are always welcome to check with us before submitting.
Plagiarism is a specific form of academic misconduct. We encourage and support working in groups and seeking help, however your final submission must always represent your individual work, opinions and recommendations.
If plagiarism is found, all parties involved will be penalised. You need to retain all your assignment computer files (Excel, Word etc.), which must remain unchanged after submission, for the purposes of checking, if required.
Plagiarism covers, but is not limited to, the following actions:
Direct copying of the work of other persons, from one or more source, without clearly indicating the origin;
Sending your files to another student for any reason whatsoever, even for the purposes of checking or comparing work;
Submitting another student’s work in whole or in part;
Submitting work that has been written by someone else on the student’s behalf;
Copying computer files without clearly indicating their origin;
Submitting work that has been derived, in whole or in part, from another student’s work by a process of mechanical transformation (e.g. changing variable names in computer files, paraphrasing);
A group-based effort to produce one assignment shared between individuals. Working together is encouraged, however each written assignment submitted by each student must be written in its entirety by the individual student, including running analyses, producing Excel spread sheets other than the templates provided on the Course website and report writing. Working together where one individual types the collective thoughts of a group/produces analyses and/or spread sheets and then shares these files will be investigated for plagiarism.
All parties found to be involved in academic misconduct will incur, if appropriate, a penalty and a record in the University's Academic Integrity Database (UniSA Assessment and Procedures Manual 2020, Section 9, Clause 9.2.3 i.).
Delete this page before submission


Q-Constructions – building your future
Q-Constructions is a company that is trying to get the edge in and be recognised on the forefront of building custom construction projects. The company’s strategy is to use mathematical techniques to produce accurate insights that can increase their profits, inform their clients and provide them with the most affordable contracts.
You have just been recruited by Q-Constructions to work in the back office to analyse and provide insights into their business model across project management, marketing and financial analysis. They believe you possess the skills to deal with their data and the number crunching mind to propel the company forward – lucky you!
The big boss has a list of tasks and objectives for you to get started with which are highly relevant to the company’s progression. The first task is to analyse the past financial data and produce insights on their yearly profit margins. It is noticed that someone didn’t do their job correctly and forgot to lodge their net profit a few years back, so you will have to use your maths skills to figure it out.
The company has received a fairly large commercial building proposal that they want you to analyse and assess its financial viability and whether they should proceed. They have provided you with the cash-flow breakdowns per month for the length of the project for your analysis. Another important question they want you to determine is at what stage in the project proposal is needed to be completed such that it will be financially viable.
Finally, they usually have a few projects on the go at any one time during a financial year, they need you to analyse the number of projects they need per year to break-even. They can see that the hard-working onsite workers have been in contact with the construction union and feel like they deserve a pay-rise and their salary should be converted to a percentage of a project price. Otherwise, they are ready to strike if their demands are not met. Q-Constructions need to ensure the workers’ demands are meet and provide them with important insights. On the other hand, the company has ongoing costs and they need to be covered, and profit needs to be made overall to keep moving forward.
The company is funded by some confidential investors, and they don’t want the developments you will be working on getting out! They are relying on your Quants knowledge so far to solve their problems. They have granted you access to the internet to use Google and calculators too, however; they don’t want you sharing secrets with your friend who might be working at a rival company.
They are currently planning their incentives for you as well…because happy staff means positive results and they want to build your future…so a coffee and muffin is on them plus the potential of 15% raise on your course . ![]()
![]()
|
| UNIVERSITY OF SOUTH AUSTRALIA Assignment Cover Sheet – Internal |

An Assignment cover sheet needs to be included with each assignment. Please complete all details clearly.
When submitting the assignment online, please ensure this cover sheet is included at the start of your document. (Not as a separate attachment.)
Please check your Course Information Booklet or contact your School Office for assignment submission locations.
| Name: | |||||||||||
| Student ID |
|
|
|
|
|
|
|
| |||
| Email: | |||||||||||
| Course code and title: MATH 1053 – Quantitative Methods for Business | |||||||||||
| School: Info. Tech. & Mathematical Sciences | Program Code: | ||||||||||
| Course Coordinator: Dr Nick Fewster-Young | Tutor: | ||||||||||
| Day, Time, Location of Tutorial: | |||||||||||
| Assignment number: 1 | Due date: by 10 AM, Thursday 10th September, 2020 | ||||||||||
| Assignment topic as stated in Course Outline: Case Study Report | |||||||||||
Further Information: (e.g. state if extension was granted and attach evidence of approval, Revised Submission Date)
|
|
I declare that the work contained in this assignment is my own, except where acknowledgement of sources is made.
I authorise the University to test any work submitted by me, using text comparison software, for instances of plagiarism. I understand this will involve the University or its contractor copying my work and storing it on a database to be used in future to test work submitted by others.
I understand that I can obtain further information on this matter at http://www.unisanet.unisa.edu.au/learningconnection/student/studying/integrity.asp
Note: The attachment of this statement on any electronically submitted assignments will be deemed to have the same authority as a signed statement.
| Signed: | Date: |
| Date received from student | Assessment/grade | Assessed by: | |
| Recorded: | Dispatched (if applicable): | ||
[ENTER REPORT TITLE INCLUDING THE NAME OF THE COMPANY]
Delete this page before submission
The report length needs to be as follows:
Introduction: At most 3 paragraphs where 1 paragraph is 3-5 sentences.
Should appear on a separate page as indicated in the template
The introduction should discuss the aims of all sections of the report
Infographic: Exactly 1 page as indicated and with the elements in the presented order
The infographic should start on a separate page after the introduction
The infographic must contain the elements indicated in the allocated spaces.
DELETE the text in < > as indicated in the infographic
You are welcome to customise/decorate the rest of this area as you like
Report Body: A maximum of 1 page of writing, excluding the infographic.
Ensure you stay within these limits.
The report body should start on a separate page after the infographic
Use the questions given to guide your discussion of the results in Appendices 1-3.
Clearly stated results and interpretations will help to earn maximum presentation marks.
Do not include numerical calculations or spreadsheets
Do quote quantitative (the final answer!) results.
You should have no more than 1 page of writing (the infographic is excluded )
Conclusion & Recommendations: At most 2 paragraphs where 1 paragraph is 4-6 sentences. You should discuss the analyses that were presented for all three report body questions and provide recommendations.
Should appear on a separate page as indicated in the template
The conclusion summarises the results – do not introduce new information although recommendations are fine
Font Type: up to you, but keep in mind it should be easy to read – make it easy for us to give you marks!
Font Size: minimum 11pt (it shouldn’t look smaller than this!)
Any text or font size smaller than this sentence will incur 0 marks.
(this is too small! Don’t make your text this small!!! )
Delete this page before submission
Delete this page before submission
Suggested Assignment Work Timeline
If you’re not sure how to start the assignment,
a suggested work breakdown schedule is below + course resources you can use.
Feel free to use it (or ignore it) as you like
Some people like to complete each appendix and then write it up in the report, others prefer to complete all appendices and then write up the report in one go. Do whichever suits you!
The weeks below indicate a suggested work breakdown by week as well as which week the lecture covers the material.
The report can be written at any time (we don’t cover this in lectures ).
Week 2: Appendix 1 (Week 0 notes). Easier
You’ll need the Excel booklet + the Excel Videos page on the course website.
Week 2/3: Appendix 2 (Week 2 notes). Medium
We have an NPV Excel spreadsheet on the course website. Go to the lecture notes page and check out the Week 2 section.
The accompanying lecture recording for Week 2 will give a demonstration of the NPV Excel spreadsheet. Hour 2 is the place to go to.
Week 3/4: Appendix 3 (Week 3 notes) Medium
The accompanying lecture recording for Week 3 will give a demonstration of graphing in break-even including what each column formula means. Also, Hour 2 of the lecture is the place to go to.
If you want to use an Excel template, we have a break-even spreadsheet on the course website. Go to the lecture notes page and check out the Week 3 section and you can download it there.
Week 4: Report body write-up and SUBMIT! Yay! Relax and get a coffee Harder
Delete this page before submission
Introduction
(2 marks)
Purpose
Provide a qualitative description of report contents/problems addressed in the report (covering Appendices 1-3) and what insights the analyses will provide.
Write this introduction after you have a clear understanding of the content of your report.
Ensure you have explained what the report will contain. Follow the length guideline: at most 3 paragraphs, each with 3-5 sentences.
Highlight and delete this message before submission
[Delete the blue box and write your introduction on this page]

Infographic
<student network ID – you can customise the rest as you like >
Make this look pretty
The infographic is worth 6 marks.
Delete this text before submission
<Insert the Column Chart from Appendix 1(b) (delete this text)>

<Insert the cashflows bar chart Appendix 2(d) (delete this text)>
<Insert the break-even graph Appendix 3(f) (delete this text)>
Report Body
(8 Marks) Q-Constructions Financials
By referring to the column chart (Appendix 1(b)), discuss the overall financial trends over the years. Draw a general observation quoting values from the chart (Appendix 1(b)).
By referring to the sparkline (Appendix 1(c)), explain why there is a negative value for the sparkline and include it to support your discussion.
Based on the analysis, what can you conclude about the future of Q-Constructions? Explain briefly and refer to the sparkline to support your discussion. (Appendix 1 (a), (c))
3 + 3 + 2 marks
(10 Marks) New Project Financial Viability
Loss of Marks! will occur if you use the words: present value, number of compounding period, or any variant thereof, in the discussion below.
In the worst-case scenario, state the total amount of interest Q-Constructions would need to pay on the upfront initial outlay loan of $200,000 taken out and the interest rate. (Appendix 2(a))
Briefly discuss the proposed cash flows for Q-Constructions each month. Ensure to refer to the infographic (bar chart) to support your discussion.
State whether Q-Constructions should accept the project and the overall value in terms of today of this project’s proposal including the current cost of capital (Appendix 2(b)).
Explain, if possible, when Q-Constructions would receive a positive return on the project and why (Appendix (c)).
2 + 3 + 3 + 2 marks
(12 Marks) Projects, projects and workers’ salaries.
Loss of Marks! will occur if you use words such as ‘variable cost’ or contribution margin’ or any variant thereof, in the discussion below. Use everyday language. For full marks – use the following words: ‘cost per ride’ and ‘profit per ride’.
Briefly explain the key information such as the combined fixed & variable costs, the revenue per project per year.
Explain how many projects are required to break even per year. Make reference to the break-even graph in the infographic as part of your discussion. (Appendix 3(a), (f)).
Provide the insights of your analysis in relation to the number of projects that Q-Constructions should complete to make $500,000 profit per year. (Appendix 3 (b))
If Q-Constructions meet the demands of the workers, summarise the analysis and the insights obtained in relation to the changes across the company. Ensure you quote the percentage that the onsite workers’ require now, the new break-even number and the number of projects required to achieve their target of $500,000 (Appendix 3(c), (d)).
Explain whether Q-Constructions will be financially profitable in the future if they decide to adjust to the demands of the workers requirements (Appendix 1, 3 (c), (f)).
3 + 2 + 2 + 3 + 2 marks
Highlight and delete the above question text before submission
Start the Conclusions and Recommendation section on a separate page.
Conclusions and Recommendation
(2 marks)
Conclusion: Summarise the main findings of your report: base this on your discussion.
Do not introduce new information in the conclusion.
Do not use direct quotes. Indicate whether the report fulfilled the purpose as stated in the introduction.
Recommendation: Base these on your conclusion. Do not introduce new information in the recommendation. Present options for resolving the issue (purpose) presented in the introduction. Be brief – use dot points.
Highlight and delete this question text before submission
Appendix 1 - [Enter a suitable appendix name]
Highlight and delete the question text below before submission.
Include full details of your working out in this appendix.

Insights into the Financial Profit of Q-Constructions
A key to success of any business is to analyse their yearly profit margins and monitor performance. Each financial year, the figures are punched into a spreadsheet and glanced over to ensure the company is on track to produce a continual positive outlook surrounding the company and their clients. However, we all know that numbers always tell the truth and they want you to provide the hard facts and insights into their feeling of success. In addition, to analysing their financial outlook, they require you to portray the data visually. Table 1 is the data provided to you from the main spreadsheet describing the Net Profit figures and the Relative Percentage Change over the last 10 years. Unfortunately, it has some gaps that they need you to calculate!
(6 marks) It has come to your attention that someone in the company has not been consistent in entering financial data – some years are missing the relative percentage change or the net profit as presented below in Table 1. You are required to calculate the Relative Percentage Change in the company for the blanks below and the Net Profit for the other blanks.
Hint! it’s easier to convert a % to a number before commencing the calculation and ignore the percentage part of the calculation, i.e. where you multiply by 100%.
Show all working out below including the formula used for each year and include the completed table here.
| Year | 2010 | 2011 | 2012 | 2013 | 2014 | 2015 | 2016 | 2017 | 2018 | 2019 |
| Net Profit ($ 000’) | <blank> | 50 | 200 | 150 | 225 | 250 | <blank> | 200 | 250 | 260 |
| Relative Percentage Change | N/A | -50% | 300% | <blank> | 50% | 11% | -30% | 14% | 25% | <blank> |
Table 1: Net Profit ($) per financial year
(2 marks) Using Excel, create a column chart of the Net Profit calculated in part (a) for the years 2010-2019. For full marks, label the axis and provide an appropriate title. Please include it here, however, you will also use it in the infographic.
Hint! Instructions on how to create a column chart is on the course homepage under Excel videos and the Excel Supplement booklet.
(2 marks) Using Excel, create a Sparkline of the Relative Percentage Change calculated in part (a) for the years 2011-2019. For full marks, use the Sparkline options to mark if there are any negative values and include a horizontal axis to easily visualise changes. The sparkline should be included here however you will also use it in the report body text.
What is a sparkline I hear you ask? A sparkline is a tiny graph that appears in text ![]() like this – exciting!!! You can customise them to change the line colour and individual marker colours as well – I know how good is that?!?
like this – exciting!!! You can customise them to change the line colour and individual marker colours as well – I know how good is that?!?
EXCEL Instructions:
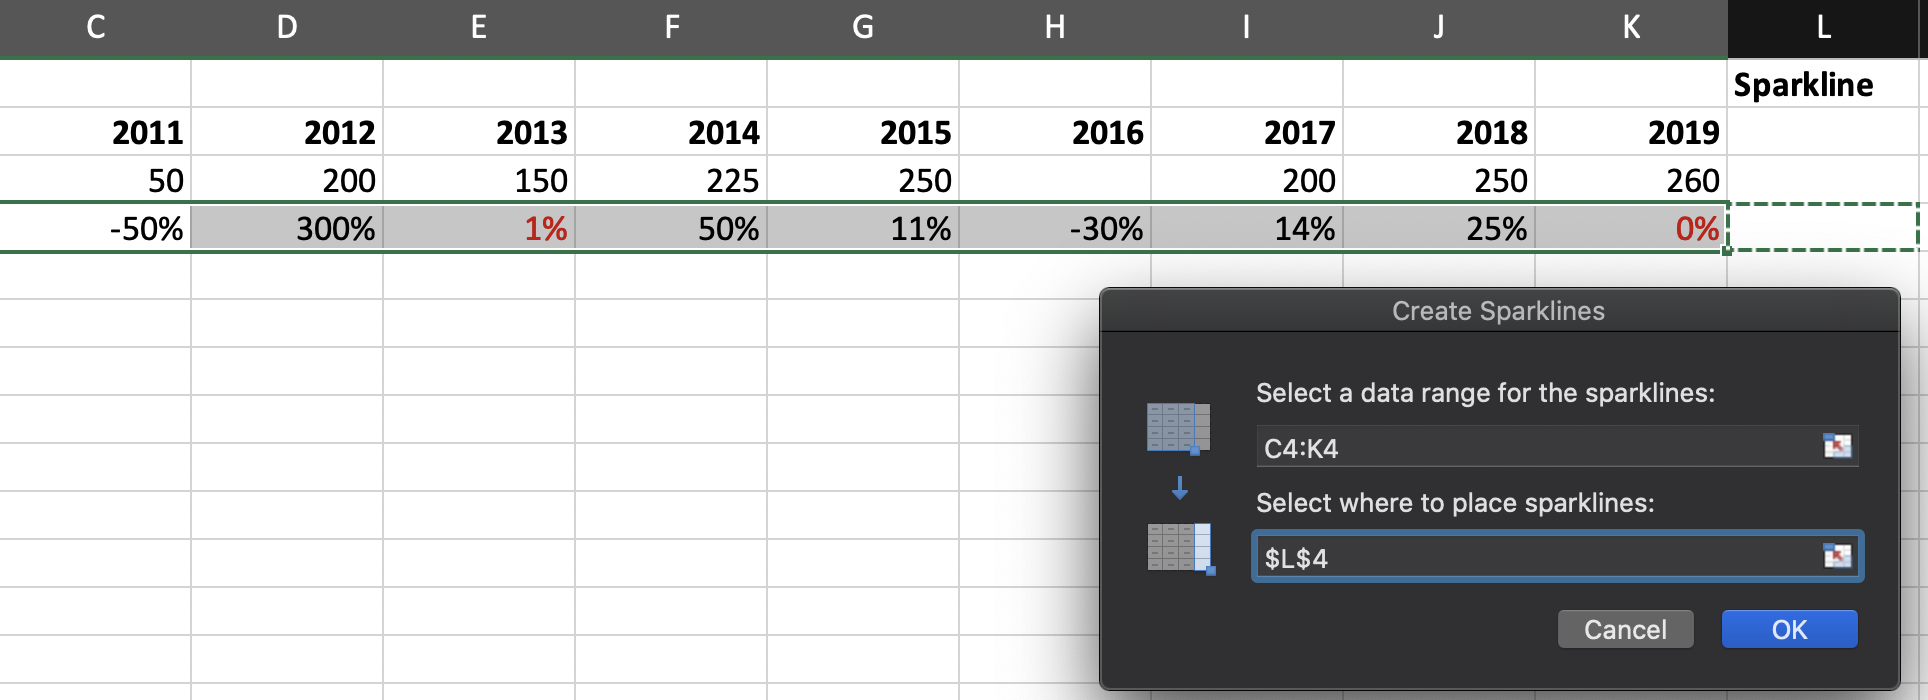
In Excel select your calculations as shown below – the values used here are not blank!
![]()
To create the sparkline go to Insert then Sparklines and select Line:
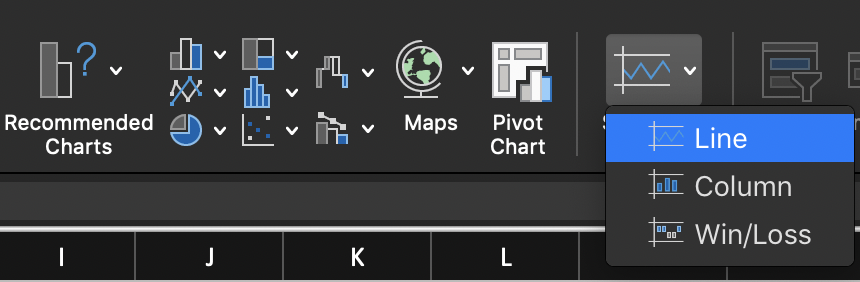
You should see something similar to the window below – select the location for the sparkline (I chose E8 however you can place the graph anywhere). Press OK and a sparkline will appear after clicking OK.
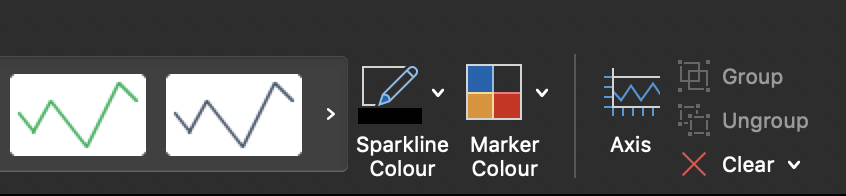
Customise the sparkline using the Sparkline Colour and Marker Colour menus. Highlight the lowest and highest points using two different colours to the rest of the points:
You’ve got a sparkline for your report! Hint! take a screenshot of the sparkline and crop it as these scale giving better visual presentation
For full marks include a screenshot of your Excel spreadsheet showing:
The variable names with your initials added. Also include the years in your set-up;
Your entered values and the corresponding sparklines.
TOTAL 10 MARKS
Please provide the requested non-quantitative analysis in the report body.
Highlight and delete the above question text before submission
Appendix 2 - [Enter a suitable appendix name]
Highlight and delete the question text below before submission.
Include full details of your working out in this appendix.


After analysing the financial data of Q-Constructions, you notice that they are trending in the right direction. A new 12-month construction proposal has come to the company worth $1,000,000 and an important question is whether it will be financially viable. They want you to analyse the proposal, in particular, the recommended cash flow schedule and to understand the key financial points during the construction project. The following cash flow schedule is summarised below.
To ensure that all upfront and on-going outlay costs are covered in advance, Q-Constructions incur an initial start-up cost of $200,000. The proposal states that they will receive a deposit from the client of 10% of the total project price at the beginning. They then receive four equal instalment payments of 20% of the total project price associated to project milestones from the client at the end of the 2nd, 6th, 8th and 10th month. Finally, they receive the last 10% project milestone on lock-up which occurs at the end of the 12th month. Q-Constructions has ongoing project costs of $20,000 to pay salaries and services at the end of each month. In additional, there are material costs of $100,000 associated for each of the project milestones at the end of the 2nd, 6th, 8th and 10th month. The current cost of capital for company is 8% per annum compounded monthly. You have been tasked with the important objective to determine whether this future project is financially viable. In addition, they want you to determine which milestone is needed to be completed in the project proposal such that it will be financially viable. It’s time to show your Quants knowledge and expertise with Excel to determine the financial viability of this project.
(4 marks) In a worst-case scenario where the project does not proceed, and the initial outlay is paid. Calculate the amount of interest that would have accrued on an amount of $200,000 at the end of 12 months with an interest rate of 8% p.a compounded monthly. Do not use EXCEL for this calculation.
(6 marks) Set up a cash inflow and outflow for the 12-month construction project proposal based on the information provided by the company above. By using the current 8% p.a compounded monthly cost of capital, calculate the Net Present Value of this proposal and whether it is financially viable project. Use EXCEL to calculate the net present value of the current situation.
For full marks show:
The full spreadsheet with all completed entries. Show how you entered cash inflow and cash outflow amounts at the beginning, 1st, 2nd, 3rd months. You can type this in Word.
The NPV calculation (showing the calculation via the Excel function NPV and Excel cell references is OK). You can show this either in the spreadsheet or type it in Word.
EXCEL Instructions: Set up your spreadsheet as below and add your initials to column names (i.e. unless your initials really are NFY!). The coloured boxes below contain instructions. We used the NPV function in Lectures (Week 2) – see lecture recordings for a demonstration.
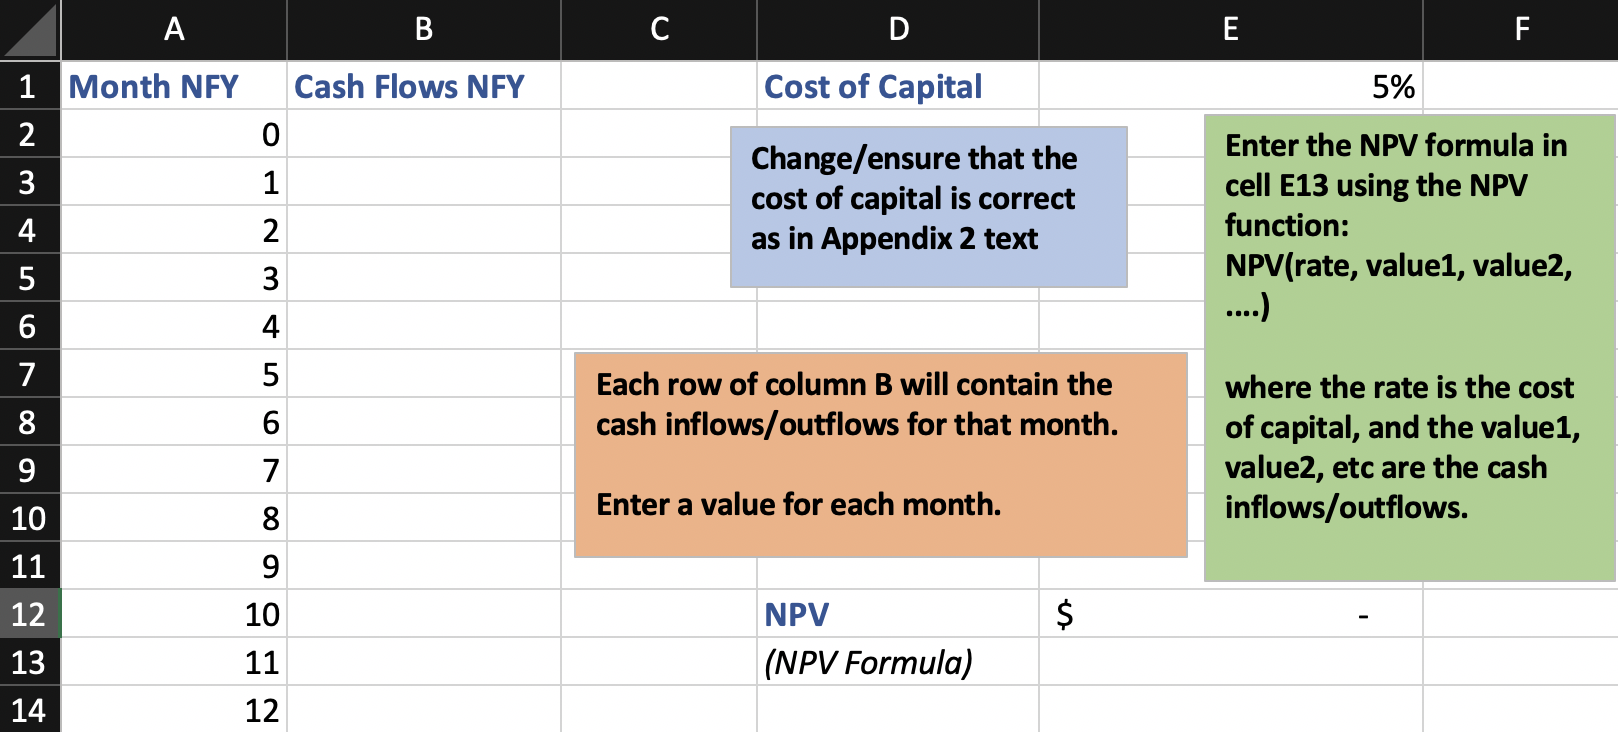
(4 marks) The company wants to know at which milestone in the project proposal would be financially viable if the contract has terminated was early. Determine the milestone in the construction proposal for which the project would be financially viable.
Hint: By using the NPV function in Excel and your cash flows in part (b), calculate the NPV if the project finished at the end of the 6th and 8th month in the proposed contract.
(2 marks) Q-Constructions would like you to create a visualisation of the completed NPV spreadsheet from part (b). Include the graph here and in the infographic as indicated.
EXCEL Instructions:
Select your completed spreadsheet as shown below for months 0-12. Note the values shown in the screenshot are not correct and you should use the correct values from (b).
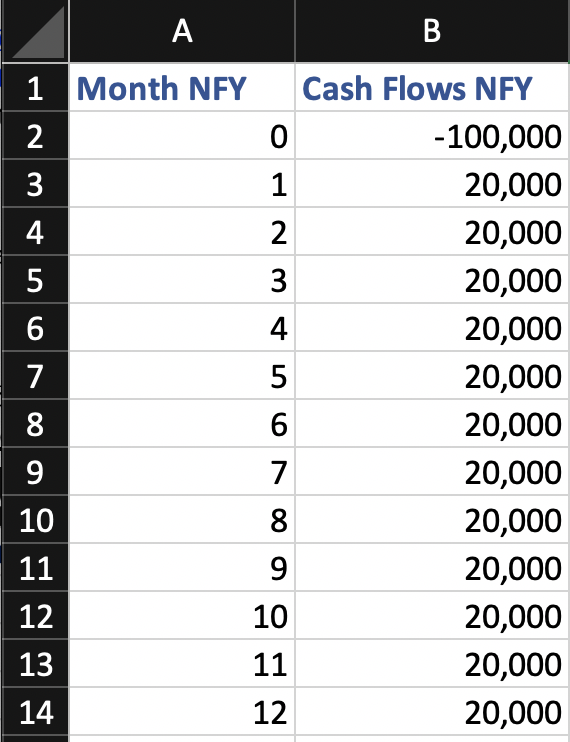
Go to Insert > Recommended Charts (below, top) and then choose Bar Chart (below, bottom) and click OK – you will get a chart similar to the one below. Your chart will look a bit different – that’s OK because you’re using the correct values!
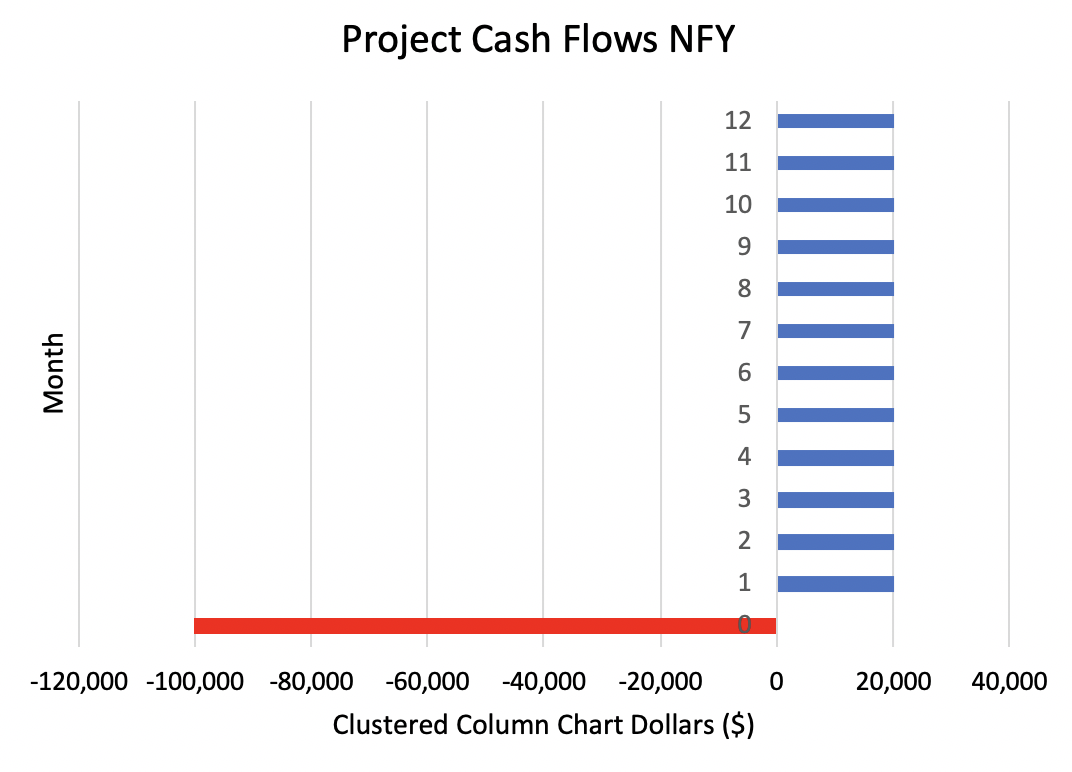
Customise with a meaningful title including your student network id and an x-axis label. Using a text box, annotate the graph with the Net Present Value of the project.
TOTAL 16 MARKS
Please provide the requested non-quantitative analysis in the report body.
Highlight and delete the above question text before submission
Appendix 3 - [Enter a suitable appendix name]
Highlight and delete the question text below before submission.
Include full details of your working out in this appendix.


Projects, projects and workers’ salaries!
Q-Constructions has tasked you to investigate the number of construction projects per year for which the company would need to break-even and make a profit of $500,000 per year. The average price of a building contract is $700,000 per project. The following are the fixed and variable costs of Q-Constructions in Table 2:
| Description | Cost |
| Office Space | 55,000 |
| Professional Staff Salaries | 205,000 |
| Insurances | 50,000 |
| Machine Maintenance | 80,000 |
| Website Management | 30,000 |
| On-site workers’ salaries | $120,000 per project |
| Average Material Cost | 60% of the project price per project |
Table 2: Associated Costs of Q-Constructions
Use this information above to complete the requested analyses below.
(5 marks) Calculate:
The break-even number of projects needed by the company.
The income made by the company at break-even.
Show all working out including the modelling and solution steps.
(3 marks) Q-Constructions is interested in making a profit per year to ensure the company has a positive financial outlook and new ventures can be done in the future. Calculate how many projects per year need to be completed to make a profit of $500,000 per year.
(6 marks) Q-Constructions workers’ have approached the building union and been informed they could be paid a higher salary and want their salaries to be determined based on a percentage of the project price. The company has reviewed their historical records on the number of projects per year and has made the decision to respect the workers’ demands and notice that the company would maintain a positive financial outlook if they set their break-even target at 4 projects per year. Determine the new salary percentage for the onsite workers’ on a project price based on the company’s average project price and associated costs in Table 2.
(3 marks) Based on the new on-site workers’ cost per project from part (c), calculate the new number of projects that need to be completed to maintain a profit of $500,000 per year.
(3 marks) Due to the change in the on-site workers’ salaries, what is the effect on contribution margin in relation to the variable cost? Explain the effect of this change on the break-even number in part (a).
Hint! Your discussion should focus on the impact made by the contribution margin. You can show the calculation of the contribution margin to support your discussion, but no other calculations should be used.
(4 marks) In Excel, produce a break-even graph for Q-Constructions and include it here – you will also include a copy in the infographic where requested.
There will be 3 lines on the Q-Constructions Break-Even graph: one for total revenue for Q-Constructions and two representing the original total cost and the new total cost for Q- Constructions.
On the graph, identify the general regions corresponding to profits and losses. The units along the x-axis will be the number of projects. The units along the y-axis gives the revenue in dollars.
Want a video how-to on producing a break-even graph?
We demonstrated this with a detailed explanation in the Week 3 lecture – check out the second hour of your class’ recording.
The instructions below tell you what to name each column and other important details so keep reading!
Excel Instructions:
Create a column called Number of Projects and enter values from 0 to 20 in single unit increments for Q-Constructions analysis. This column plays the role of ‘x’ in break-even calculations.
Create four more columns: Total Original Cost, Total New Cost, Total Revenue, Total Profit and add your initials to these column names. In each of these columns, enter appropriate formulae in EXCEL to obtain the total cost and total revenue corresponding to each value in the Number of Projects column.
Highlight all the columns and go to Insert Charts Scatter to obtain a graph. Label the graph appropriately (i.e. title, axis labels, legend) and ensure the chart title includes your network ID (the part of your email address before @ e.g. [email protected] has the network ID jbloggs).
TOTAL 24 MARKS
Please provide the requested non-quantitative analysis in the report body.
Highlight and delete the above question text before submission


