Please answer all the questions with the correct answers in the attachment files.
Using the "Atom" screen on the simulation above, determine the following:
Group of answer choices
Which particles determine the element you build?

Which particles affect the charge of the atom or ion?
Which particles affect the mass number of the atom or ion?
Atom Screen
Develop rules for determining:
a) the charge of an atom/ion
b) the mass of an atom/ion
Build a model of hydrogen. Can you place the electron in the outermost orbital? Suggest an explanation for your observation.
Game Screen:
Using the "Game" screen on the simulation above, practice applying your understanding by playing the 1st and 2nd levels on the game screen (the following two icons):

Using the "Symbol" screen on the simulation above, determine which particles affect each component of the atomic symbol.
Group of answer choices
a

b
c
d
Using the "Game" screen on the simulation above, practice applying your understanding by playing the 3rd and 4th levels on the game screen (the following two icons):

In addition to atomic symbol, we can represent atoms by name and mass number. Complete the table below (spelling counts). Do not include spaces between the name-dash-number:
| Symbol | Name |
|
| Carbon-12 |
|
|
|
|
|
|
Atom Screen
Using the "Atom" screen on the simulation above, play with the simulation to determine the following:
Group of answer choices
Which particles affect the stability of the atom?
Which particles do not affect stability?
Atom Screen
What are the names of the stable forms of oxygen?
a) Oxygen-16
b) Oxygen- 
c) Oxygen-
The atoms in the previous question are all isotopes of each other. Based on this, what are the requirements for two atoms to be isotopes of each other?
They must have the same number of but a different number of .
Apply your knowledge gained from the PhET simulation by filling out the following table: You may have to use the "Tab" key to access the last few columns:
| Name | Symbol | Atomic Number | Mass Number | Charge | Number of Protons | Number of Neutrons | Number of Electrons |
|
| |||||||
|
| |||||||
| Sodium-22 |
| 11 | |||||
|
| 47 |
Part 2: Atomic Emission Spectroscopy
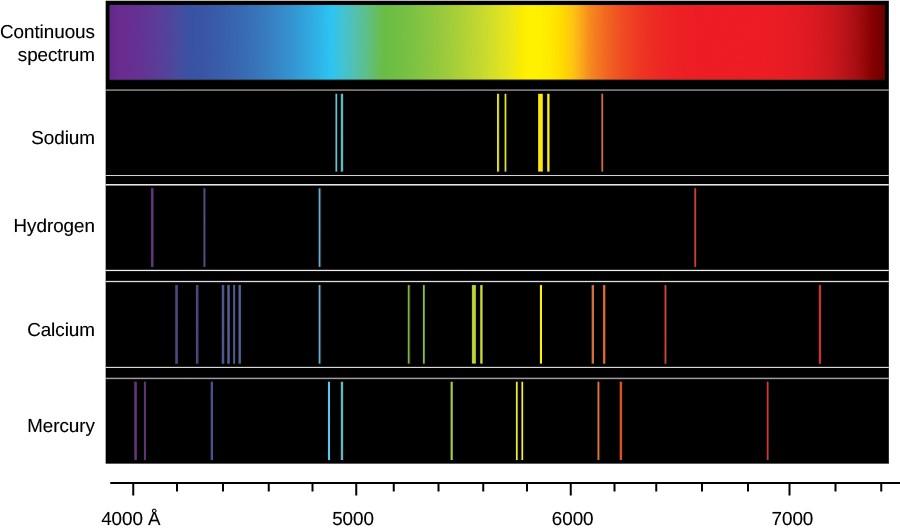
The Bohr Model describes the atom as having a small, dense nucleus surrounding by electrons revolving in discrete orbits of fixed radii and energy. Bohr's model helped to explain a curious observation made previously: that atoms of an individual element emit light at specific wavelengths producing a line spectrum, as opposed to a continuous spectrum of all wavelengths like light emitted by the sun. See Figure 1 for examples of a continuous spectrum, as well as some line spectra for various elements.
Figure 1: A continuous spectrum and the line spectra of sodium, hydrogen, calcium and mercury.
Part 2: Atomic Emission SpectraThe Bohr Model describes the atom as having a small, dense nucleus surrounding by electrons revolving in discrete orbits of fixed radii and energy. Bohr's model helped to explain a curious observation made previously: that atoms of an individual element emit light at specific wavelengths producing a line spectrum, as opposed to a continuous spectrum of all wavelengths like light emitted by the sun. See Figure 1 for examples of a continuous spectrum, as well as some line spectra for various elements.
Figure 1: A continuous spectrum and the line spectra of sodium, hydrogen, calcium and mercury.
According to the Bohr Model, orbitals increase in energy the further away from the nucleus they are, or as n increases (see Figure 2). When an electron becomes excited by absorbing energy, it can jump from a lower energy ground state energy level to a higher energy excited state energy level. When the electron falls back down from the higher energy level to the lower energy level, it must release energy. The energy is released in the form of light. The energy of light that is emitted during a transition is equal to the energy difference between the higher and lower energy levels for the electron (Ehigher-Elower). Because only distinct energy transitions are possible, the light emitted is of a specific energy and wavelength, and distinct line spectrum is observed.
Figure 2: An example of the Bohr Model of the atom, electronic transitions, and line spectrum.

We will now explore this further by investigating some atomic emission spectroscopy. Please use the observations and data provided to answer the questions.
Figure 3: The electromagnetic (EM) spectrum.
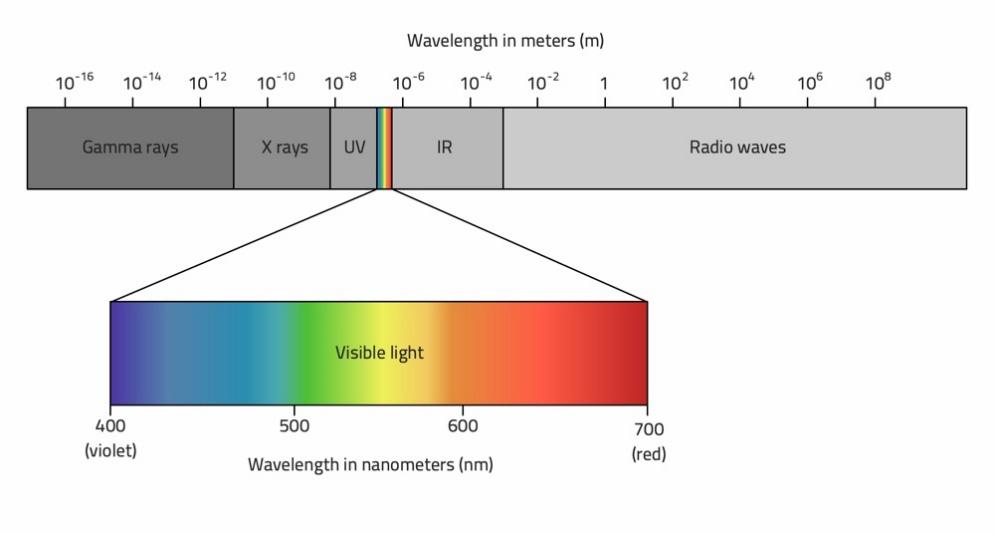
Figure 2: An example of the Bohr Model of the atom, electronic transitions, and line spectrum.
Table 1: Electron transitions and EM Radiation for Figure 2.
| Initial Energy Level, ni | Final Energy Level, nf | EM Radiation Region | Wavelength (nm) |
| visible light | 515 | ||
| visible light | 535 | ||
| visible light | 640 |
1. Of the transitions above, the n= ["", "", ""]  to n=2 transition is the largest energy difference.
2. Of the transitions above, the n= ["", "", ""] to n= 2 transition is the smallest energy difference.
3. Based on the above data, the longer the wavelength the ["", ""] the energy of the EM radiation, and the shorter the wavelength the ["", ""] the energy of the EM radiation.
Results and Conclusions
Use the line spectrum of Hydrogen and the data below to answer the remaining questions below:
Figure 4: Emission Spectrum of Hydrogen.

Table 2: Electron Transitions and EM radiation for Hydrogen atoms.
| Initial Electron Energy Level, ni | Final Electron Energy Level, nf | EM Radiation Region |
| Ultraviolet Radiation | ||
| Ultraviolet Radiation | ||
| Ultraviolet Radiation | ||
| Ultraviolet Radiation | ||
| Ultraviolet Radiation | ||
| Visible Light | ||
| Visible Light | ||
| Visible Light | ||
| Visible Light | ||
| Infrared Radiation | ||
| Infrared Radiation | ||
| Infrared Radiation |
Rank the energies of the four colors of light (red, blue-green, indigo, and violet) observed in the hydrogen emission from highest to lowest energy.
Highest Energy
[color1]
[color2]
[color3]
[color4]
Lowest Energy
Group of answer choices
color 1

color 2
color 3
color 4
Determine the initial (ni) and final (nf) energy levels for each line in the hydrogen emission spectrum.
| Transition "Line" Color | ni | nf |
| violet | ["", "", "", "", "", ""] | ["", "", "", "", "", ""] |
| indigo | ["", "", "", "", "", ""] | ["", "", "", "", "", ""] |
| blue-green | ["", "", "", "", "", ""] | ["", "", "", "", "", ""] |
| red | ["", "", "", "", "", ""] | ["", "", "", "", "", ""] |
Why don't we see the light emitted from the transition 6 --> 1? What region of the EM spectrum does this light belong to? Explain.
Why don't we see the light emitted from the transition 4 --> 3? What region of the EM spectrum does this light belong to? Explain.

According to the Bohr Model, orbitals increase in energy the further away from the nucleus they are, or as n increases (see Figure 2). When an electron becomes excited by absorbing energy, it can jump from a lower energy ground state energy level to a higher energy excited state energy level. When the electron falls back down from the higher energy level to the lower energy level, it must release energy. The energy is released in the form of light. The energy of light that is emitted during a transition is equal to the energy difference between the higher and lower energy levels for the electron (Ehigher-Elower). Because only distinct energy transitions are possible, the light emitted is of a specific energy and wavelength, and distinct line spectrum is observed.
Figure 2: An example of the Bohr Model of the atom, electronic transitions, and line spectrum.

We will now explore this further by investigating some atomic emission spectroscopy. Please use the observations and data provided to answer the questions.


