Need help with this assignment attached below.
Assignment 1 MGT 610 Due 9/20/2020. 11:59 pm
All assignments should be written in your own words providing examples and opinions beyond the textbook or any other source that you get them from. I will be looking for more of your opinions and examples beyond definitions and just answers. For calculations show ALL your steps included calculator/Excel keystrokes and/or formulas. If using Excel remember to upload the original files so I can check your work. It is important explain and briefly discuss your final answers and what they represent, do not just provide a number answer without any work. All work should be in your OWN words NOT any others or the textbook for full credit. This applies to all assignments for the course.
NAME:____________________________________________________________
| Chapter 1 & Chapter 2 |
| 1. (15%) Below you are given the examination scores of 20 test takers.
==================================================================== | ||||||||||||||||||||||||||||
| 2. (15%) Construct a stem-and-leaf display for the following data. What does this display indicate as far as skew? Give an example of how one would interpret a stem and leaf display using a real example.
|
---------------------------------------------------------------------------------------------------------
| 3. (15%) The standardized scores of a sample of business school students and their genders are shown below.
| |||||||||||||||||||||||||||||||||||
4. (15%) A survey of 400 college seniors resulted in the following cross tabulation regarding their undergraduate major and whether or not they plan to go to graduate school.
| Undergraduate Major | ||||
| Graduate School | Business | Engineering | Others | Total |
| Yes | 35 | 42 | 63 | 140 |
| No | 91 | 104 | 65 | 260 |
| Total | 126 | 146 | 128 | 400 |
| a. | Are a majority of the seniors in the survey planning to attend graduate school? |
| b. | Which discipline constitutes the majority of the individuals in the survey? |
| c. | Compute row percentages and comment on the relationship between the students' undergraduate major and their intention of attending graduate school. |
| d. | Compute the column percentages and comment on the relationship between the students' intention of going to graduate school and their undergraduate major. ======================================================= |
5. (15%) A local electronics retailer recently conducted a study on purchasers of large screen televisions. The study recorded the type of television and the credit account balance of the customer at the time of purchase. They obtained the following results.
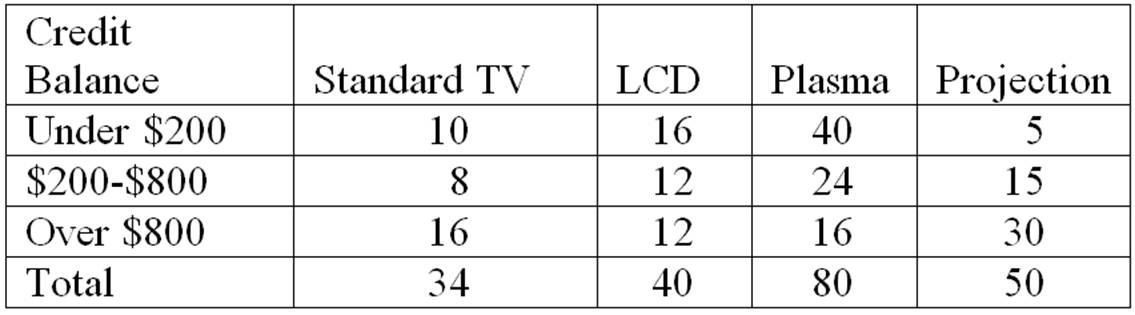
Construct a table of row percentages. Discuss the outcomes and what these numbers represent.
-------------------------------------------------------------------------------------------------
6. (15%) Draw two bar charts that compare type of customer for males vs. females. Are gender and promotional customers related? Why or why not? You can use Excel or draw by hand at this time. Briefly discuss results.
| Type of Customer | Gender |
| Regular | Male |
| Promotional | Female |
| Regular | Female |
| Regular | Female |
| Regular | Female |
| Regular | Female |
| Regular | Female |
| Promotional | Female |
| Regular | Male |
| Promotional | Female |
----------------------------------------------------------------------------------------------------
7.
Essay (10%): Descriptive statistics involves describing the key relationships between all sorts of data be it visual or numerical. Using examples outside of textbook briefly discuss the following. The length of the essay should be a minimum of at least one side of a page.
Bar charts, histograms, pie charts and trend lines. Discuss the importance of each of these and where they are best used. Provide only one real example of and where it is used.
4


