Criminal Justice Statistics
CJ 2602: Criminal Justice Statistics
Problem Set #1
Student’s Name_________________________________________________
Be sure to answer all parts of each question. All work must be conducted individually. Show all steps involved in computations. Failure to do so will adversely impact on your grade. If you need more room to work out problems, label the question and attach it to the back of the packet.
Part 1a: Independent and Dependent Variables (1pt each)
For each research question, identify the independent and dependent variable. Be specific.
Research has found the more hours of sleep an individual gets the lower their anxiety is during the day.
IV: ____________________ DV: _____________________
A scientist is interested in the relationship between academic major (e.g., psychology, criminology, social work) and number of beers consumed per week.
IV: ____________________ DV: _____________________
How are test scores influenced by one’s political affiliation (i.e., Republican, Democrat, Libertarian)?
IV: ____________________ DV: _____________________
Does SES (i.e., lower, middle and upper class) effect an individual’s body weight?
IV: ____________________ DV: _____________________
What is the relationship between birth order (i.e., oldest, middle, youngest) and the number of children they have in life?
IV: ____________________ DV: _____________________
Part 1b: Discrete and Continuous Variables (1pt each)
For each variable, identify whether it is continuous or discrete. Circle the correct measure.
The height of a 2-year-old maple tree.
Discrete or Continuous
The number of phone-calls a sales representative makes in a month.
Discrete or Continuous
Age of your grandmother.
Discrete or Continuous
The number of prior arrests for drunk driving.
Discrete or Continuous
An individual’s weight.
Discrete or Continuous
Part 2: Levels of Measurement (1pt each)
For each variable, identify the level of measurement. If a variable is dichotomous, identify the level of measurement and write “Dichotomous” next to your answer.
Type of transportation (e.g., carpool, bus, subway, walk, cab, drive). ________________
Nationality of survey respondents. _______________
Students’ letter grade on a test (i.e., A, B, C, D, F). ________________
A student’s college major (e.g., psychology, criminology, social work, etc.). _____________
Amount of fat (in grams) in a cookie. ___________________
Temperatures (in degrees Fahrenheit) of the ocean at various depths. _______________
Do you agree with Proposition 17 (0 = No; 1 = Yes)? _______________
Professional sporting events (e.g., baseball, football, wrestling, etc.). ________________
Survey responses of “good, better, best.” ____________________
Expenses per month in dollars. _________________
Part 3: Graphic Representations (3pt each)
For each of the examples below, construct a frequency table. Make sure you label your table and fill in all appropriate columns.
The following are responses to the question: “What is your favorite color?”
| Red | Purple | Blue | Pink | Blue |
| Blue | Red | Orange | Green | Yellow |
| Purple | Yellow | Pink | Red | Purple |
| Blue | Blue | Blue | Blue | Purple |
| Orange | Pink | Yellow | Orange | Blue |
Make a statement about your table.
The following are responses to the question: “Do you favor affirmative action?”
| Neutral | Strongly Against | In Favor | Strongly In Favor |
| Against | In Favor | Strongly In Favor | Strongly Against |
| Against | In Favor | In Favor | In Favor |
| Strongly Against | In Favor | Strongly Against | Strongly In Favor |
| In Favor | Strongly Against | In Favor | Against |
Make a statement about your table.
The following are responses to the question: “How many jobs have you worked.”
2, 3, 4, 5, 2, 2, 2, 1, 1, 2, 3, 1, 4, 2, 4, 1, 2, 1, 3, 4, 5, 7, 10, 9, 8, 5, 6, 4, 3
Make a statement about your table.
Part 4: Measures of Central Tendency (3pts each)
Calculate the most appropriate measure or measures of central tendency for the following distributions. Students must show all steps.
The following are responses to the question: “What is the age of your oldest relative?”
76, 88, 84, 80, 81, 99, 87, 84, 77, 68, 91, 92, 94, 88
The following are responses to the question: “What is your highest degree earned?”
BA, BA, MA, PhD, PhD, MA, MA, MA, BA, BA, BA, BA, BA, PhD, MA, MA, BA, BA, BA
The following are responses to the question: “What is your weekly salary?”
| $300 | $1,200 | $600 | $750 | $250 | $650 | $100 |
| $500 | $450 | $700 | $500 | $400 | $1,500 | $400 |
| $1,500 | $400 | $450 | $350 | $400 | $350 | $375 |
Discuss what happens to your measures of central tendency when we give the best intern a raise?
| $300 | $1,200 | $600 | $750 | $250 | $650 | $100 |
| $500 | $450 | $700 | $500 | $400 | $6,500 | $400 |
| $1,500 | $400 | $450 | $350 | $400 | $350 | $375 |
Part 5: Measures of Dispersion (6pts each)
Calculate the most appropriate measures of dispersion for the following distributions. Students must show all steps.
The following represents the yearly total of marijuana seized by the DEA.
| Year | Marijuana (in pounds) |
| 2010 | 2,526 |
| 2011 | 2,489 |
| 2012 | 2,943 |
| 2013 | 3,001 |
| 2014 | 3,050 |
| 2015 | 1,989 |
| 2016 | 2,224 |
| 2017 | 2,569 |
| 2018 | 2,412 |
| 2019 | 2,789 |
| Total | 25,992 |
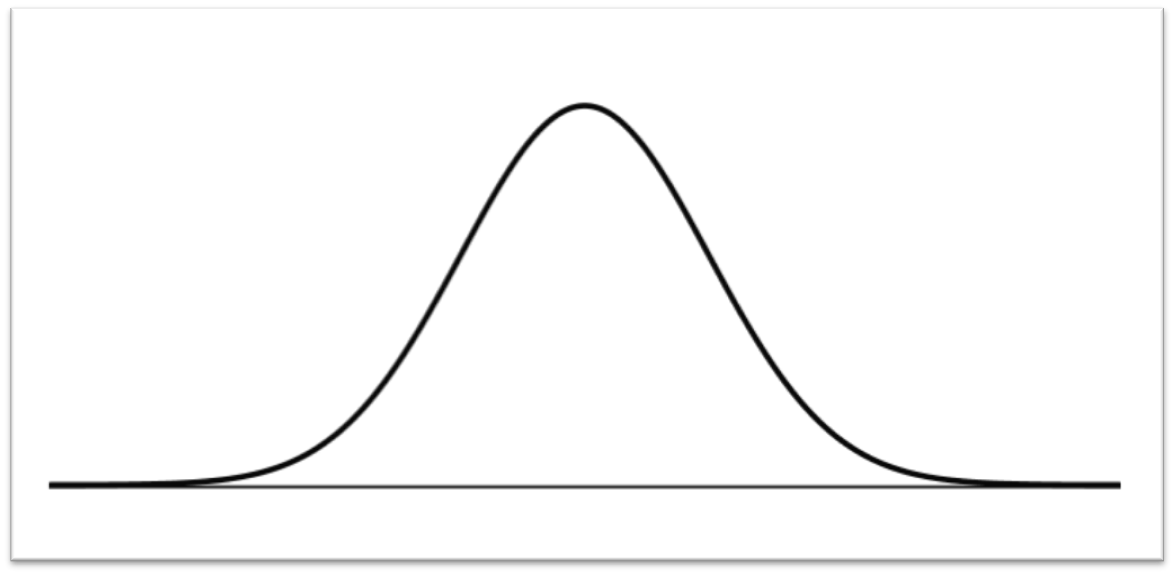
Graph the standard deviations below on a normal curve. Indicate percentages for each region.
The following represents the 10 finalists for Harrisburg’s Pumpkin growing contest.
| Contestant | Pumpkin Weight |
| Contestant #1 | 21 |
| Contestant #2 | 23 |
| Contestant #3 | 29 |
| Contestant #4 | 13 |
| Contestant #5 | 20 |
| Contestant #6 | 34 |
| Contestant #7 | 35 |
| Contestant #8 | 14 |
| Contestant #9 | 25 |
| Contestant #10 | 19 |
| Total | 233 |
Graph the standard deviations below on a normal curve. Indicate percentages for each region.
10


