Performance task for chemistry
NAME___________________________________
Analysis of Ni2+ by Spectrophotometry
This exam involves using best practices to analyze a Ni2+ unknown solution. Multiple working standard solutions will be prepared by diluting a stock solution of NiSO4. The 0.200M stock solution will be the highest concentration standard; it has been analyzed to give the table (below) of absorbances as a function of wavelength. This analysis will be done by spectrophotometry. Measurements are done in 1.20 cm cuvettes. The stock solution, glassware, and the spectrophotometer are provided. Everything else is your responsibility.
| Wavelength (nm) | Absorbance |
| 380 | 0.746 |
| 390 | 0.973 |
| 400 | 1.026 |
| 410 | 0.853 |
| 420 | 0.619 |
| 430 | 0.417 |
| 440 | 0.229 |
| 450 | 0.142 |
| 460 | 0.094 |
| 470 | 0.066 |
| 480 | 0.054 |
| 490 | 0.036 |
| 500 | 0.022 |
| 510 | 0.024 |
| 520 | 0.028 |
| 530 | 0.066 |
| 540 | 0.046 |
| 550 | 0.057 |
| 560 | 0.078 |
| 570 | 0.093 |
| 580 | 0.106 |
| 590 | 0.143 |
| 600 | 0.349 |
Plot the absorption spectrum to the left. Attach the graph to this exam after this sheet of paper. Locate the wavelength value of maximum absorbance. Indicate this wavelength on the graph and record the value below.
λmax = nm. (5)
From the absorption spectrum, calculate the value of the molar absorption coefficient at λmax. Show your work. (3)
If you change the concentration of the solution, will the molar absorption coefficient change? Why? (3)
Sample Dilutions:
You were provided with a 50.0 mL of 0.200M NiSO4 stock solution and told to create five dilutions. Below, you will find the five dilution concentrations. Fill in the missing information. Show your work.
| Dilution Concentration | Volume of Water needed for dilution (in Liters) | Moles of NiSO4 in dilution | Absorbance for each solution. |
| 0.180 | |||
| 0.150 | |||
| 0.120 | |||
| 0.0900 | |||
| 0.0600 |
Unknown Concentration and Absorbance:
At the end of the lab, you will find a list of student ID numbers and unknown information. Use this information to find your specific unknown absorbance. Record the information in the space below. Use the sample dilutions, from above, to calculate a known calibration graph. Record your concentrations and their absorbances below.
| Solution Concentration | Absorbance |
| (blank) | |
Create a hand drawn graph comparing the known solution concentration and absorbance. Use this graph to calculate the Unknown concentration and absorbance. (hint: I would suggest drawing a line of best fit to help find the unknown concentrations.) Attach a photo of your graph after this page. Illustrate your unknown concentration and absorbance on the graph and record below:
Unknown code: __ Aunk =
C (graphically) = ____________ (8)
Generate the linear regression in terms of the variables studied from the hand graph above. Include the value of R2.
(4)
| Equation | R2 |
Using your regression equation, calculate the concentration of your unknown. Show your calculation below. (5)
C (mathematically) = ________
Using your regression equation, Beer’s Law, and only necessary information that is common to all your trials, calculate the value of the molar absorption coefficient. Show your calculation. (5)
Conclusion:
During your calculations did you recognize any type of error? Provide reasoning why.
Post Lab Questions:
 1. An amine complex of cobalt (III) is yellow-orange and has a λmax of 475 nm. The standard curve below is for a set of standards measured at λmax in a 1.8 cm cell. Use it to answer the questions that follow.
Suppose you ran the same samples in a 1.2 cm cell. Explain, if any, changes in:
Absorbance -
Concentration -
Molar absorptivity -
b. Your classmate runs the same set of standards at 500 nm. Explain how the data will change and how the graph above will look.
UNKNOWN DATA – Use the data table below to find the unknown code and transmittance based on your student ID.
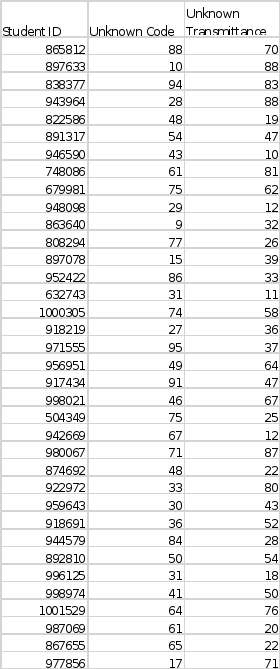 my id is 0918691
5


