Instructions: 1) Exam questions contains four pages. You have to work alone. You are welcome to use lecture notes and any other supplementary materials; 2) For the exam, you must find your d
19/12/2020
My data is (4 5 6 6 7 4 4 5 6 4 4 5 4 6 4 4 8 7 5 5 6 5 9 3 8 5 6 4 5 6)
Instructions:
Exam questions contains four pages. You have to work alone. You are welcome to use lecture notes and any other supplementary materials;
For the exam, you must find your dataset from the midexam_data.xlsx file. We will refer to it as “your dataset”. This data is different for everybody. For Questions 1 and 2 you should your own data. The student who uses another person’s dataset will receive an automatic zero grade.
Please submit your final answers in word format. I prefer typing. If you use handwriting, make sure that it is legible. Otherwise, your mid-term mark will be affected.
When you submit your exam paper, please put your full name in the document and sent to my email. Please note re-submission of the paper is not acceptable.
In all answers show your calculations. The answers without the way of calculations will affect the grade.
Exam starts at 09:00am and ends at 10:50. You should send exam paper in Word file to my email before the 10:50am. Any late submission will decrease your grade by 15%. Please be sharp on this rule.
Test of measures of central location and variability (47%)
Assume that your dataset is a sample from the population, and each number refers to a daily expenditure of a given student. Take the first nine observations in your dataset. Calculate mean, median, mode and range. (13%)
Comment on shape of distribution for the result in part 1). (no need to provide graph) (5%)
Compute the 40th and 80th percentile and comment on it using the first nine observations in your data set (6%). Interpret results.
Take the first nine observations in your dataset. Compute variance, standard deviation and coefficient of variation. (9%)
Provide a Box plot summary using first nine observations in your data set (no need to draw Box plot). Interpret. Does it contain outliers? (14%)
Summary of the data (25%)
Develop a frequency distribution, relative frequency, cumulative and relative cumulative percentage distributions for the whole monthly observations in your data (only for your name). (I suggest let the number of classes to be 6. It is arbitrary you can make it 5 or 7.). Find appropriate width value. (you can approximate the width and class). Also comment briefly if in the relative frequency probabilities assigned are valid or not (20%)
| Classes | Frequency distribution | Relative Frequency distribution | Cumulative Frequency distribution | Cumulative Percentage Frequency distribution |
| … | … | |||
| … | ||||
| … | ||||
| … | ||||
| … | ||||
| … | ||||
Assume that your dataset is a sample from the population, and each number refers to a daily expenditure of a given student. Now, I am interested in proportion of ‘poor students’. So, I define ‘poor students’ to be those whose daily expenditures are less than 5 manats per day. So, based on the result part 1) what is that portion. Interpret result. (5%)
Probability (20% - each sub-question carries 4% weight)
Small real estate company, ADA Realty, recently became interested in determining the likelihood of one of their listings being sold within a certain number of days. An analysis of company sale prices and days until sold in previous years produced the following data
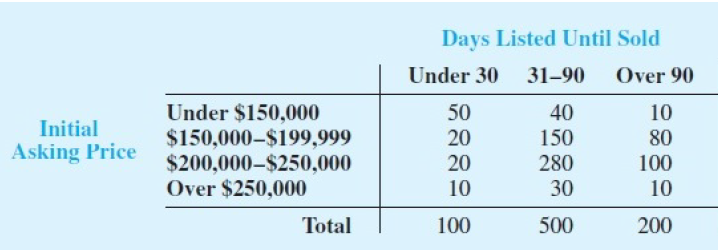
Randomly, if A is defined as the event that a home is listed for more than 90 days before being sold, estimate the probability of A.?
If B is defined as the event that the initial asking price is under $150,000, estimate the probability of B.
What is the probability of
 ?
?
Assuming that a contract was just signed to list a home with an initial asking price of less than $150,000, what is the probability that the home will take ADA Realty more than 90 days to sell?
Are events A and B independent?
Theoretical question (8%)

3


