Please see the attachments
2. Universities and Colleges (dataset posted)
The file ‘univ&col’ contains data on 80 colleges and universities. Among the variables included are:
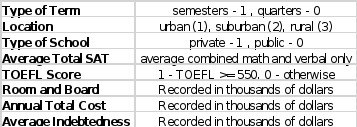
where TOEFL, Test of English as a Foreign Language, tests proficiency skills in 4 areas: reading, listening, speaking and writing.
Clearly one would assume that private colleges and universities would have a higher annual total cost as tuition is higher at private institutions. Construct a 95% confidence interval to estimate how much more it would cost annually to attend a private institution and interpret these values in a clear sentence. This is asking you to construct a confidence interval estimate of the difference in mean tuition.
1) Please perform an F-test for Equal Variances to determine which Two-sample t-test and SE to use. Copy and paste the necessary F-test output below and clearly state your conclusion
2) Then perform the appropriate two-sample t-test to get the necessary descriptive statistics to construct the confidence interval. Show all necessary work and/or paste your Excel output.
The following contingency table shows the results of TOEFL coding between private and public schools.
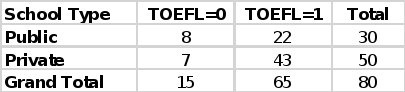
Do the data support that public schools have a significant higher proportion of low TOEFL scores than the private schools? Show all necessary statistics and state a clear conclusion in non-statistical language. (Note: I recognize that some of the cells are small counts but we are generally ok if each cell’s expected frequency > 5).
State your null and alternative hypotheses
Calculate or highlight the test statistic in the output
Highlight the p-value or critical value comparison to determine the conclusion of the test
Make a clear concluding statement without using the words reject or hypothesis.
Copy and paste the highlighted output
Make a clear conclusion about proportions of low TOEFL scores between private and public schools.
Consider the Locations of each as urban(1), suburban (2) and rural (3). Conduct a hypothesis test to determine whether the proportion of schools is the same for each location type.
State your null and alternative hypotheses
Calculate the observed and expected values for each location.
Calculate the Chi-square Test statistic and the p-value
Copy and paste the table from Excel
Make a clear concluding statement without using the words reject or hypothesis.
Now conduct a hypothesis to determine if location of a school is independent of whether it is a private school or a public school. Provide the Excel table of observed and expected values0
State your null and alternative hypotheses
Calculate the observed and expected values for each location.
Calculate the Chi-square Test statistic and the p-value
Provide a side-by-side visual chart to display the relationship of the three locations for private and public schools
Make a clear concluding statement without using the words reject or hypothesis.


