8 Problems, Hart Manufacturing makes three products. Each product requires manufacturing operations in three departments: A, B, and C. The labor-hour requirements, by department, are as follows: Probl
Problem 11-11
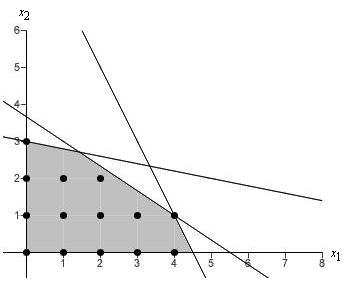
Hart Manufacturing makes three products. Each product requires manufacturing operations in three departments: A, B, and C. The labor-hour requirements, by department, are as follows:
During the next production period, the labor-hours available are 450 in department A, 350 in department B, and 50 in department C. The profit contributions per unit are $25 for product 1, $28 for product 2, and $30 for product 3.
Formulate a linear programming model for maximizing total profit contribution. If required, round your answers to two decimal places. For those boxes in which you must enter subtractive or negative numbers use a minus sign. (Example: -300)
Let Pi = units of product i producedMax
fill in the blank 1
 P1
P1fill in the blank 2
P2fill in the blank 3
P3s.t.
fill in the blank 4
P1fill in the blank 5
P22P3
≤
fill in the blank 6
2P1
fill in the blank 7
P2fill in the blank 8
P3≤
fill in the blank 9
fill in the blank 10
P1.25P2
fill in the blank 11
P3≤
fill in the blank 12
P1, P2, P3 ≥ 0
Solve the linear program formulated in part (a). How much of each product should be produced, and what is the projected total profit contribution?
P1 = fill in the blank 13
P2 = fill in the blank 14
P3 = fill in the blank 15
Profit = $ fill in the blank 16After evaluating the solution obtained in part (b), one of the production supervisors noted that production setup costs had not been taken into account. She noted that setup costs are $400 for product 1, $550 for product 2, and $600 for product 3. If the solution developed in part (b) is to be used, what is the total profit contribution after taking into account the setup costs?
Profit = $ fill in the blank 17Management realized that the optimal product mix, taking setup costs into account, might be different from the one recommended in part (b). Formulate a mixed-integer linear program that takes setup costs into account. Management also stated that we should not consider making more than 175 units of product 1, 150 units of product 2, or 140 units of product 3. If required, round your answers to two decimal places. For those boxes in which you must enter subtractive or negative numbers use a minus sign. (Example: -300) Here introduce a 0-1 variable yi that is one if any quantity of product i is produced and zero otherwise.
Max
fill in the blank 18
P1fill in the blank 19
P2fill in the blank 20
P3fill in the blank 21
y1fill in the blank 22
y2fill in the blank 23
y3s.t.
fill in the blank 24
P1fill in the blank 25
P22P3
≤
fill in the blank 26
2P1
fill in the blank 27
P2fill in the blank 28
P3≤
fill in the blank 29
fill in the blank 30
P1.25P2
fill in the blank 31
P3≤
fill in the blank 32
fill in the blank 33
P1fill in the blank 34
y1≤
fill in the blank 35
fill in the blank 36
P2fill in the blank 37
y2≤
fill in the blank 38
fill in the blank 39
P3fill in the blank 40
y3≤
fill in the blank 41
P1, P2, P3 ≥ 0; y1, y2, y3 = 0, 1
Solve the mixed-integer linear program formulated in part (d). How much of each product should be produced, and what is the projected total profit contribution? Compare this profit contribution to that obtained in part (c).
P1 = fill in the blank 42
P2 = fill in the blank 43
P3 = fill in the blank 44
Profit = $ fill in the blank 45
The profit is by $ fill in the blank 47.
Problem 11-13
The Martin-Beck Company operates a plant in St. Louis with an annual capacity of 30,000 units. Product is shipped to regional distribution centers located in Boston, Atlanta, and Houston. Because of an anticipated increase in demand, Martin-Beck plans to increase capacity by constructing a new plant in one or more of the following cities: Detroit, Toledo, Denver, or Kansas City. The estimated annual fixed cost and the annual capacity for the four proposed plants are as follows:
| Proposed Plant | Annual Fixed Cost | Annual Capacity |
| Detroit | $175,000 | 10,000 |
| Toledo | $300,000 | 20,000 |
| Denver | $375,000 | 30,000 |
| Kansas City | $500,000 | 40,000 |
The company's long-range planning group developed forecasts of the anticipated annual demand at the distribution centers as follows:
| Distribution Center | Annual Demand |
| Boston | 30,000 |
| Atlanta | 20,000 |
| Houston | 20,000 |
The shipping cost per unit from each plant to each distribution center is shown in table below.
A network representation of the potential Martin-Beck supply chain is shown in figure below.
Each potential plant location is shown; capacities and demands are shown in thousands of units. This network representation is for a transportation problem with a plant at St. Louis and at all four proposed sites. However, the decision has not yet been made as to which new plant or plants will be constructed.
Formulate a model that could be used for choosing the best plant locations and for determining how much to ship from each plant to each distribution center. There is a policy restriction that a plant must be located either in Detroit or in Toledo, but not both. For those boxes in which you must enter subtractive or negative numbers use a minus sign. (Example: -300)
Let
y1 = 1 if a plant is constructed in Detroit; 0 if not
y2 = 1 if a plant is constructed in Toledo; 0 if not
y3 = 1 if a plant is constructed in Denver; 0 if not
y4 = 1 if a plant is constructed in Kansas City; 0 if not
xij = the units shipped in thousands from plant i to distribution center j
i= 1,2,3,4,5, and j = 1,2,3
-
Min
fill in the blank 1
x11fill in the blank 2
x12fill in the blank 3
x13fill in the blank 4
x21fill in the blank 5
x22fill in the blank 6
x23fill in the blank 7
x31fill in the blank 8
x32fill in the blank 9
x33fill in the blank 10
x41fill in the blank 11
x42fill in the blank 12
x43fill in the blank 13
x51fill in the blank 14
x52fill in the blank 15
x53fill in the blank 16
y1fill in the blank 17
y2fill in the blank 18
y3fill in the blank 19
y4
| s.t. | |||||||||||||||||||
|
| fill in the blank 21 | fill in the blank 22 | fill in the blank 23 |
| fill in the blank 25 | Detriot capacity | |||||||||||||
| fill in the blank 26 | fill in the blank 27 | fill in the blank 28 | fill in the blank 29 |
| fill in the blank 31 | Toledo capacity | |||||||||||||
| fill in the blank 32 | fill in the blank 33 | fill in the blank 34 | fill in the blank 35 |
| fill in the blank 37 | Denver capacity | |||||||||||||
| fill in the blank 38 | fill in the blank 39 | fill in the blank 40 | fill in the blank 41 |
| fill in the blank 43 | Kansas City capacity | |||||||||||||
| fill in the blank 44 | fill in the blank 45 | fill in the blank 46 |
| fill in the blank 48 | St. Louis capacity | ||||||||||||||
| fill in the blank 49 | fill in the blank 50 | fill in the blank 51 | fill in the blank 52 | fill in the blank 53 |
| fill in the blank 55 | Boston demand | ||||||||||||
| fill in the blank 56 | fill in the blank 57 | fill in the blank 58 | fill in the blank 59 | fill in the blank 60 |
| fill in the blank 62 | Atlanta demand | ||||||||||||
| fill in the blank 63 | fill in the blank 64 | fill in the blank 65 | fill in the blank 66 | fill in the blank 67 |
| fill in the blank 69 | Houston demand | ||||||||||||
| xij ≥ for all i and j; y1 , y2 , y3 , y1 + y2 | |||||||||||||||||||
Formulate a model that could be used for choosing the best plant locations and for determining how much to ship from each plant to each distribution center. There is a policy restriction that no more than two plants can be located in Denver, Kansas City, and St. Louis. For those boxes in which you must enter subtractive or negative numbers use a minus sign. (Example: -300)
| Let | |
| y1 = 1 if a plant is constructed in Detroit; 0 if not | |
| y2 = 1 if a plant is constructed in Toledo; 0 if not | |
| y3 = 1 if a plant is constructed in Denver; 0 if not | |
| y4 = 1 if a plant is constructed in Kansas City; 0 if not | |
| xij = the units shipped in thousands from plant i to distribution center j | |
| i= 1,2,3,4,5, and j = 1,2,3 |
| Min | fill in the blank 78 | fill in the blank 79 | fill in the blank 80 | fill in the blank 81 | fill in the blank 82 | fill in the blank 83 | fill in the blank 84 | fill in the blank 85 | fill in the blank 86 | fill in the blank 87 | fill in the blank 88 | ||||||||||
| fill in the blank 89 | fill in the blank 90 | fill in the blank 91 | fill in the blank 92 | fill in the blank 93 | fill in the blank 94 | fill in the blank 95 | fill in the blank 96 |
| s.t. | |||||||||||||||||||
| fill in the blank 97 | fill in the blank 98 | fill in the blank 99 | fill in the blank 100 |
| fill in the blank 102 | Detriot capacity | |||||||||||||
| fill in the blank 103 | fill in the blank 104 | fill in the blank 105 | fill in the blank 106 |
| fill in the blank 108 | Toledo capacity | |||||||||||||
| fill in the blank 109 | fill in the blank 110 | fill in the blank 111 | fill in the blank 112 |
| fill in the blank 114 | Denver capacity | |||||||||||||
| fill in the blank 115 | fill in the blank 116 | fill in the blank 117 | fill in the blank 118 |
| fill in the blank 120 | Kansas City capacity | |||||||||||||
| fill in the blank 121 | fill in the blank 122 | fill in the blank 123 |
| fill in the blank 125 | St. Louis capacity | ||||||||||||||
| fill in the blank 126 | fill in the blank 127 | fill in the blank 128 | fill in the blank 129 | fill in the blank 130 |
| fill in the blank 132 | Boston demand | ||||||||||||
| fill in the blank 133 | fill in the blank 134 | fill in the blank 135 | fill in the blank 136 | fill in the blank 137 |
| fill in the blank 139 | Atlanta demand | ||||||||||||
| fill in the blank 140 | fill in the blank 141 | fill in the blank 142 | fill in the blank 143 | fill in the blank 144 |
| fill in the blank 146 | Houston demand | ||||||||||||
| xij ≥ for all i and j; y1 , y2 , y3 , y3 + y4 | |||||||||||||||||||
Problem 11-3
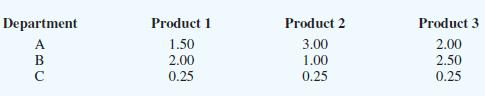
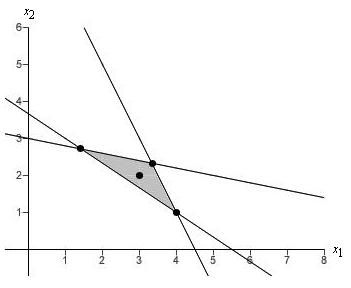
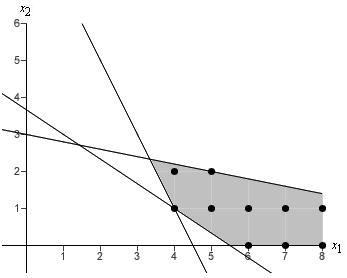
Consider the following all-integer linear program:
Choose the correct graph which shows the constraints for this problem and uses dots to indicate all feasible integer solutions.

| (i) |
| (ii) |
|
| (iii) |
| (iv) |
|
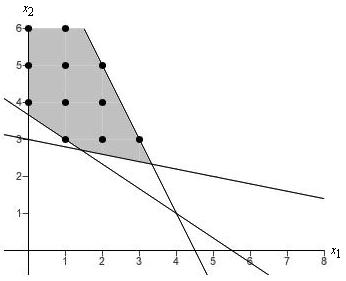
Graph_______?_______
Solve the LP Relaxation of this problem.
The optimal solution to the LP Relaxation is x1 = fill in the blank 2, x2 = fill in the blank 3. Its value is fill in the blank 4.Find the optimal integer solution.
The optimal solution to the LP Relaxation is x1 = fill in the blank 5, x2 = fill in the blank 6. Its value is fill in the blank 7.
Problem 11-23
Roedel Electronics produces a variety of electrical components, including a remote control for televisions and a remote control for DVD players. Each remote control consists of three subassemblies that are manufactured by Roedel: a base, a cartridge, and a keypad. Both remote controls use the same base subassembly, but different cartridge and keypad subassemblies.
Roedel's sales forecast indicates that 7000 TV remote controls and 5000 DVD remote controls will be needed to satisfy demand during the upcoming Christmas season. Because only 500 hours of in-house manufacturing time are available, Roedel is considering purchasing some, or all, of the subassemblies from outside suppliers. If Roedel manufactures a subassembly in-house, it incurs a fixed setup cost as well as a variable manufacturing cost. The following table shows the setup cost, the manufacturing time per subassembly, the manufacturing cost per subassembly, and the cost to purchase each of the subassemblies from an outside supplier:
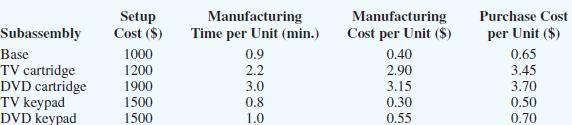
Determine how many units of each subassembly Roedel should manufacture and how many units Roedel should purchase.
Variable names
Value
No. of bases manufactured
fill in the blank 1
No. of bases purchased
fill in the blank 2
No. of TV cartridges made
fill in the blank 3
No. of TV cartridges purchased
fill in the blank 4
No. of DVD cartridge made
fill in the blank 5
No. of DVD cartridge purchased
fill in the blank 6
No. of TV keypads made
fill in the blank 7
No. of TV keypads purchased
fill in the blank 8
No. of DVD keypads made
fill in the blank 9
No. of DVD keypads purchased
fill in the blank 10
What is the total manufacturing and purchase cost associated with your recommendation?
$ fill in the blank 11Suppose Roedel is considering purchasing new machinery to produce DVD cartridges. For the new machinery, the setup cost is $3000; the manufacturing time is 2.5 minutes per cartridge, and the manufacturing cost is $2.60 per cartridge. Assuming that the new machinery is purchased, determine how many units of each subassembly Roedel should manufacture and how many units of each subassembly Roedel should purchase.
Variable names
Value
No. of bases manufactured
fill in the blank 12
No. of bases purchased
fill in the blank 13
No. of TV cartridges made
fill in the blank 14
No. of TV cartridges purchased
fill in the blank 15
No. of DVD cartridge made
fill in the blank 16
No. of DVD cartridge purchased
fill in the blank 17
No. of TV keypads made
fill in the blank 18
No. of TV keypads purchased
fill in the blank 19
No. of DVD keypads made
fill in the blank 20
No. of DVD keypads purchased
fill in the blank 21
What is the total manufacturing and purchase cost associated with your recommendation?
$ fill in the blank 22
Do you think the new machinery should be purchased?
Explain.
The input in the box below will not be graded, but may be reviewed and considered by your instructor.
Problem 11-1
| (a) | Indicate whether the following linear program is an all-integer linear program or a mixed-integer linear program. |
| Max | 30x1 + 25x2 |
| s.t. | |
| 3x1 + 1.5x2 ≤ 400 | |
| 1.5x1 + 2x2 ≤ 250 | |
| 1x1 + 1x2 ≤ 150 | |
| x1, x2 ≥ 0 and x2 integer |
| This is a ____?_____linear program. |
| Write the LP Relaxation for the problem but do not attempt to solve. | |
| If required, round your answers to one decimal place. | |
| Its LP Relaxation is |
| Max | fill in the blank 2 | |
| s.t. | ||
| fill in the blank 4 | ||
| 1.5x1 + fill in the blank 7 | ||
| fill in the blank 10 | ||
| x1 , x2 | ||
| (b) | Indicate whether the following linear program is an all-integer linear program or a mixed-integer linear program. |
| Max | 3x1 + 4x2 |
| s.t. | |
| 2x1 + 4x2 ≥ 8> | |
| 2x1 + 6x2 ≥ 12 | |
| x1, x2 ≥ 0 and integer |
| This is a linear program. |
| Write the LP Relaxation for the problem but do not attempt to solve. | |
| If required, round your answers to one decimal place. | |
| Its LP Relaxation is |
| Max | fill in the blank 17 |
| s.t. | |
| 2x1 + fill in the blank 19 | |
| fill in the blank 22 | |
| x1 , x2 |
Problem 12-07
Hanson Inn is a 96-room hotel located near the airport and convention center in Louisville, Kentucky. When a convention or a special event is in town, Hanson increases its normal room rates and takes reservations based on a revenue management system. The Classic Corvette Owners Association scheduled its annual convention in Louisville for the first weekend in June. Hanson Inn agreed to make at least 50% of its rooms available for convention attendees at a special convention rate in order to be listed as a recommended hotel for the convention. Although the majority of attendees at the annual meeting typically request a Friday and Saturday two-night package, some attendees may select a Friday night only or a Saturday night only reservation. Customers not attending the convention may also request a Friday and Saturday two-night package, or make a Friday night only or Saturday night only reservation. Thus, six types of reservations are possible: convention customers/two-night package; convention customers/Friday night only; convention customers/Saturday night only; regular customers/two-night package; regular customers/Friday night only; and regular customers/Saturday night only.
The cost for each type of reservation is shown here.
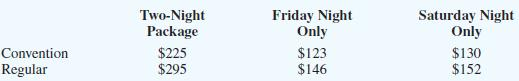
The anticipated demand for each type of reservation is as follows:
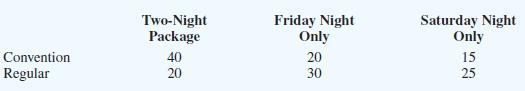
Hanson Inn would like to determine how many rooms to make available for each type of reservation in order to maximize total revenue.
Define the decision variables and state the objective function.
Let
CT = number of convention two-night rooms
CF = number of convention Friday only rooms
CS = number of convention Saturday only rooms
RT = number of regular two-night rooms
RF = number of regular Friday only rooms
RS = number of regular Saturday only room
-
fill in the blank 2
CTfill in the blank 3
CFfill in the blank 4
CSfill in the blank 5
RTfill in the blank 6
RFfill in the blank 7
RS Formulate a linear programming model for this revenue management application.
fill in the blank 9
CTfill in the blank 10
CFfill in the blank 11
CSfill in the blank 12
RTfill in the blank 13
RFfill in the blank 14
RS-
S.T.
-
1)
fill in the blank 15
CTfill in the blank 17
2)
fill in the blank 18
CFfill in the blank 20
3)
fill in the blank 21
CSfill in the blank 23
4)
fill in the blank 24
RTfill in the blank 26
5)
fill in the blank 27
RFfill in the blank 29
6)
fill in the blank 30
RSfill in the blank 32
7)
fill in the blank 33
CTfill in the blank 34
CFfill in the blank 36
8)
fill in the blank 37
CTfill in the blank 38
CSfill in the blank 40
9)
fill in the blank 41
CTfill in the blank 42
CFfill in the blank 43
RTfill in the blank 44
RFfill in the blank 46
10)
fill in the blank 47
CTfill in the blank 48
CSfill in the blank 49
RTfill in the blank 50
RSfill in the blank 52
What is the optimal allocation and the anticipated total revenue?
Variable
Value
CT
fill in the blank 53
CF
fill in the blank 54
CS
fill in the blank 55
RT
fill in the blank 56
RF
fill in the blank 57
RS
fill in the blank 58
Total Revenue = $ fill in the blank 59Suppose that one week before the convention, the number of regular customers/Saturday night only rooms that were made available sell out. If another nonconvention customer calls and requests a Saturday only room, what is the value of accepting this additional reservation?
The shadow price for constraint 10 is $ fill in the blank 60 and shows an added profit of $ fill in the blank 61 if this additional reservation is accepted.
Problem 12-11 (Algorithmic)
Consider the problem
| Min | 2X2 – 15X + 2XY + Y2 – 20Y + 65 |
| s.t. | X + 3Y ≤ 10 |
Find the minimum solution to this problem. If required, round your answers to two decimal places.
The optimal solution is X = fill in the blank 1, Y = fill in the blank 2, for an optimal solution value of fill in the blank 3.If the right-hand side of the constraint is increased from 10 to 11, how much do you expect the objective function to change? If required, round your answer to two decimal places.
The optimal objective function value will by fill in the blank 5.Re-solve the problem with a new right-hand side of 11. How does the actual change compare with your estimate? If required, round your answers to two decimal places.
The new optimal objective function value is fill in the blank 6 so the actual is fill in the blank 8.
Problem 12-23
Markowitz portfolio optimization: Harry Markowitz received the 1990 Nobel Prize for his path-breaking work in portfolio optimization. One version of the Markowitz model is based on minimizing the variance of the portfolio subject to a constraint on return. The below table shows the annual return (%) for five 1-year periods for the six mutual funds with the last row that gives the S&P 500 return for each planning scenario. Scenario 1 represents a year in which the annual returns are good for all the mutual funds. Scenario 2 is also a good year for most of the mutual funds. But scenario 3 is a bad year for the small-cap value fund; scenario 4 is a bad year for the intermediate-term bond fund; and scenario 5 is a bad year for four of the six mutual funds.
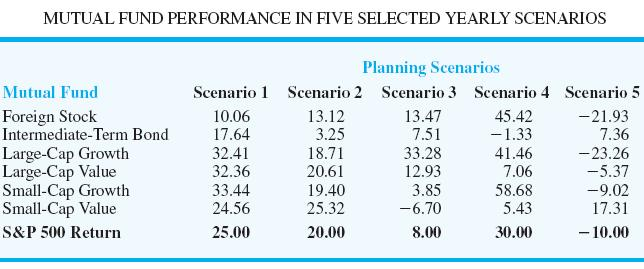
If each of the scenarios is equally likely and occurs with probability 1/5, then the mean return or expected return of the portfolio is

Using the scenario return data given in Table above, the Markowitz mean-variance model can be formulated. The objective function is the variance of the portfolio and should be minimized. Assume that the required return on the portfolio is 10%. There is also a unity constraint that all of the money must be invested in mutual funds.
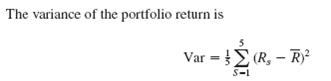
Most investors are happy when their returns are "above average," but not so happy when they are "below average." In the Markowitz portfolio optimization model given above, the objective function is to minimize variance, which is given by
where Rs is the portfolio return under scenario s and R is the expected or average return of the portfolio.
With this objective function, we are choosing a portfolio that minimizes deviations both above and below the average, R. However, most investors are happy when Rs > R, but unhappy when Rs < R. With this preference in mind, an alternative to the variance measure in the objective function for the Markowitz model is the semivariance. The semivariance is calculated by only considering deviations below R.
Let Dsp - Dsn - Rs - R and restrict Dsp and DDsn to be nonnegative. Then Dsp measures the positive deviation from the mean return in scenario s (i.e., DDsp = Rs - R when Rs R)
In the case where the scenario return is below the average return, Rs < R, we have - Dsn = Rs - R. Using these new variables, we can reformulate the Markowitz model to only minimize the square of negative deviations below the average return. By doing so, we will use the semivariance rather than the variance in the objective function.
Solve the Markowitz portfolio optimization model that can be prepared for above case to use semivariance in the objective function. Solve the model using either Excel Solver or LINGO. If required, round your answers to one decimal place.
| Mutual Funds | Investments in % |
| Foreign Stock | fill in the blank 1 |
| Intermediate-Term Bond | fill in the blank 2 |
| Large-Cap Growth | fill in the blank 3 |
| Large-Cap Value | fill in the blank 4 |
| Small-Cap Growth | fill in the blank 5 |
| Small-Cap Value | fill in the blank 6 |


