Data Manipulations with Excel This assignment is to give you practice with communicating data and analysis in a visual format but specific to numbers collected in the process of your own research.
ENGR 1201: Introduction to Engineering
Department of Civil Engineering
Lesson 8 Handout
Topic: Excel & Data Manipulation (Computer Tools)

Example 1
A tension test was performed on a circular steel specimen having an original diameter of  and a gauge length of
  . The data is listed in the table. Plot the stress-strain diagram and determine approximately the modulus of elasticity, the yield stress, the ultimate stress, and the rupture stress.
| Example of Stress-Strain Diagram | Load vs. Displacement Data | ||||||||||||||||||||||||||||
|
|
|
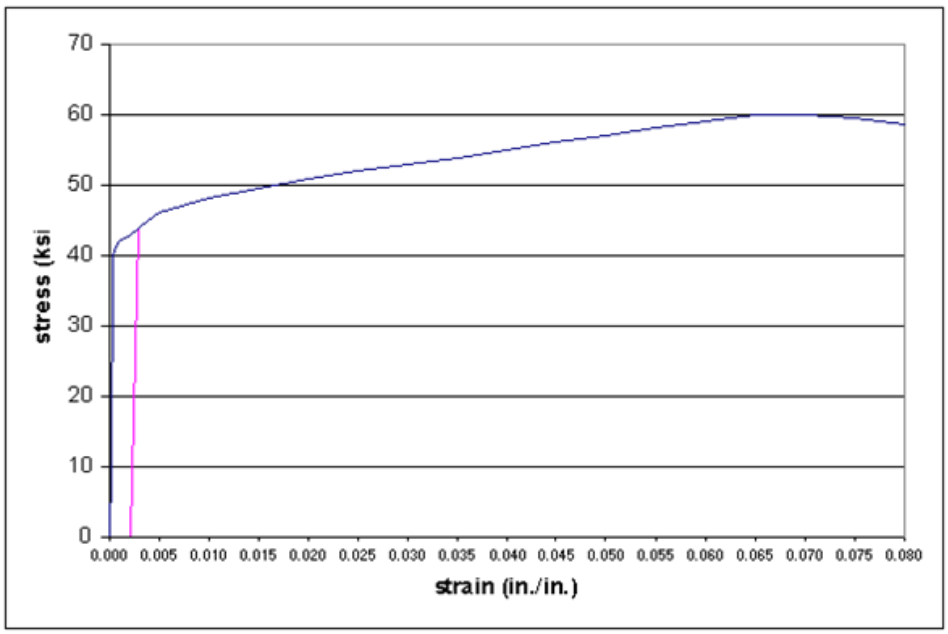
Note: You are given load vs. displacement data. You need to convert it into stress and strain. Plot your results using Excel as x-y scatter points connected by lines (if you prefer to use a different program to generate the graph that is fine also).
Example 2
A tension test was performed on a circular brass specimen having an original diameter of  and a gauge length of
  . The data is listed in the table in Excel. Plot the stress-strain diagram.
2


