Lab Project: APA Results Section Assignment
Lab Project Phase 3
PURPOSE: The purpose of this assignment is to choose the correct statistical analysis and graph for your lab project data and complete this analysis using SPSS.
SKILLS/KNOWLEDGE: As a result of completing this assignment, you will be able to:
Select the appropriate statistical test to analyze and interpret psychological data in a specific research context.
Use SPSS statistical software to analyze psychological data.
TASK: Choose the statistical analysis that best addresses the lab project research question and fits the lab project data in your SPSS data file. The correct test is one that you have learned within the first five weeks of the course. There is a “right” answer, so look carefully at the wording of the research question. Complete the analysis and turn in a Word document that contains: your rationale for using this analysis, the SPSS output, and the appropriate graph. You will be graded on how completely you address the following:
In 3-5 sentences, state which analysis you are using and provide a rationale as to why this is the correct analysis to use for the Lab Project. Provide at least one source from the course (text and/or presentations) to support your rationale. Use current APA formatting for your in-text citation(s) and reference(s).
Paste the SPSS output of your analysis. The analysis should include only the variables relevant to the research question.
Paste the appropriate graph, including an APA-style figure caption, again including only the variables relevant to the research question.
CRITERIA FOR SUCCESS: Please carefully review the Lab Phase 3 Rubric. Also, remember that asking questions contributes to learning and success, so please contact your instructor should you have any questions related to the assignment.
Submit this assignment by 11:59 p.m. (ET) on Monday of Module/Week 7.
SOLUTION
SPSS output
| Correlations | ||||
| Church attendance | Total Understanding | |||
| Church attendance | Pearson Correlation | 1 | .412 | |
| Sig. (2-tailed) | .237 | |||
| 10 | 10 | |||
| Total Understanding | Pearson Correlation | .412 | 1 | |
| Sig. (2-tailed) | .237 | |||
| 10 | 10 | |||

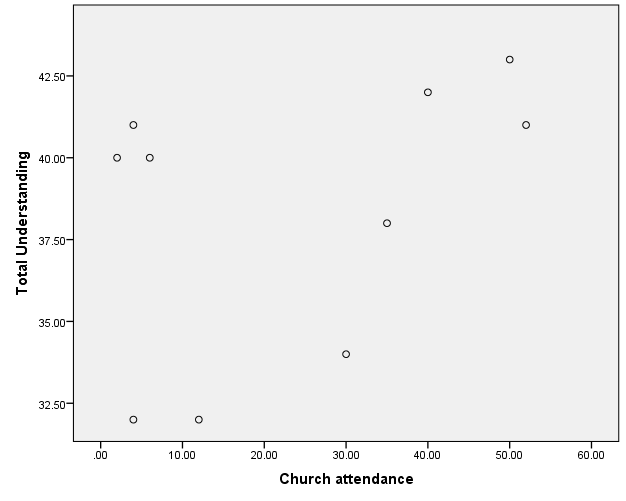
Fig 1: graph showing church attendance against total understanding.
We conducted Pearson correlation coefficient to review the association between repeat of chapel participation alongside the level of appreciation of the basic Christian guideline. A scatterplot abbreviates the results. All things considered, repeat of house of prayer support and the level of understanding of key Christian fundamentals are not straightforwardly related. There was no critical relationship between the two elements, r = 0.412, n = 10, p = 0.237.
Pearson Correlation coefficient is a nice extent of relationship when the two elements are straightforwardly related, and data has average transport, yet it will not be appropriate on the off chance that the relationship isn't straight or data isn't standard (Benest et al., 2009). The null hypothesis of no straight connection between the recurrence of chapel participation alongside the level of perception of fundamental Christian statutes isn't excused. The data used in the assessment were gotten from individuals who were for arbitrary reasons picked. Thus, assumption about erratic models isn't mishandled, nevertheless, test size is close to nothing.
Reference
Benesty, J., Chen, J., Huang, Y., & Cohen, I. (2009). Pearson correlation coefficient. In Noise reduction in speech processing (pp. 1-4). Springer, Berlin, Heidelberg.


