I need help with my project management statistics assignment. The math simulations need to be completed in crystal ball by oracle. Then put into an excel file. ASSIGNMENT SUBMISSION: 1. Excel sheet w
Session 2 Individual Assignment – IA2
BEFORE YOU BEGIN:
Before attempting this assignment, make sure to:
1. Read this document

2. Read through the Crystal Ball resources in class (Course Content>> Crystal Ball Resources) and Crystal Ball FAQ in (Discussions >> Crystal Ball Discussion) before attempting the IA2.
3. Make sure to watch the two videos (A and B) referred to in the assignment description (under Session 2 in Content). Although these two videos should suffice, you may also watch the following if you wish to: https://www.youtube.com/watch?v=Wpn9KY91nwg
Once you finish the assignment the instructions on pages 7 through 11 in the UMGC VDI Operations Guide (under Access to Microsoft Project and Crystal Ball in Content) will help you save the file in your virtual lab as well as your local hard drive for submission.
ASSIGNMENT DETAILS:
In this exercise we will calculate the Net Present Value (NPV) of a project cost given the cash inflows and cash outflows of the project. Then use this information to simulate the uncertainty of forecasting a project’s NPV.
A likely scenario might be:
Project A is a multi-year project; it begins on January 1, 2011 and is scheduled to end on December 31, 2014 (fixed cost is $215,000)
The cash outflow for Project A is estimated at $100,000 at the beginning in the first year of the project, $50,000 at the end of the year, $50,000 in 2012, and a final cash payment of $15,000 in 2014.
The cash inflow for Project A is estimated at $0 for the first year, $25,000 in 2012, $120,000 in 2013, and finally, $200,000 in 2014.
The company desires a 12% return rate on their investment to consider the project. The company also believes that inflation will remain constant at 2% per year.
Given this information we can determine the NPV of Project A using a simple Excel spreadsheet. We can then use Crystal Ball to simulate the uncertainty associated with forecasting the NPV of Project A. Table 1 is an example of the spreadsheet, or Discounted Cash Flow model, developed to calculate Project A’s NPV. The Excel spreadsheet (Figure 1) contains the actual data and formulas used for this exercise.
| Project A | ||||||
| Year | Inflow | Outflow | Net | Discount | Net | Inflation |
| *2011 | $0 | $100,000 | 0.02 | |||
| 2011 | $0 | $50,000 | 0.02 | |||
| 2012 | $25,000 | $50,000 | 0.02 | |||
| 2013 | $120,000 | $0 | 0.02 | |||
| 2014 | $200,000 | $15,000 | 0.02 | |||
| Total |
|
|
|
| ||
Table 1 – Project A Cash Flow Analysis
Steps to develop your Discounted Cash Flow Model in Excel and run Crystal Ball simulation:
Enter data for cash inflow, cash outflow, and inflation rate.
Calculate net cash flow, discount value, and NPV (yellow highlighted cells) using the formulas given (Figure 1).
Calculate totals (inflow, outflow, net flow, and NPV) using the given formula for SUM (yellow highlighted cells in Row 8).
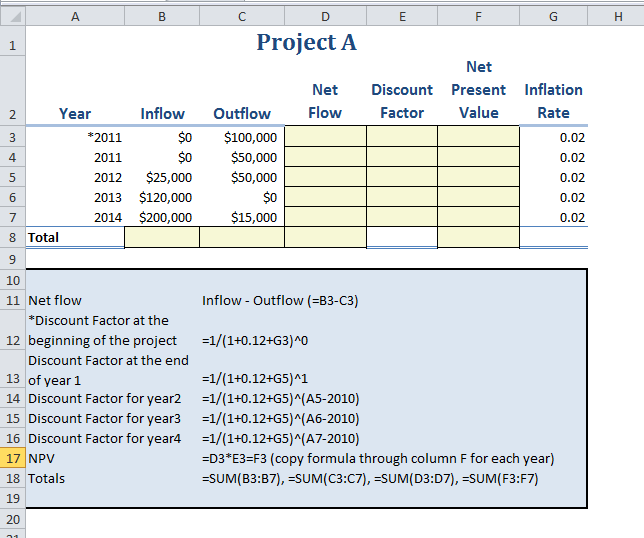
Figure 1 – Excel worksheet with formulas
Determine your assumption cells. In this case we are using cash inflow and inflation rate.
Define the assumptions using Crystal Ball. The assumption cells are input cells that contain values we are unsure of; the independent variable of the problem we are trying to solve. The cell must contain simple numeric values, no formulas or text.
To define the assumption cells for the cash inflow we use the Triangular distribution. This distribution is used when we know very little about the input values, but we can roughly estimate the minimum, maximum, and most likely values – thus creating a triangle. Crystal Ball will also calculate the minimum and maximum values automatically based on your most likely estimate which is the value you are using in the spreadsheet.
Define assumption cells for the inflation rate assuming a normal distribution. We use the normal distribution model. The normal distribution assumes that the inflation rate will most likely remain at 2% on average, but could fluctuate either up or down at the same rate and that it will most likely be closer to 2% than farther out in either direction (0% or 4%. We’ll use an inflation rate of 2% +/- .5%. With the normal distribution we can approximate that there will be a 68% chance that the inflation rate will lie within .5% either side of the mean rate of 2%.
Define forecast cell. Here we want to forecast the NPV for Project A. Forecast cells usually contain formulas that refer to one of more of the assumptions cells defined earlier.
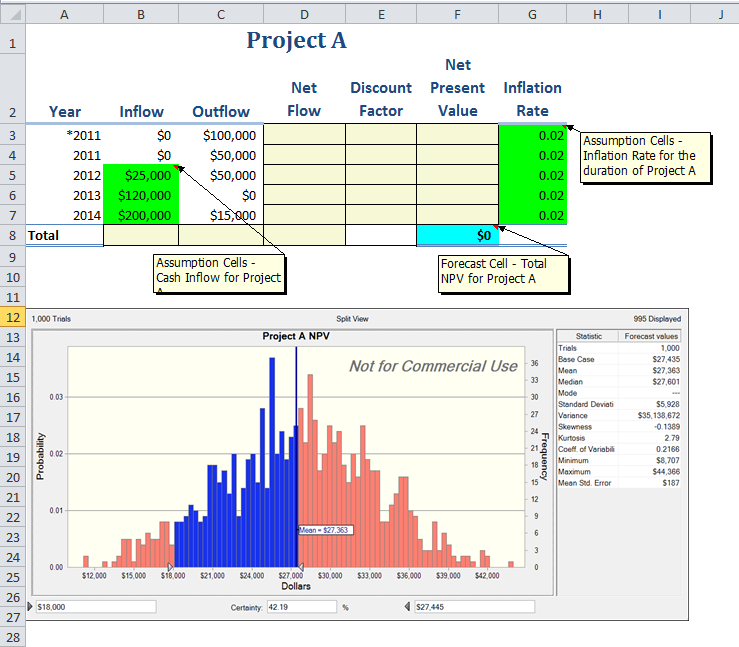
Figure 2 – Excel worksheet with CB assumptions/forecast cells defined
Now that you have your assumption and forecast cells defined you are ready to run your simulation. Select START on the Run tab (Excel Ribbon). Crystal Ball will run through 1000 trials (or the number you set in your preferences) and return a summary of these trials in the form of a frequency chart (forecast chart) that displays the number (frequency) of values occurring in a given interval. The forecast chart (Figure 3) illustrates the frequency, the probability, and the certainty of a range of values for Project A NPV.
Figure 3 Forecast chart for Project A NPV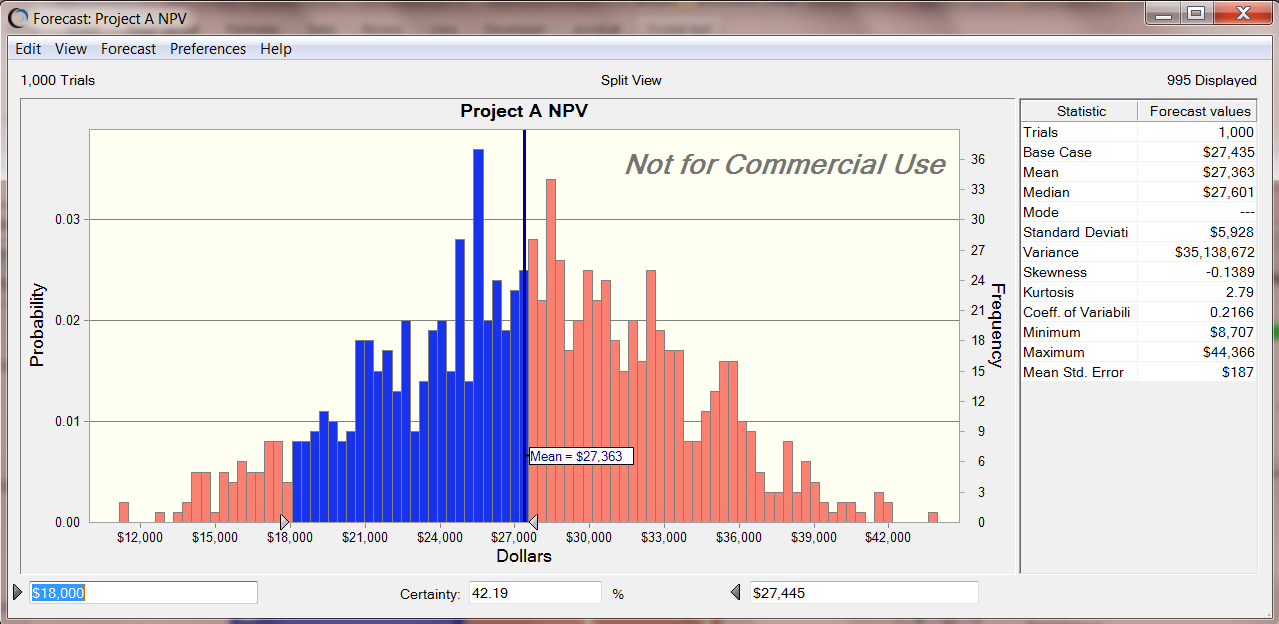
Make sure to get the split view of the chart (i.e. the frequency chart on the left and the statistics on the right). You can get the split view from the view menu of the chart when you run the simulation. Now, move the arrows on either side of the chart to get a certainty % in the middle box.
Step through this exercise on your own using the data provided and then change the input cell values (assumptions) to see how it impacts the project’s NPV. Run the simulation again and compare the forecast charts for the two scenarios.
ASSIGNMENT SUBMISSION:
1. Excel sheet with given data, assumptions and forecast definitions; simulation chart, analysis
2. Excel sheet with changed data, assumptions and forecast definitions; simulation chart, analysis
Tip: After you run simulation and get the chart, you can copy the chart from Edit -> Copy Chart and paste it inside the Excel next to(or below) the data table. You can either submit two separate excel files one for each or you can submit one file with two tabs.


