Reflecting on your instructor’s feedback in Weeks One, Three, and Five, put all your information together into a presentation. You may use any presentation program you choose, such as PowerPoint or Pr
Polling Data
Polling Data
I will present data in the form of a bar graph to illustrate the results of various polls related to how the general public feels about various topics that may affect Amazon's sales. These polls were conducted to gain insight into how the general public feels about various issues affecting Amazon's sales. The information was collected through multiple methods, including questionnaires, interviews, and focus groups. As a result, the bar graph will indicate the percentage of individuals who responded favorably or unfavorably to each issue based on their responses. In addition, the graph will also incorporate the general consensus of the population about each issue. This graph's objective is to provide the sales managers at Amazon with an overview of the public's opinion on various topics that could be essential to Amazon's sales operations (Stephens-Martinez, Hearst, & Fox., 2014).
My project could benefit from the use of bar graphs because these graphs offer a graphical depiction of the data that is simple and straightforward to comprehend. Moreover, because it can be reduced to a number and can be measured, this kind of information is classified as quantitative data. In addition, bar graphs are an efficient way to compare various types of data, such as positive and negative replies, and the results of various surveys. In addition, bar graphs make it possible to compare the general sentiment of the population towards a specific issue in a way that is both speedy and uncomplicated (Tong, Roberts, Borgo, Walton, Laramee, Wegba, Lu, Wang, Qu, Luo, & Ma., 2018).
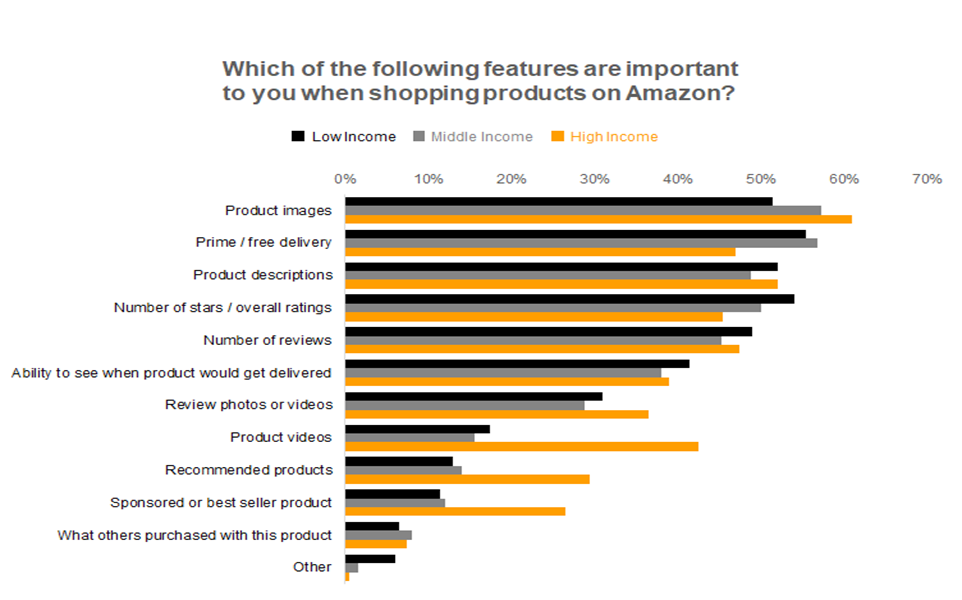
Clevelandresearch. (n.d.). Twitter. Retrieved from https://www.clevelandresearch.com/amazon-consumer-data-income-levels/
The information that is depicted in the bar graph will prove to be helpful to Amazon's sales managers in a variety of different contexts. To begin, they can make use of the data to ascertain the general public's viewpoint on a variety of issues that have the potential to influence their sales operations. These issues include customer service, product selection, pricing, shipping, and return policies. They will be able to determine the areas in which they require improvement as a result of this, which will allow them to raise their sales. Second, they can utilize the information to modify their sales approaches and methods to address particular groups' needs more effectively. Finally, they can build more effective marketing efforts and better target the appropriate audiences if they have a deeper awareness of the public's attitude toward various themes (Miller, 2013).
In conclusion, the bar graph that I am giving gives a thorough picture of the public's opinion on a variety of issues that may or may not be relevant to the sales operations of Amazon. The quantitative data is provided as a bar graph, making it simple to compare and evaluate the various responses. In addition, the data may be used to determine the public's opinion on a variety of issues that have the potential to affect Amazon's sales. This provides Amazon's sales managers with a knowledge of how to target their customers better and develop more effective marketing campaigns.
References
Clevelandresearch. (n.d.). Twitter. Retrieved from https://www.clevelandresearch.com/amazon-consumer-data-income-levels/
Miller, J. E. (2013). The Chicago guide to writing about multivariate analysis. University of Chicago Press. https://press.uchicago.edu/ucp/books/book/chicago/C/bo15506942.html
Stephens-Martinez, K., Hearst, M. A., & Fox, A. (2014, March). Monitoring moocs: which information sources do instructors value?. In Proceedings of the first ACM conference on Learning@ scale conference (pp. 79-88). https://dl.acm.org/doi/10.1145/2556325.2566246
Tong, C., Roberts, R., Borgo, R., Walton, S., Laramee, R. S., Wegba, K., Lu, A., Wang, Y., Qu, H., Luo, Q., & Ma, X. (2018). Storytelling and visualization: An extended survey. Information, 9(3), 65. https://www.mdpi.com/2078-2489/9/3/65


