The question deals with Statistics read file below
The table below shows information on the development of the monthly basic salary for employees in a specific industry. The base year is 2005.
| year | 2005 | 2010 | 2015 |
| Basic salary | 30000 | 36780 | |
| Index figure | 100 | 136.2 |
a) Determine the index figure for 2010
b) Determine the basic salary for 2015.
Below you can see the standings in the 2018/2019 Super League after the regular season.
The column to the right of the table shows the points standings in the super league, when all 26 games in the regular season had been played.
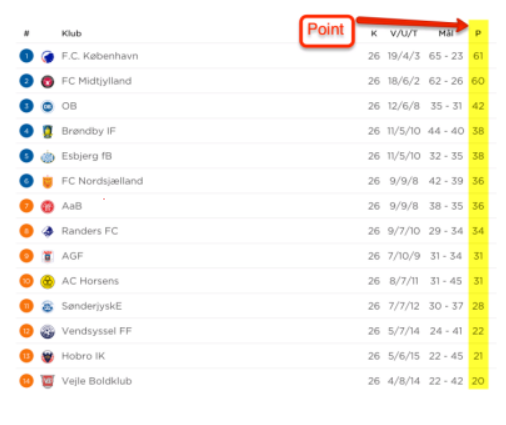
a) The average number of points (the mean value) of the Superliga clubs is 35.6 points. Explain how the mean value is calculated - remember explanation of method without CAS.
b) Determine the quartile set - remember explanation of method without CAS.
c) Also explain what the "median" in this task tells: i.e. what does the median (a specific number) say about the number of points among the Superliga teams?
When assessing how reliable a sample is, the following factors are important:
- A sample must consist of randomly selected objects.
- A sample must have a size that means that it can reasonably give a fairly correct result.
- The sample must be representative.
When working with random samples, the group you wish to examine is called the "population".
4. A newspaper wants to investigate the attitude of Copenhageners to electric scooters. An article in the newspaper describes the advantages and disadvantages of electric scooters. The article ends by inviting readers to write their opinion in an SMS to the newspaper within the next week
a) What is the population?
b) what is the sample?
c) Assess whether the sample is representative.
Task 5A. Mean, quartile set, box plot. With the use of CAS
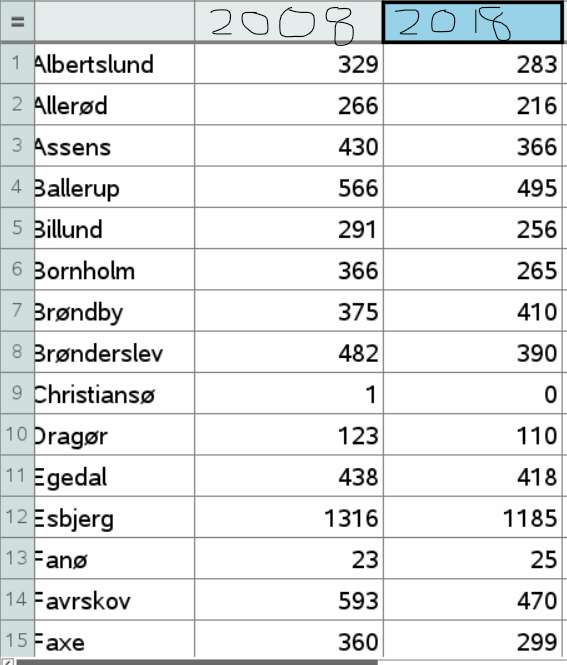
In this task, you must use the information in the spreadsheet below about the number of births in each of the 99 municipalities in 2018
a) Use CAS to calculate averages and quartile sets
(Use the tool "Statistics", "Statistical calculations", "Statistics with one variable").
b) Use CAS to draw box plots. (Insert a "Diagrams and statistics" page where you select births on the x-axis).