T-inspire needed : need brief explanations on the process
task 1A
The sale of organic food was DKK 155 million. kg in 2004.
Sales increased by DKK 20 million. kg per year in the following years.
Set up a model to describe the sales (y), measured in DKK million. kg, of organic food (x) years after 2004.
Task 1B.
In 2005, 47295 occupational accidents were reported.
In the period after 2005, the number of occupational accidents fell by 1.7% per year.
a) Introduce suitable variables and set up a model that describes the development in the number of notified persons
occupational accidents after 2005.
TASK 2
For a number of years, the number of 200 kroner notes in circulation could approximation is described by the model.
f(x) = 13.38 * 1.065x
where f(x) is the number of 200-kroner notes in circulation (measured in millions), and x is the number of years after 2000.
a) What do the numbers 13.38 and 1.065 tell us about the number of 200 kroner notes in circulation?
b) Determine the doubling time for the number of 200-kroner notes in circulation.
c) Determine how many 200-kroner notes will be in circulation in 2015 according to the model.
It turned out that in 2015 there were 30.41 million 200-kroner notes in circulation.
d) Calculate the deviation between the model's forecast and the actual number of 200-kroner notes in circulation in percent (the relative deviation).
e) Assess the applicability of the model based on the size of the relative deviation.
Task 3
The figure shows three circles of different diameters, drawn in geometry window in TI-Inspire.
You must draw three different circles in inspire – with diameters respectively 4, 6 and 8 cm - and measure the circumference of the circles using the measuring tool "length".
Go to Settings, Display Digits and select "floating5" to get sufficient accuracy in your calculations.
Complete a table as below with corresponding values of diameter and circumference.
| Diameter | 4 | 6 | 8 |
| Circumference |
It is said that diameter and circumference are directly proportional because,
|
|

for all related values of circumference and diameter.
b) Determine the proportionality constant, (K)
c) Isolate the Circumference in the equation. Describe what the graph of the relationship looks like.
Task 3B
Sunscreens' ability to protect the skin from the sun's rays is indicated by a protection factor there is called SPF (Sun Protection Factor).
The SPF solar factor system must be understood in the way that at factor 2 filters 50% of the rays are filtered out, at factor 4 filters out 75% of rays, at factor 10 filters out 90%, and using factor 20 protects against 95% of the rays.
The table shows the relationship between the factor number and the percentage of the rays that reach the skin:
| Factor number (x) | 2 | 4 | 10 | 20 |
| Precent of rays that reach into the skin. f(x) | 50 | 25 | 10 | 5 |
It holds that x and y are inversely proportional because  for all contiguous values of x and y.
a) Calculate the constant k for the relationship between the factor number and the percentage of rays that reach the skin.
b) Draw a dot plot of the relationship between x and y and determine a formula using
power regression.
Task 4
Tivoli's Annual Reports for the years 1996 – 2013 show, among other things, data on entrance fees in million DKK(Danish kroner).
The table below shows a sample of the data.
| Years | No of years after 1996 | Entrance fees in million DKK |
| 1996 | 0 | 65 |
| 1997 | 1 | 71 |
| 1998 | 2 | 84 |
| 1999 | 3 | 92 |
| 2000 | 4 | 101 |
| 2001 | 5 | 103 |
| 2002 | 6 | 105 |
| 2003 | 7 | 116 |
| 2004 | 8 | 140 |
| 2005 | 9 | 147 |
| 2006 | 10 | 157 |
| 2007 | 11 | 159 |
| 2008 | 12 | 163 |
| 2009 | 13 | 165 |
| 2010 | 14 | 177 |
| 2011 | 15 | 172 |
| 2012 | 16 | 183 |
b) make a dot plot of the correlation between Entrance income and number of years after 1996.
c) Determine the numbers a and b by linear regression.
d) According to the model, how much does the entrance fee increase per year?
e) Draw a residual plot. Is there anything in the residual plot that speaks against the use of a linear model to describe data?
c) Determine the year in which, according to the model, admission revenue exceeds DKK 250 million DKK.
Task 5A
The function f(x) describes the number of ducks sold in a supermarket in the month of December.
f(x) = 100 · 
where f(x) is the number of ducks sold and x is the number of days in the month of December.
a) Draw the graph of f(x), for x-values between 1 and 24.
b) Using the graph, determine when sales of ducks are greatest.
Task 6
The annual revenue from gambling in Denmark for the period 2000-2004 can be roughly described as by the model
y = 2.5x + 10.5
where y is the turnover, measured in billions of DKK, and x is the number of years after 2000.
a) How much does the turnover increase per year according to the model?
b) What does the number 10.5 tell us about the turnover at stake?
Task 7
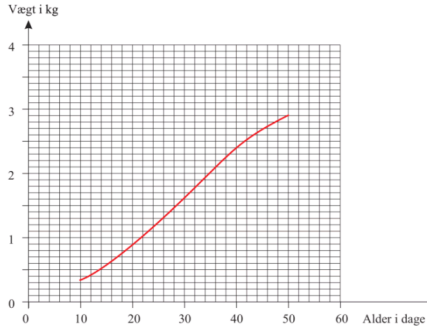
The figure shows the weight of industrial chickens which function of age.
Age is measured in days after hatching, and the weight is measured in kg.
a) How much does a 20-day-old chicken weigh?
A chicken is slaughtered when it weighs 2.4 kg
b) How old will this chick be?
ANSWERS
Task 1
1A) Have you explained that it is a linear relationship?
1B) Have you explained that this is an exponential growth?
Task 2
b) T₂=11. Formula 57 s. 12 in the formula collection
c) Have you checked whether it is an x-value or a y-value you need to calculate? Result: 34.41 million
d) Have you found the percentage deviation as:
 and you have reached to 13%?
Task 3
3A. a) Did you get that k = 3.14159?
b) Have you multiplied by d on both sides of the equals sign?
And got a linear relationship where b = 0?
3B) Did you get that k=100 and that y = 
Note that this can also be written as y = 100 ·  , which is the prescription for a power function.


