STATISTICS NO CALCULATIONS IN PART 1 ONLY EXPLANATION CALCULATIONS AND EXPLANATION IN PART 2.
Part 1
A 4-side dice and 6-side dice are rolled 100 times. The results are below.

1a. What do you notice in particular about the frequencies? EXPLAIN BREIFELY?
The chart shows the result and frequency of a 4-side dice and 6 side dice rolled together 2000 TIMES.
Keep an eye on the frequencies:

2a)
Consider and explain how it can be that the frequencies are not quite similar to the case of the simulation of 100 throws? Elaborate and explain?
Use the “law of large numbers” to explain why? Check Wikipedia.
A 6-sided dices are rolled 30 times and the results are below.
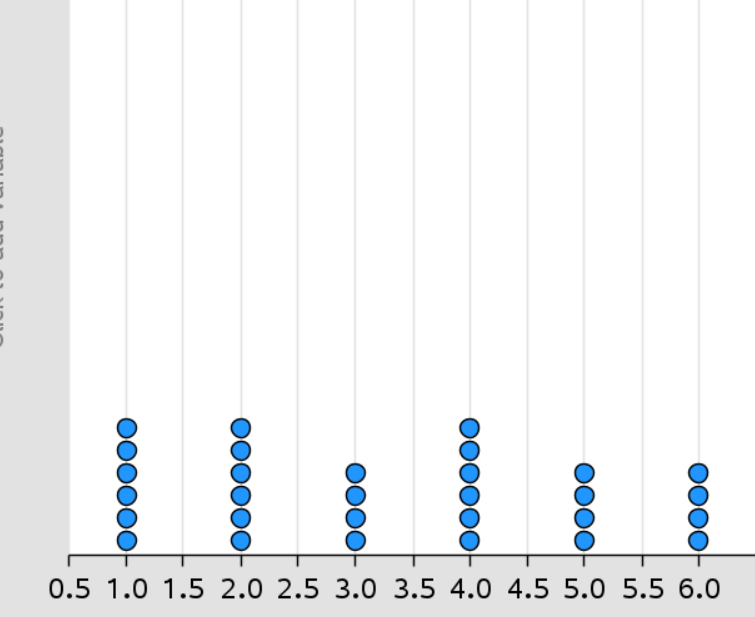
3a) look at the dot plot of the outcomes and calculate the frequencies of the different outcomes?
Part 2.
Figure 1 shows that the two Boosters from the space shuttle are separated at an altitude of 50 km. The fuel tank is released at an altitude of 120 km
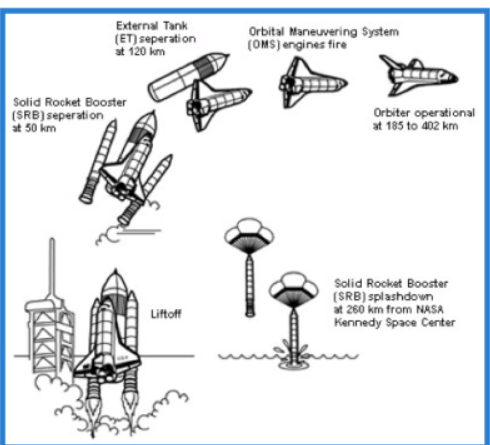
Table 1 below shows the space shuttle's weight and the height it has reached every 10 seconds. in the first 2 min. of the July 4, 2006 launch.
Table 1
Time Weight Height
0 2051113 2
10 1935155 251
20 1799290 1254
30 1681120 2882
40 1567611 5387
50 1475282 8140
60 1376301 11627
70 1277921 15390
80 1177704 19882
90 1075683 25618
100 991872 31422
110 913254 38319
120 880377 44736
1a). Make a dot plot with time on the x-axis and shuttle weight on the y-axis.
1b) Using regression, set up a model of the type f(x)=a∙x+b, where x is the time after the launch and f(x) is the weight of the shuttle
1c) Plot the graph of the regression model onto the data plot and evaluate the model from a residual plot.
1d) Give an interpretation of the numbers a and b in the model
1e) Calculate the weight of the space shuttle after 60 and 120 sec respectively. Calculate the relative deviation between the model's numbers and the table
1f) Calculate the weight after 250 sec. and comment on the result.
2a) Make a dot plot of the flight height as a function of time, i.e. with time as x-value and height as y-value. Investigate using regression and residual plots whether a linear model fits the data set well.
2b) Using quadratic regression, set up a model of the type h(x)= +bx+c, where x is the time after launch and h(x) is the flight altitude of the space shuttle.
Plot the graph on the data plot and evaluate the model from a residual plot.
2c) Draw the graph of h(x) in a suitable graph window so that the x values make sense in relation to the shuttle's height.
Do the signs of a and c match what you expected?


