Overview:In the discussion this week, you selected a publicly traded company to research. In this Financial Analysis assignment, you will obtain the company's financial statements to develop a company
Module 2 Assignment 1 – Company Financial Analysis – Part 1Balance Sheet – Trend (Horizontal) Analysis
Now that you have saved all of your company’s financial information in Excel, you can now begin to work on the financial statement analysis.
For the Balance Sheet, you will be conducting a trend analysis.
Using the Balance Sheet that you saved from Mergent, to the right of the data, type out the following information:
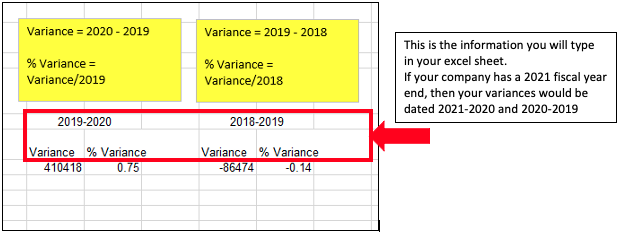
Next, you will enter the formulas to calculate the variance and % variance amounts.
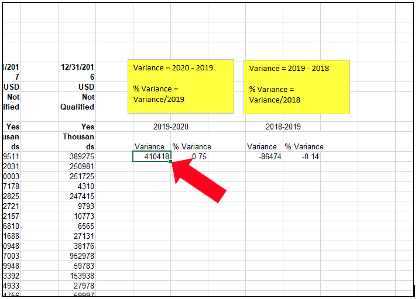
Under Variance, click in the cell and type the equal sign =.
Next, you will click in the cell that has the most recent year data in it.
Now, type the minus sign -.
Next, you will click in the cell to the right, the prior year’s data.
You should see something like this: =B16-D16
Now hit Enter.
You should see a number in this cell.
Under % Variance, click in the cell and type the equal sign =.
Next you will click in the cell that has the variance amount you just calculated.
Now, type the division sign / (forward slash).
Next, you will click in the cell that has oldest year of data. So, if you are calculating the variance between 2020 and 2019, you will click in the cell with the 2019 data in it.
You should see something like this: L16/D16
Now, hit Enter.
To turn this number into a percentage, click on the % sign in the Number part of the menu bar.

Once the formulas are in place, you can drag the formula down to the other cells by putting your curser on the dark green spot on the bottom right of the cell.
When your curser changes to a , you are ready to click your mouse and drag the curser down the column to the end of the data rows.
Repeat this process for the other three columns.
Look at the variances and % variances. Look particularly at the following accounts:
Cash
Current Assets
Total Assets
Liabilities
Stockholders’ Equity
Do you notice any large increases or decreases? Make a note of this in your excel sheet.
Look at the accounts that make up Current Assets, Total Assets, Liabilities, and Shareholders’ Equity. Do you notice any large increases or decreases with these accounts? Annotate this in your excel sheet as well.
***SAVE YOUR EXCEL BALANCE SHEET***


