Part 2 Instructions and Part 1 are also attached I need this done efficiently please I have had issues with other Tutors before I prefer the person who did pRT 1 TO ASSIST with Part 2. The Help docu
Part 1: Descriptive Statistics Analysis
Conduct the following descriptive statistics analyses using the Pastas R Us, Inc. data set in Microsoft Excel. Answer the questions in the spreadsheet Can add additional page to the excel sheet I attached !!!!
Insert a new column in the database that corresponds to AnnualSales. AnnualSales is the result of multiplying a restaurant’s SqFt by Sales/SqFt.
Calculate the following:
• mean
• standard deviation
• skew
• 5-number summary
• interquartile range (IQR) for each of the variables
| METRIC | SqFt | Sales/Person | Annual Sales | SalesGrowth% | LoyaltyCard% | Sales/SqFt | MedIncome | MedAge | BachDeg% |
| mean | 2580.47 | 7.04 | 1059381.31 | 7.41 | 2.03 | 420.31 | 62807.70 | 35.20 | 26.31 |
| standard deviation | 374.92 | 0.30 | 280423.45 | 6.62 | 0.55 | 137.24 | 17904.27 | 3.65 | 7.00 |
| skewness | 0.53 | 0.90 | 0.36 | 0.49 | -0.76 | 1.24 | 0.30 | -0.17 | 0.14 |
| minimum | 1251.00 | 6.54 | 499968.00 | -8.31 | 0.29 | 178.56 | 32929.00 | 24.70 | 14.00 |
| 1st quartile (q1) | 2400.00 | 6.83 | 877477.58 | 3.98 | 1.86 | 332.85 | 46953.00 | 32.53 | 20.25 |
| median | 2500.00 | 7.00 | 1035749.21 | 7.03 | 2.08 | 396.01 | 62757.00 | 35.00 | 26.50 |
| 3rd quartile | 2735.25 | 7.18 | 1228866.96 | 11.42 | 2.33 | 483.56 | 76194.25 | 37.53 | 30.75 |
| maximum | 3799.00 | 7.97 | 1746600.00 | 28.81 | 3.38 | 987.12 | 114353.00 | 43.50 | 40.00 |
| IQR | 335.25 | 0.35 | 351389.39 | 7.44 | 0.47 | 150.72 | 29241.25 | 5.00 | 10.50 |
Create a box-plot for the AnnualSales variable and answer the following questions:
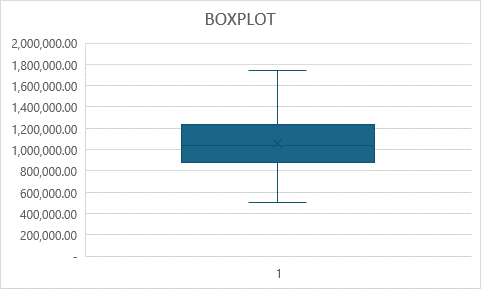
• Does it look symmetric?
• Would you prefer the IQR instead of the standard deviation to describe this variable’s dispersion? Why or why not?
The attached image features the boxplot for Sales/SqFt. The asymmetry observed in the boxplot, with a smaller lower tail compared to the right tail, suggests a degree of skewness in the Sales/SqFt variable. Given this skewness, IQR is considered a more suitable measure of variability than standard deviation.
Create a histogram for the Sales/SqFt variable and answer the following questions:

• Is the distribution symmetric? If not, what is the skew?
The third attached image showcases the histogram for the Sales/SqFt variable, revealing its non-symmetric nature. With a skewness value of 1.236, indicating positive skewness and a right-skewed distribution, the presence of a longer right tail is evident.
• Are there any outliers? If so, which one(s)?
Yes, there is an identified outlier in the dataset for the variable Sales/SqFt. The Sales/SqFt for this outlier is 987.12. The corresponding SqFt area for this observation is 1251 sq ft. This particular restaurant stands out as an outlier, achieving notably high sales per square foot relative to its size.
• What is the SqFt area of the outlier(s)? Is the outlier(s) smaller or larger than the average restaurant in the database? What can you conclude from this observation?
An outlier is identified in the dataset, with Sales/SqFt reaching 987.12 and corresponding SqFt of 1251 sq ft. Remarkably, this restaurant occupies the smallest area in the dataset, suggesting that it achieves substantial sales relative to its size. Such establishments are often found in bustling locations like malls, city squares, or near cinema theatres.
• What measure of central tendency is more appropriate to describe Sales/SqFt? Why?
Given the right-skewed nature of the "Sales/Sq Ft" variable, as elucidated in (d), the median emerges as the preferred measure of central tendency. Skewed distributions, especially those with outliers, can unduly influence the mean, making the median a more robust choice for describing the central tendency of the Sales/SqFt variable.


