week 4 QNT 561
| Descriptive Statistics and Interpretation Example QNT/561 Version 7 |
University of Phoenix Material
Descriptive Statistics and Interpretation Example
Interpretation Phrases
Central Tendency:
Mean = average of a set of data
Median = half or equal number of data is above and half or equal number of data is below. It is a midpoint in an ordered (sorted) set of data, a physical location
Mode = most frequent value in a set of data
Dispersion:
Standard deviation = variation
Interquartile range (IQR) = the middle 50% of the data
Range = the difference between the largest and smallest value of the data
Confidence Interval: (data must be normal)
There is 95% confidence that the population average is between _____ and ____ units.
Normal or significantly skewed data:
MegaStat: Descriptive statistics Normal curve goodness of fit p-value
Normal, p-value > .05
Significantly Skewed, p-value < .05
Histogram: Eyeball the histogram.
Normal data will have a symmetrical or slightly skewed shape.
Significantly Skewed shape will have extreme skewness
Use phrase combinations: Normally distributed: Mean and Standard Deviation, Not normally distributed: Median and IQR
Descriptive Statistics
Body Weight (Lbs.)
| Central Tendency: | Mean = 149 Lbs. |
| Dispersion: | Standard deviation = 30 Lbs. |
| Count: | 100 |
| Min/Max: | 99 pounds and 234 Lbs. |
| Confidence Interval: | 144 to 155 Lbs. |
See the histogram in Appendix A, and descriptive statistics in Appendix B.
Age
Distribution is not normally distributed
| Central Tendency: | Median = 36 years |
| Dispersion: | Interquartile Range = 20.5 years / 2 = ± 10 years |
| Count: | 100 |
| Min/Max: | 18 years and 74 years |
| Confidence Interval: | Not applicable (data is not normally distributed) |
See the histogram in Appendix A, and descriptive statistics in Appendix B. A scatter plot is in Appendix C.
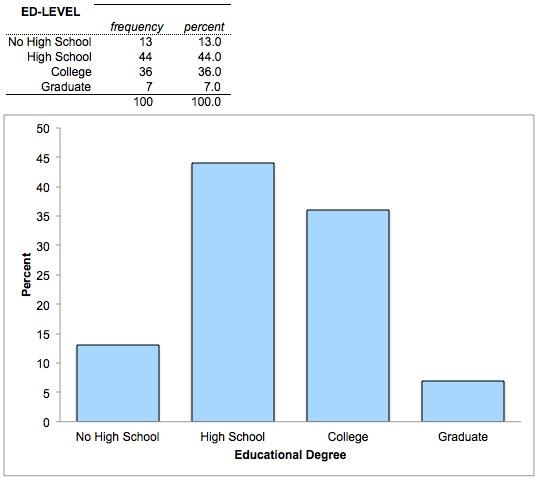
Education Level
Thirteen percent of the subjects have no high school degree while 44% have high school degree. Forty three percent have a college or college graduate degree. See the bar chart in Appendix D.
Descriptive Statistics Interpretation
Interpretation
Body Weight
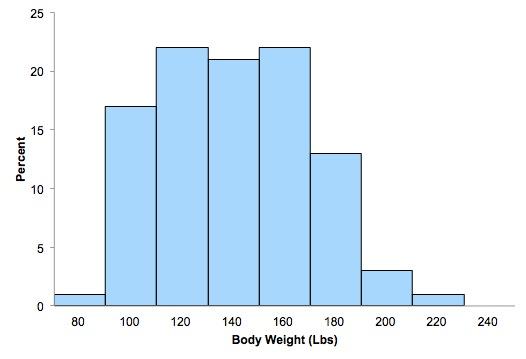
One hundred subjects were randomly selected. Their body weight was observed between 99 and 234 pounds. Their average weight was 149 pounds, with a variation of plus or minus 30 pounds. One half or more were above 149 pounds. There is 95% confidence that the population body weight average is between 144 and 155 pounds.
Age
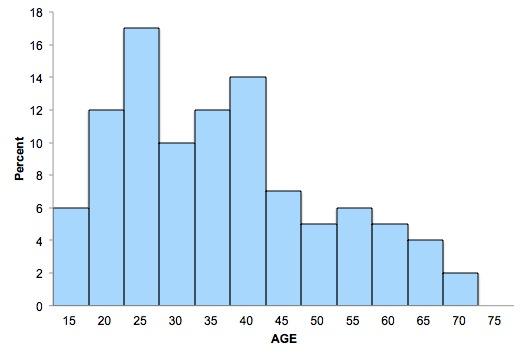
The data was significantly skewed. One hundred subjects were randomly selected. Their ages were between 18 and 74 years, with a variation of plus or minus 10 years. One half or more subjects were 36 years of age or older. The middle half of the subjects’ ages fell between 27 and 47 years. The most frequent age was 36 years.
APPENDIX A
Body Weight and Age Histograms
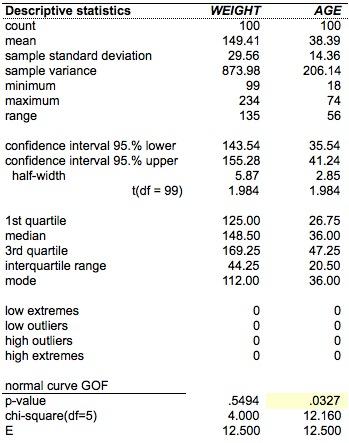
APPENDIX B
Descriptive Statistics Body Weight and Age
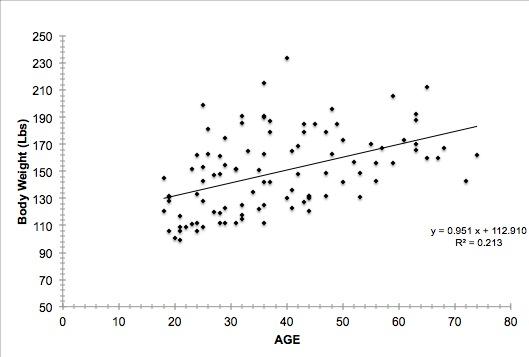
APPENDIX C
Scatterplot Body Age versus Weight
APPENDIX D
Bar Chart Education Level
Copyright © 2014 by University of Phoenix. All rights reserved.


