List of Materials + System Requirments
ENGINEERING LOG BOOK
WEEK 1
Over the break between classes, basic program functions were completed and tested. The test were conducted with simulated input on all sensors. The outputs for the DAQ 6001 were found to switch correctly between 0V – 5V when activated.
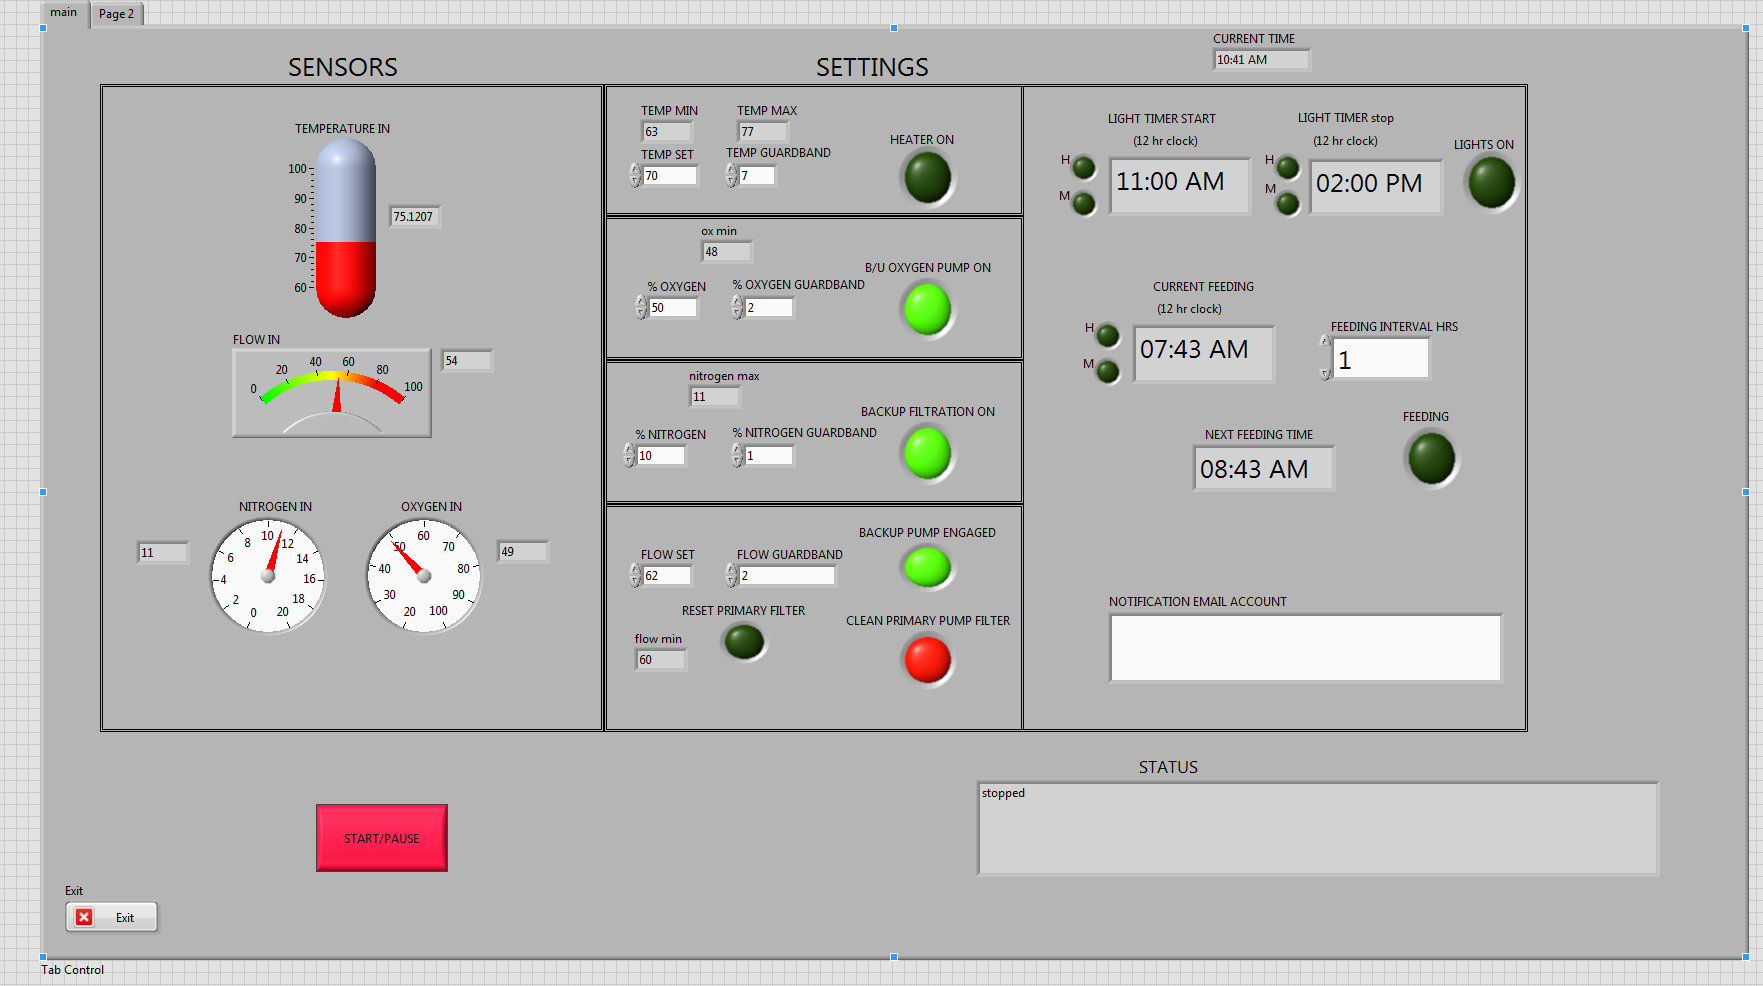
The Gui was slightly modified and will be continued to be updated as the need arises during the prototyping.
The format of the program consists of several simultaneously running processes. The first is the event handler and message handler pair. This is the main control engine for the project. It monitors front panel changes and controls the polling of the sensor inputs and the activator outputs.
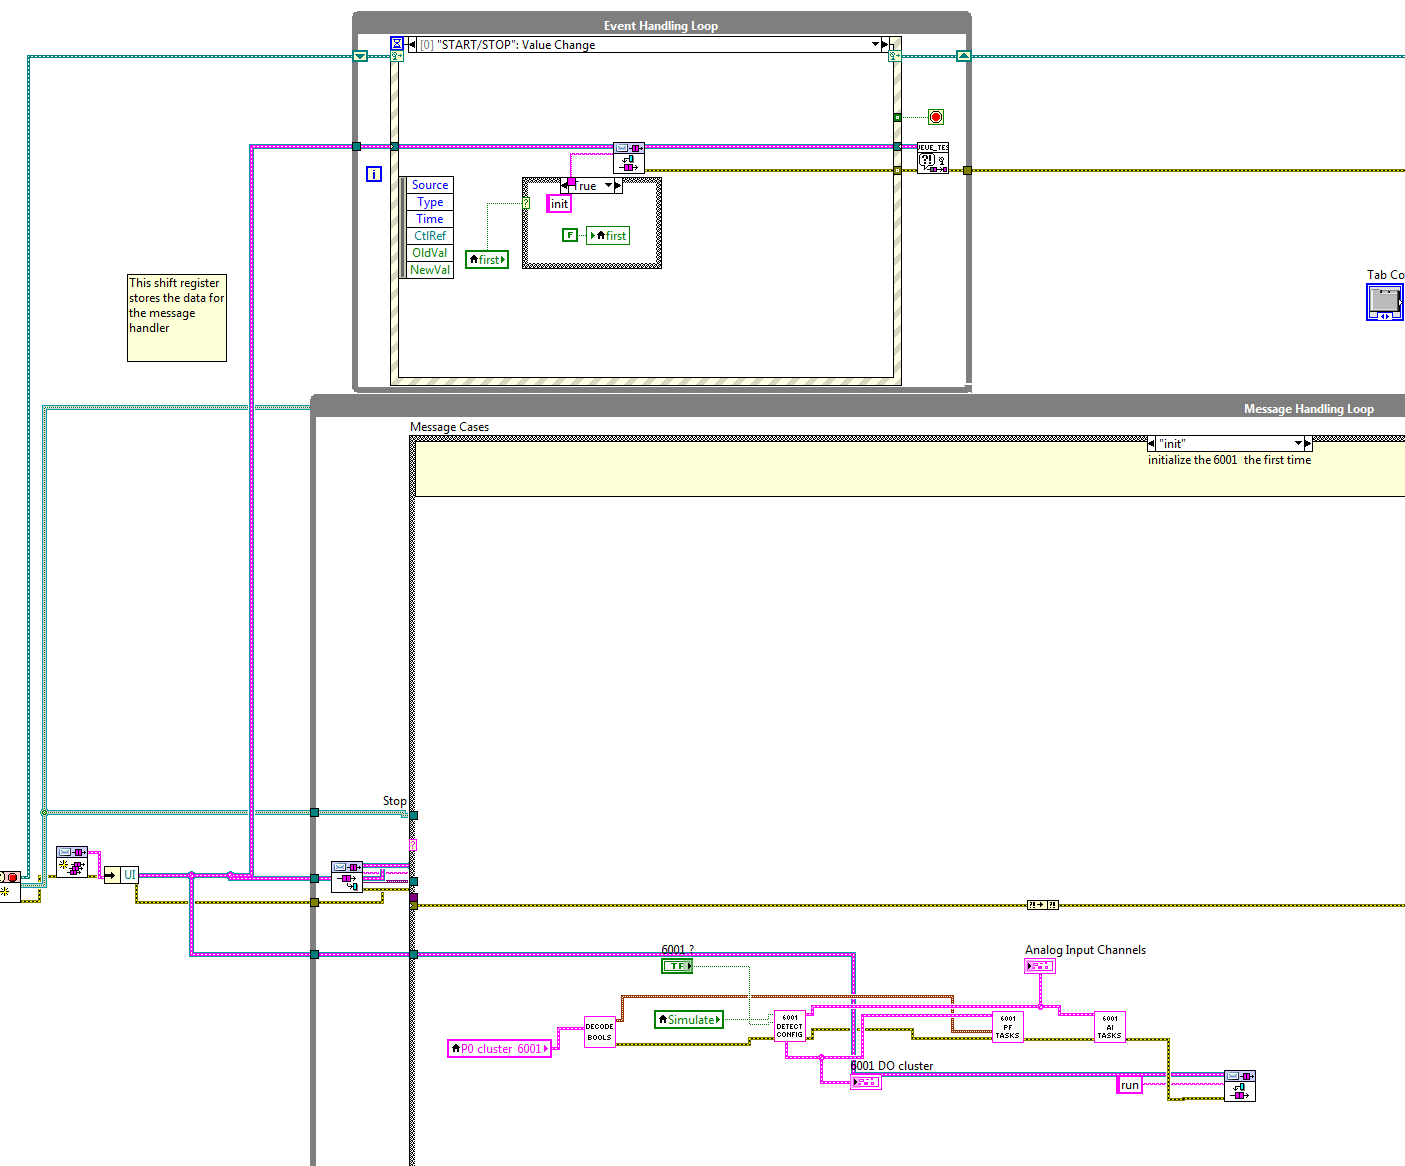
The second is the timing loop. This monitors the system clock and also controls the feeder timer
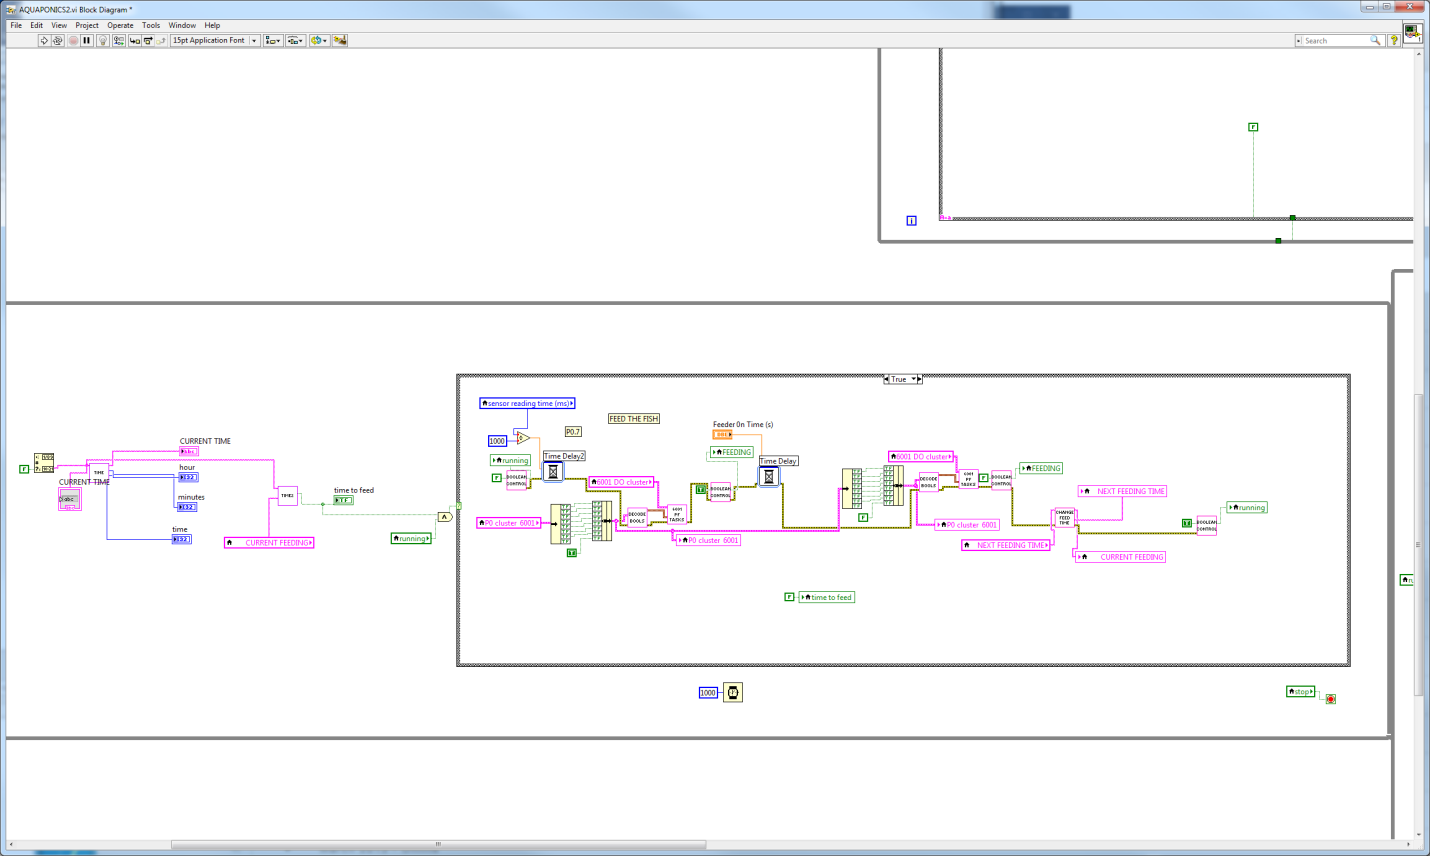
The third portion controls the DAQ, it read the sensors and controls the outputs
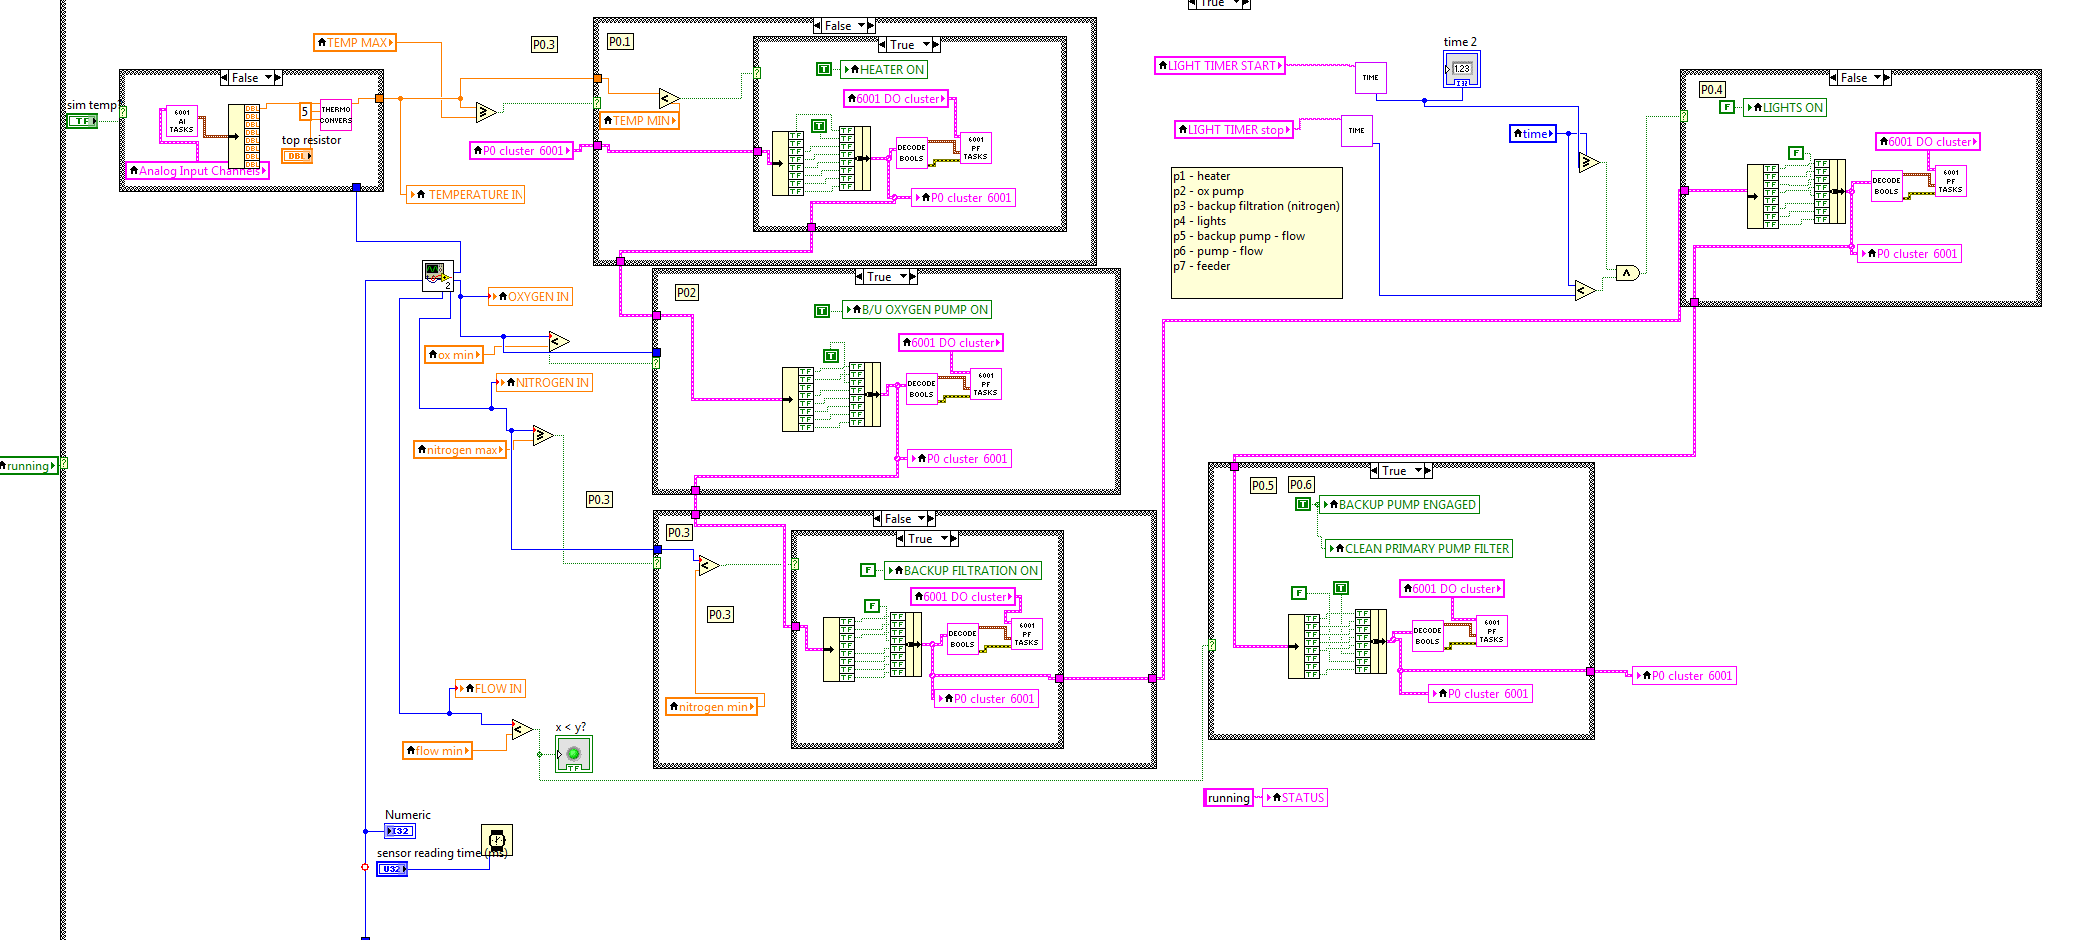
So Far the outputs are defined as:
P1 – heater
P2 – Back up oxygen pump
P3 – Back up filtration pump
P4 – Lights
P5 – Back up flow pump
P6 – Primary flow pump
P7 – Feeder
The only input thus far integrated is the temperature probe which is on A0.
Sensor –
The temperature probe was implemented and tested. The selected temperature probe is the Atlas Scientific PT-1000, and the spec sheet can be found at the following link, http://atlas-scientific.com/product_pages/kits/temp_kit.html
The thermocouple changes resistance according to temperature and can be converted to Celsius through the following formula.
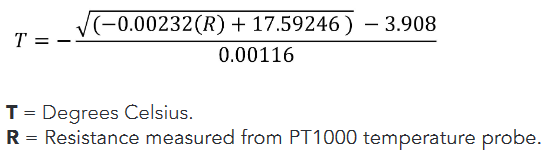
Since the DAQ 6001 cannot directly read resistance the following circuit was implemented.
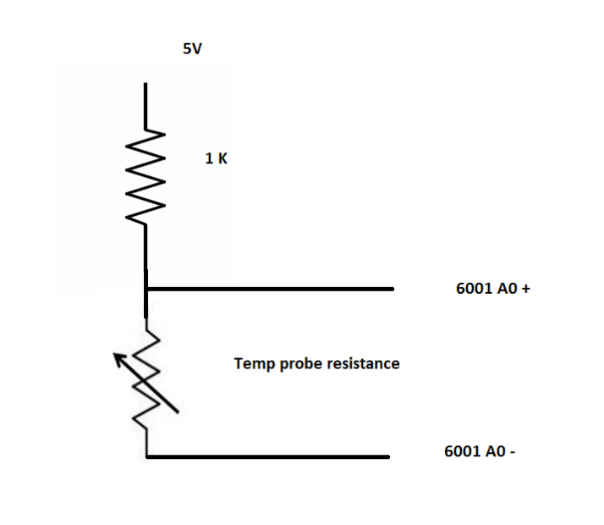
The voltage on the A0 input is read and converted to Fahrenheit with the following code.
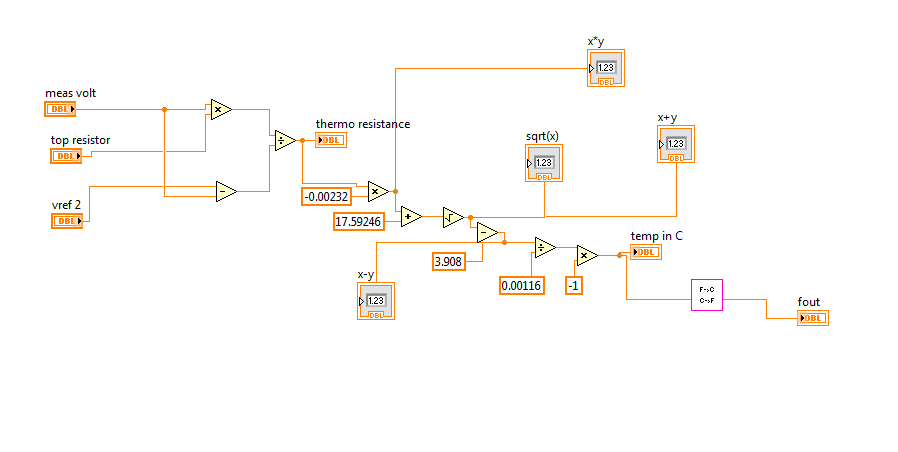
This was verified through using both the temp sensor and also a power supply to ensure that the conversion and DAQ input values were correct.
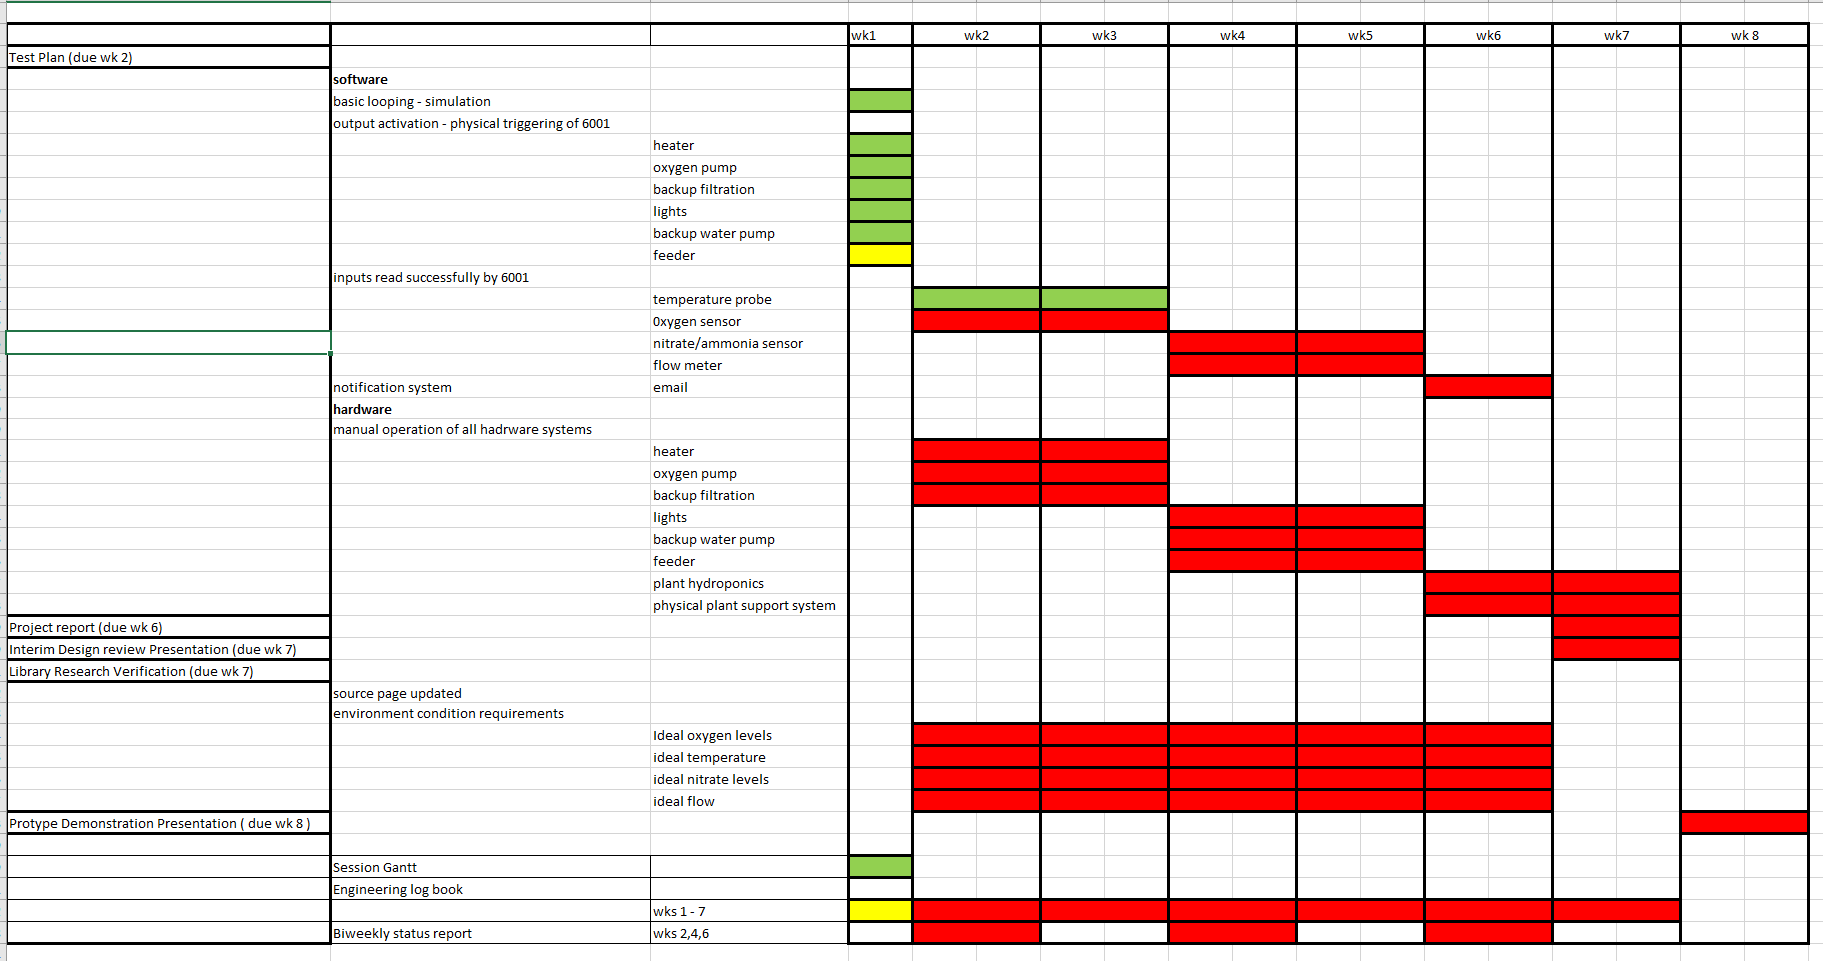
In addition a session Gantt chart was created to make sure we are on task.
SOFTWARE UPDATES
This weeks project was the interface of the Oxygen monitor. The spec sheet for the monitor can be found: http://atlas-scientific.com/_files/_datasheets/_probe/DO_probe.pdf. The probe works through a once a year or so measurement in the air , then monitoring the measurement in water the percentage of dissolve oxygen is calculated by water value/air value *100. The difficulty with this programmatically is making sure there is an initial value and offering the option to re calibrate the probe on demand. This was solved by maintaining an external file with the air oxygen value and updating this value on demand. The initialization portion of the program checks for the existence of this file and properly redirects the flow if it is not there.
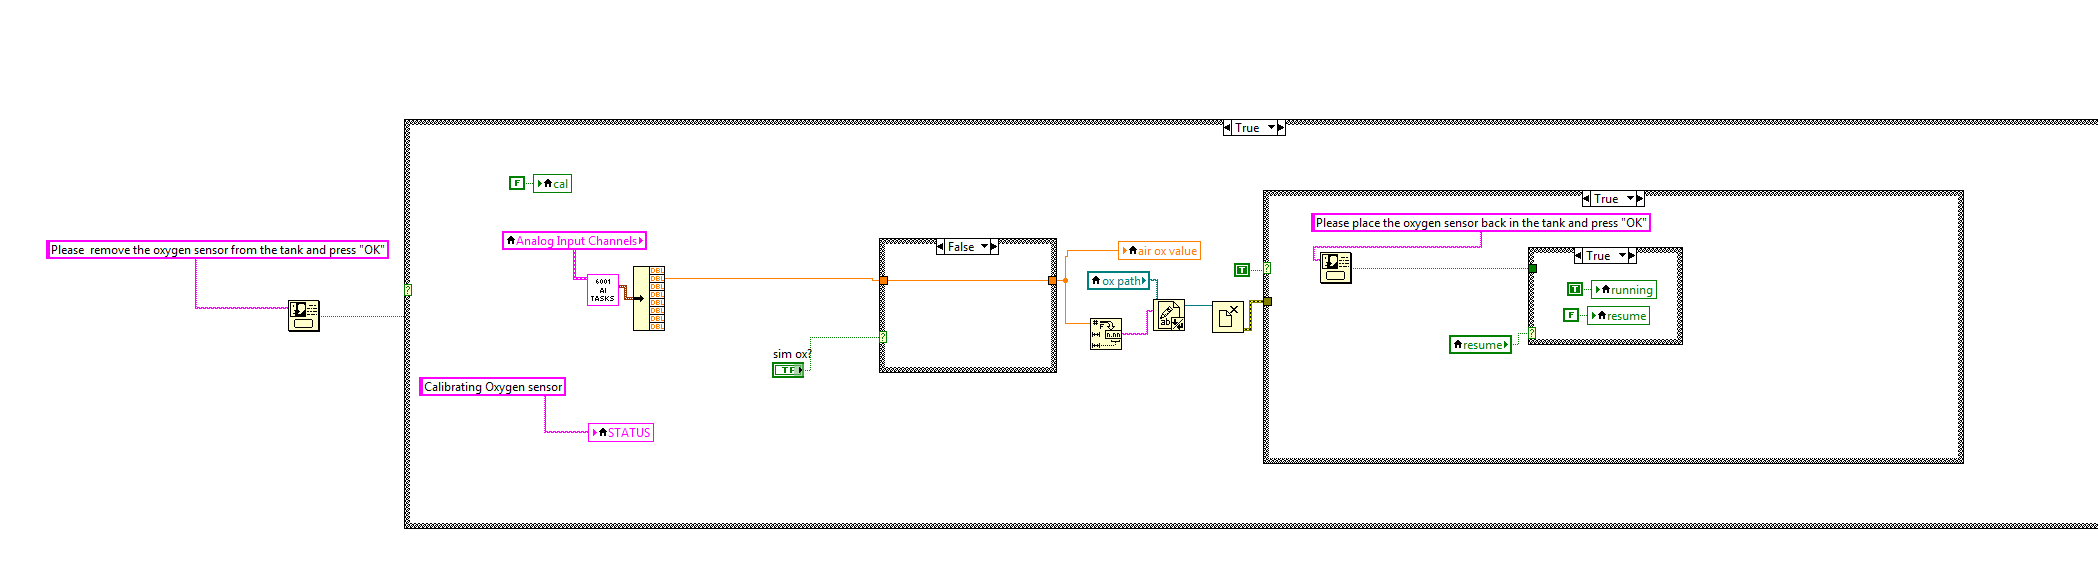
This is the portion of the program that prompts for an “in- air” measurement. The probe is connected through analog input A1 on the DAQ 6001 and is a voltage measurement in the mV range. The program was verified to be reading the voltage correctly. In addition a simulate value path was maintained so that the program could be run in a simulated manner.
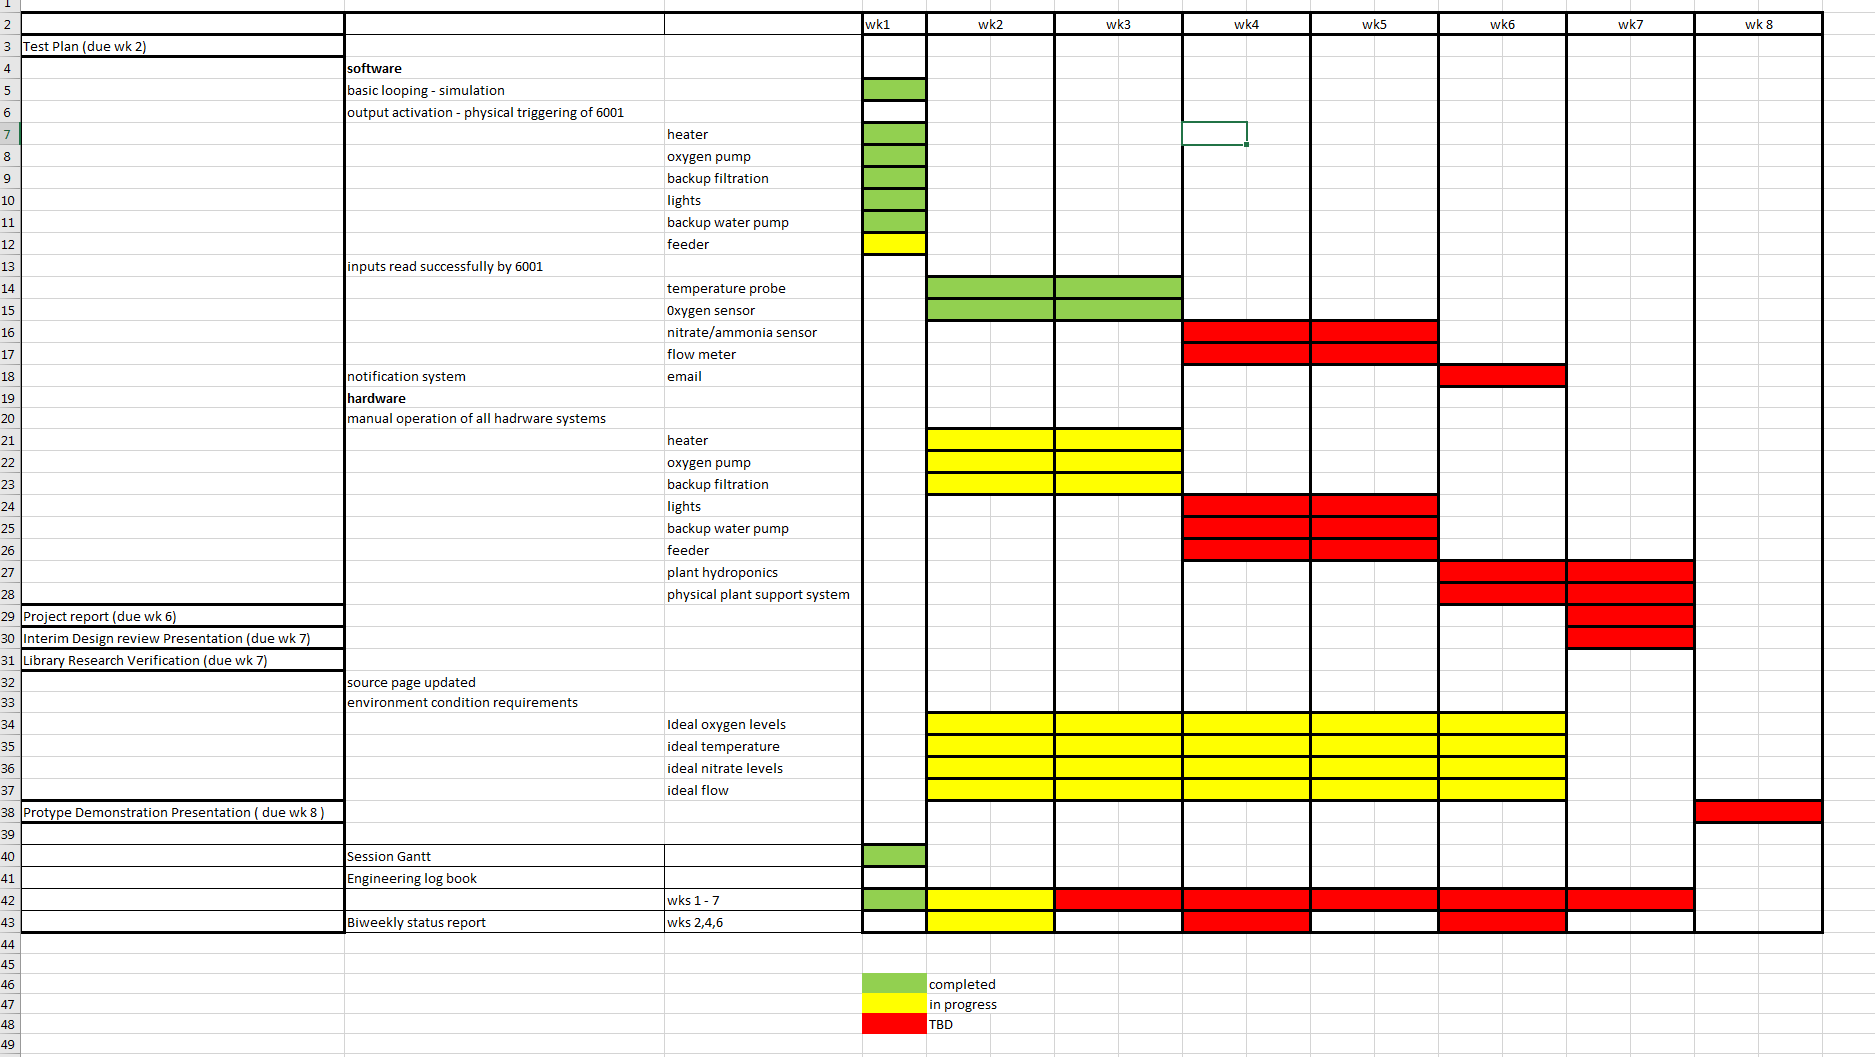
Session Gantt updated for week 2
SOFTWARE UPDATES
This week’s tasks were a revamp of the controls on the GUI and to set up the logging system.
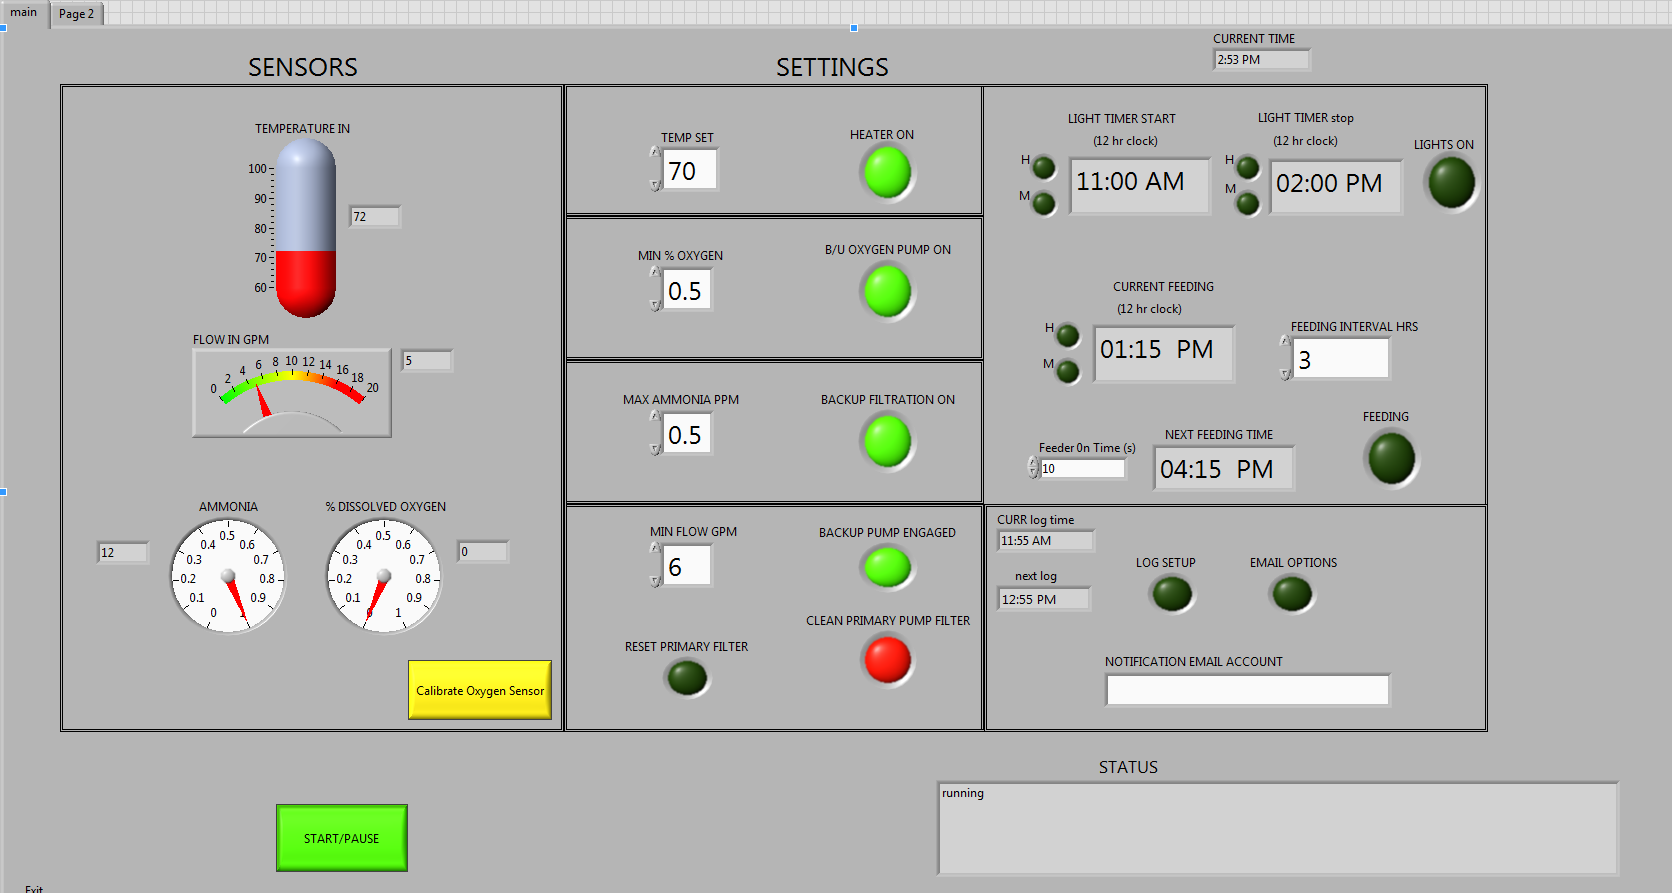
GUI front panel with new control Values
The flow, Ammonia, and dissolved Oxygen controls were redefined with values that are more in line with actual aquarium parameter. The low and high values were also redesigned. The actuators will be appropriately triggered with values that have been automatically generated as a % of the optimal value. This simplifies operation for the user. We determined at the meeting that a logging system would be useful so that the user could view past values. This was also in preparation for implementing the emailing system.
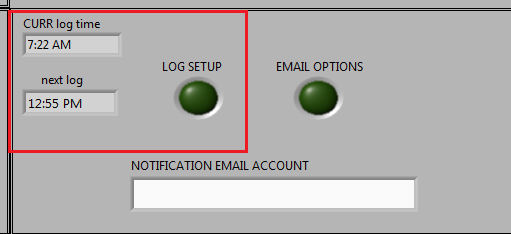
LOG SET-UP FRONT PANEL BUTTON
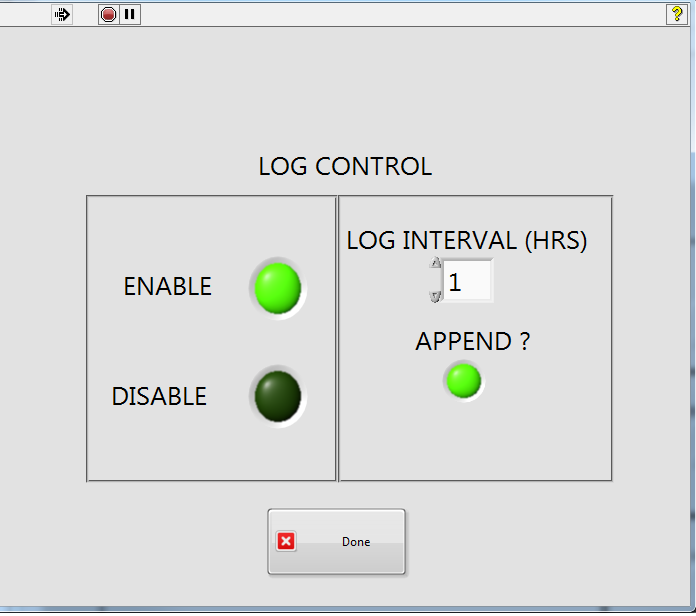
POP – UP PANEL FOR SETTING UP LOG
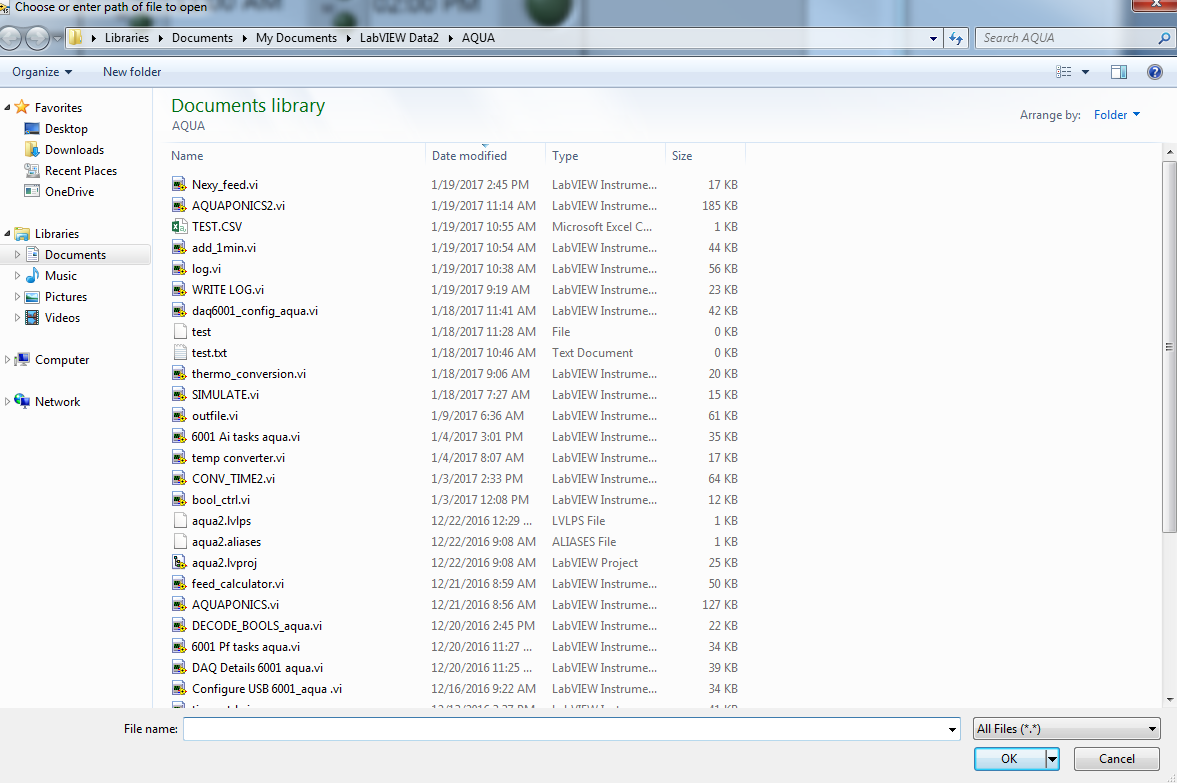
PROMPT FOR FILE SELECTION
Selection of the LOG SETUP front panel button triggers a pop-up which will allow the user to enable/disable logging, appropriately prompts for a filename, and allows appending or overwriting the file. It also allows the user to setup a time interval from 1 to 24 hours for their logging. This file will be able to view by remote login if desired.
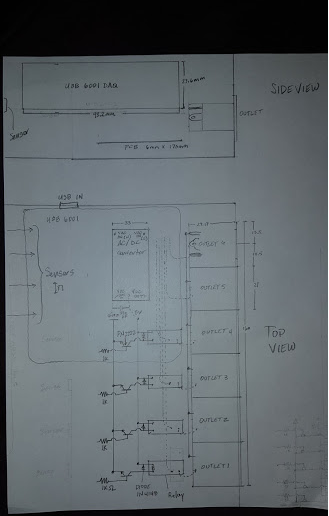
We also had preliminary design work on the PCB layout, the power system, and device footprint with USB 6001 for team review and approval.
PCB LAYOUT
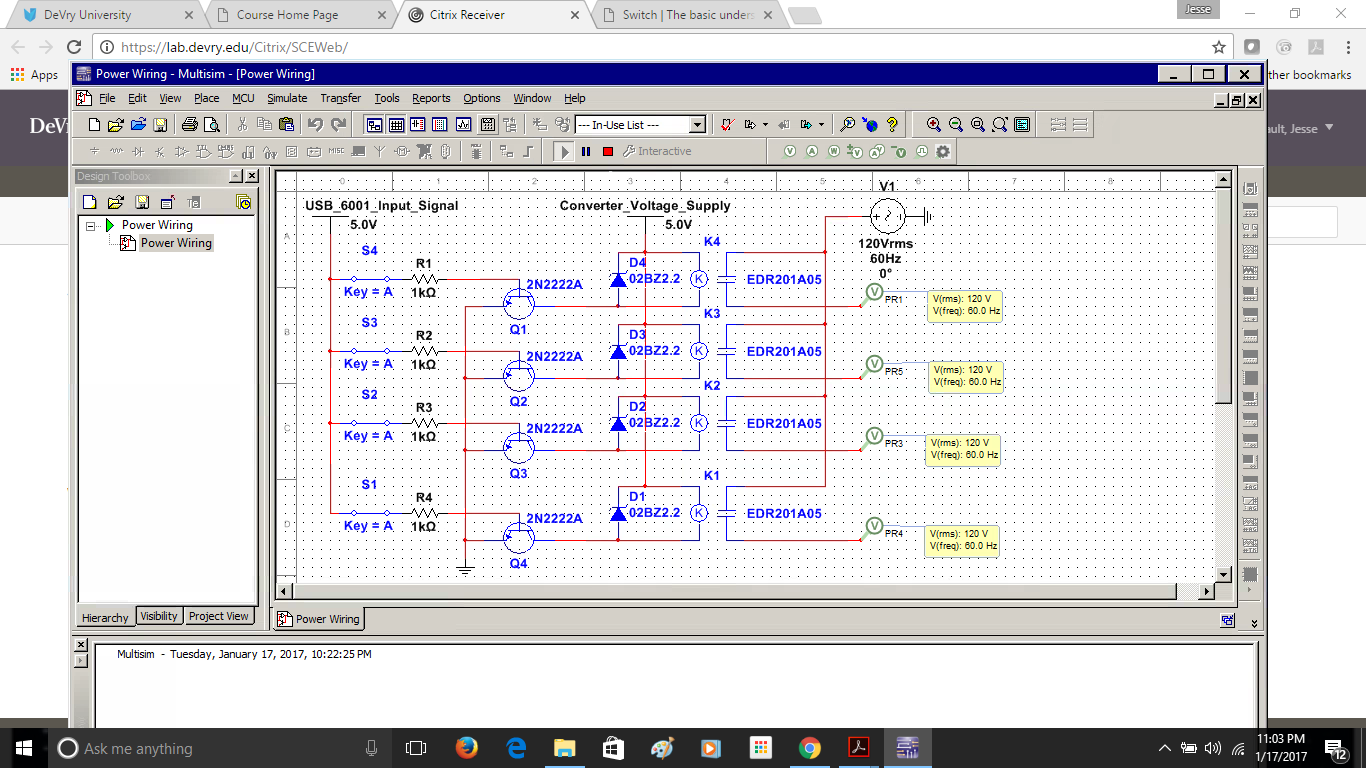
The above wiring diagram shows the input signal from the USB 6001 opening the transistor to sink the current through the relay coil. The relay’s NO contacts will allow 120Vac upon USB 6001 signaling.
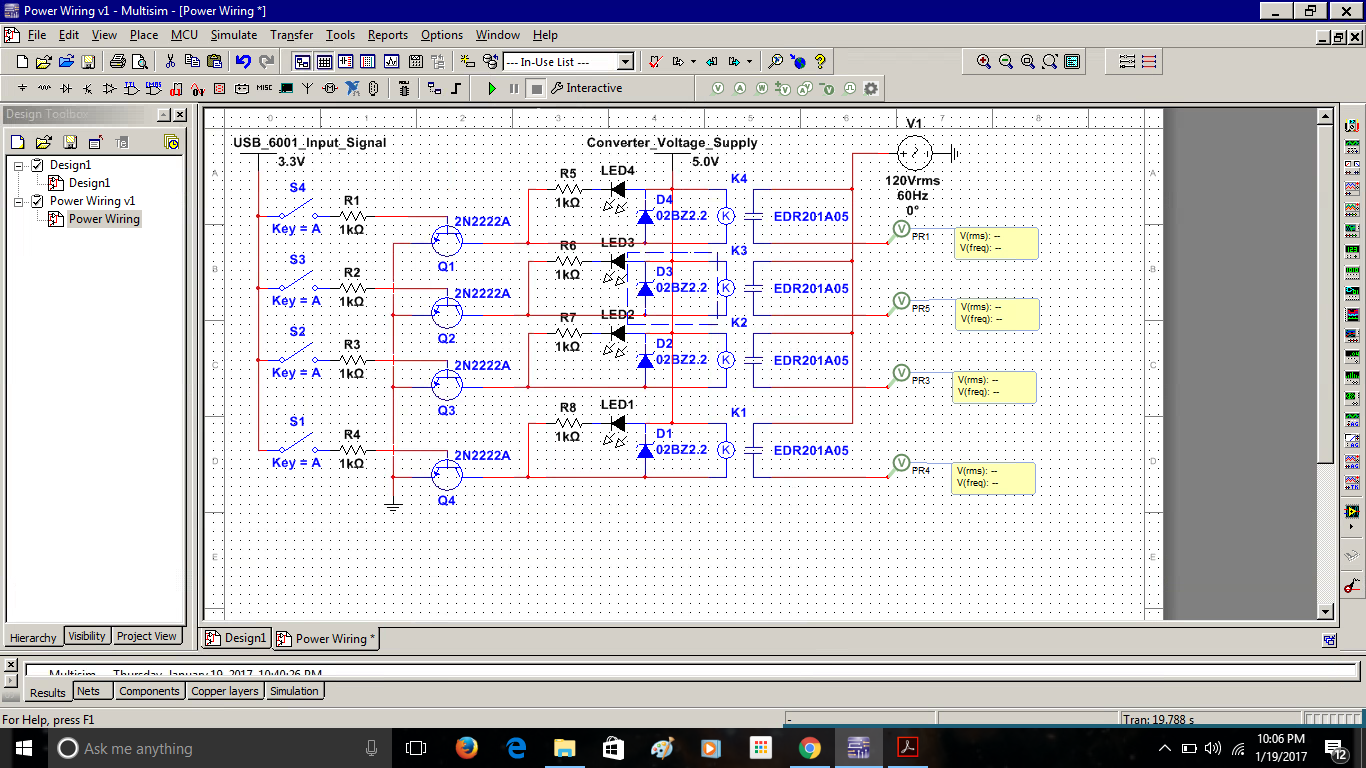
This version implements an indicator LED for use on the enclosure showing channel activation.
The last two sensors were ordered and will be delivered next week:
Flow meter
https://www.atlas-scientific.com/_files/_datasheets/_probe/1-2_flow_datasheet.pdf
Ammonia sensor
https://www.vernier.com/products/sensors/ion-selective-electrodes/nh4-bta/
Power subsystem components are on order with anticipated build over the duration of weeks 4 & 5.
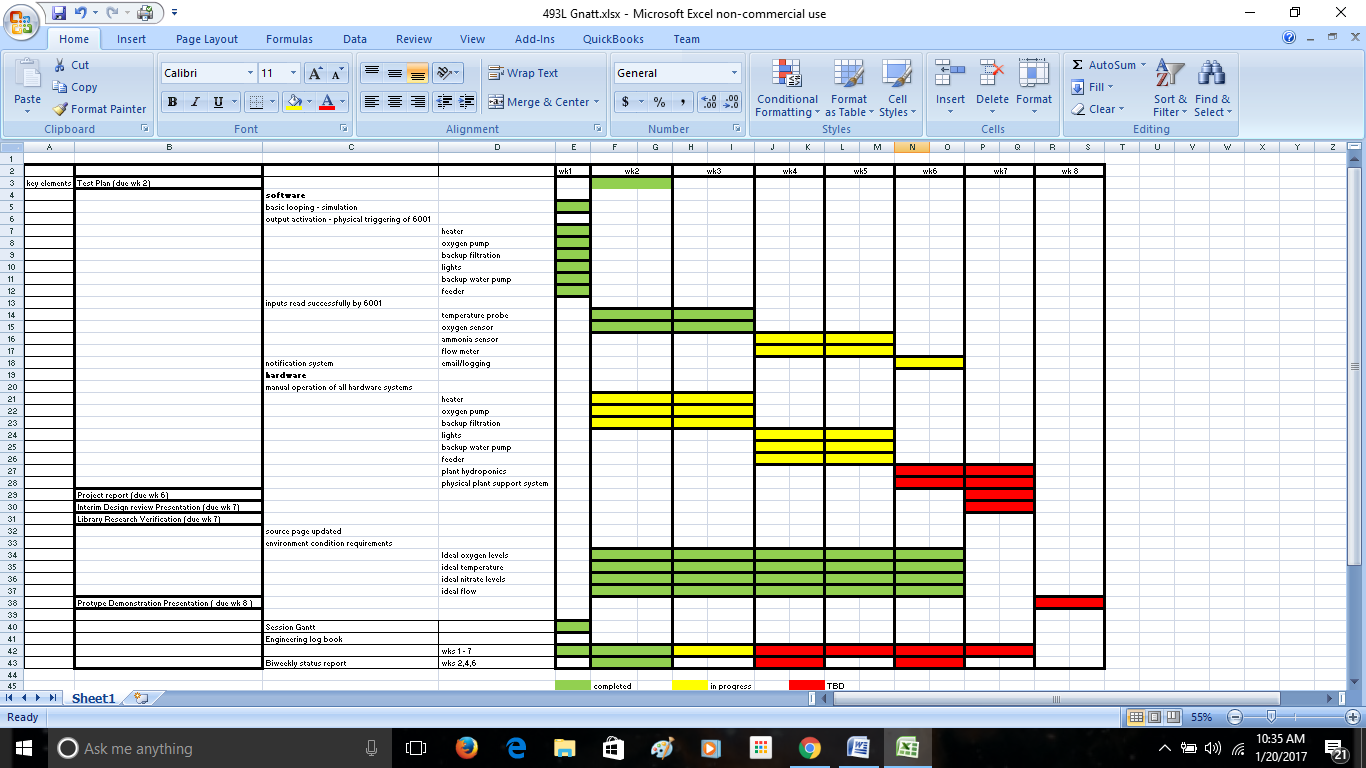
WEEK 3 GANTT
SOFTWARE UPDATES:
The remaining software needs are:
Implement the flow meter algorithm.
Implement the ammonia meter algorithm.
Implement the email algorithm.
FLOW METER:
The flow meter uses a Hall sensor and outputs frequency, that frequency is then converted to a Liters per Gallon. By one of the two following equations:
With a low flow adapter installed:
LPM = 0.2152 * Freq +2.2928
Without a low flow adapter installed:
LPM = 0.3256 * Freq + 5.2004
Then the liters is converted to Gallons
L*0.21467 = G
The Flow Algorithm was instantiated in the following manner:
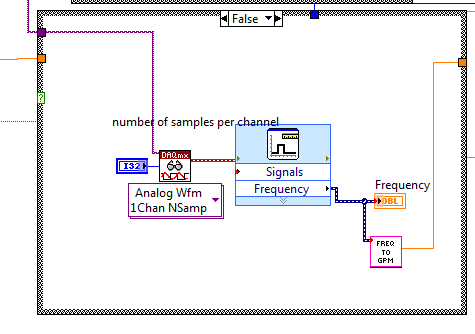
FLOW ALGORITHM
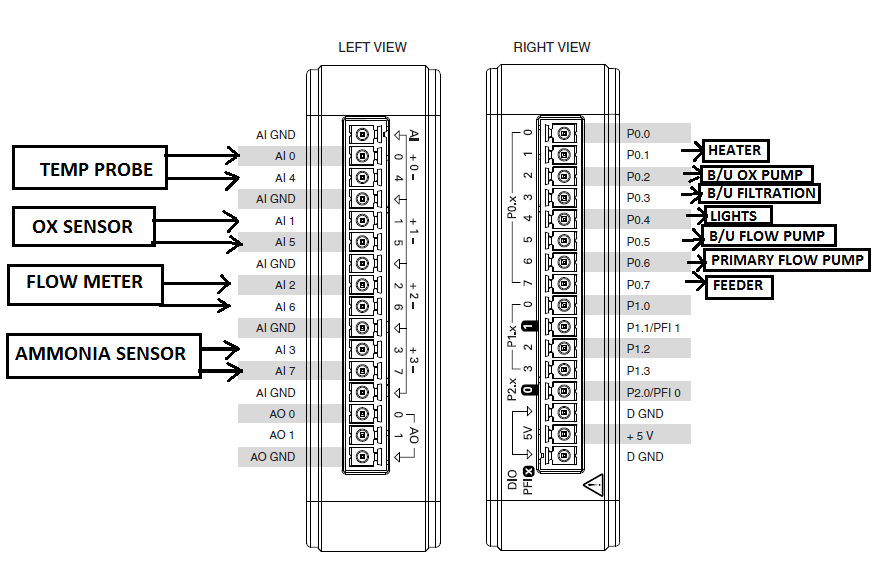
FINAL PINOUTS
SOFTWARE UPDATES:
The remaining software needs are:
The ammonia meter required some signal manipulation to calculate the ammonia concentration in the tank. This was implemented in the software in an “ammonia_math” subroutine
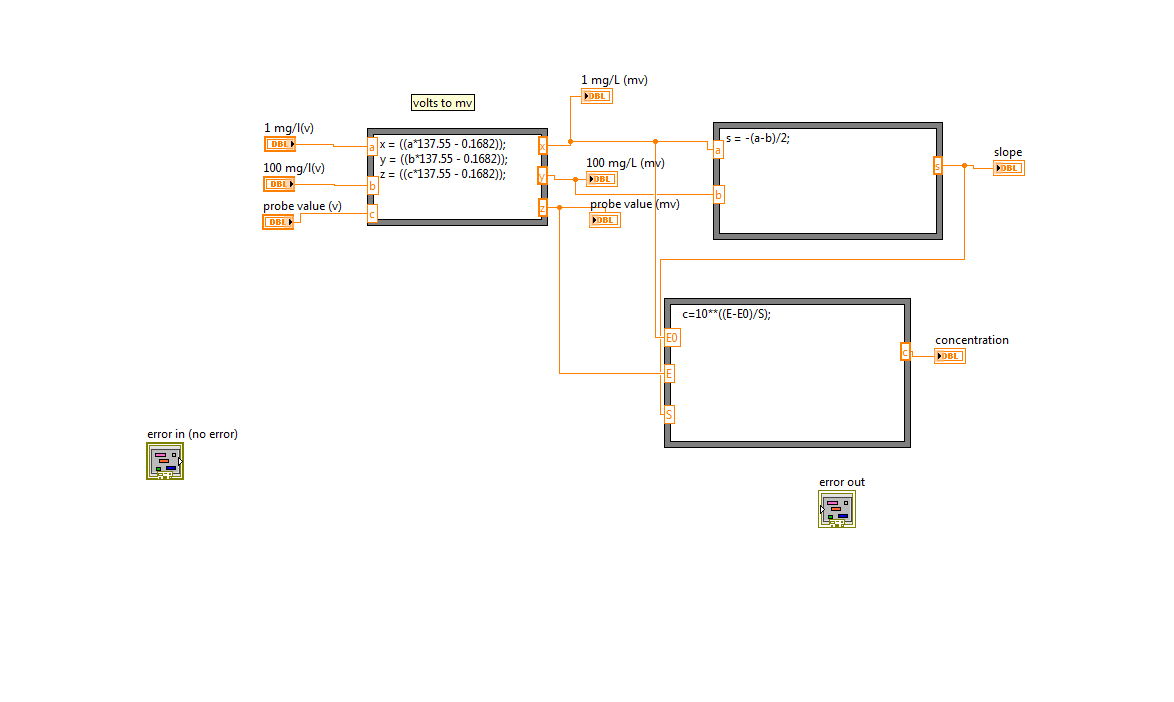
Ammonia_math subroutine
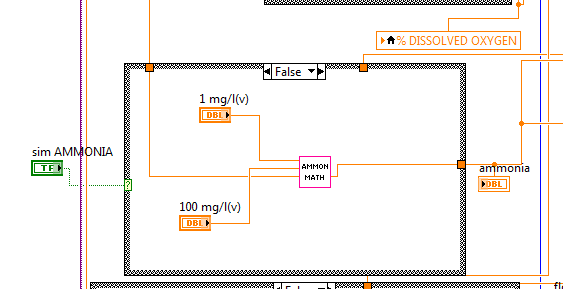
Ammonia Algorithm implemented
Implement the email algorithm.
The email setup was also implemented, however I have yet to actually successfully send an email, and further investigation into protocols is necessary.
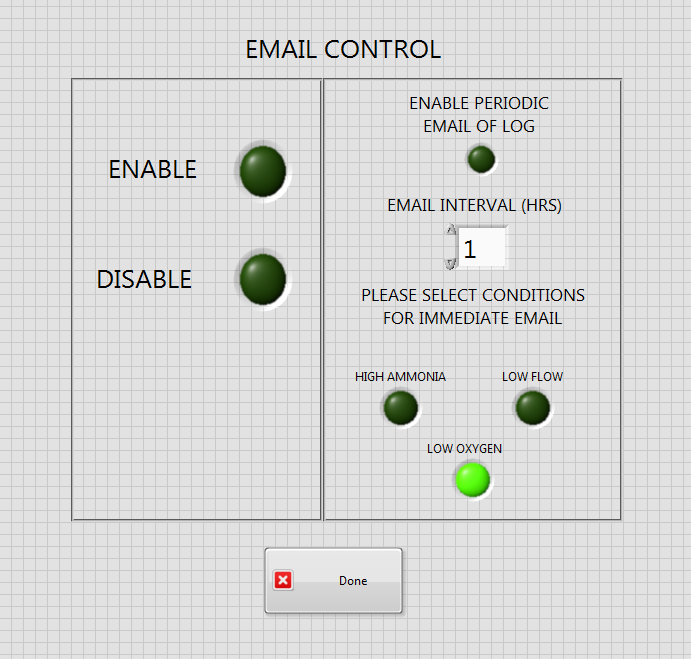
EMAIL SETUP SUBROUTINE
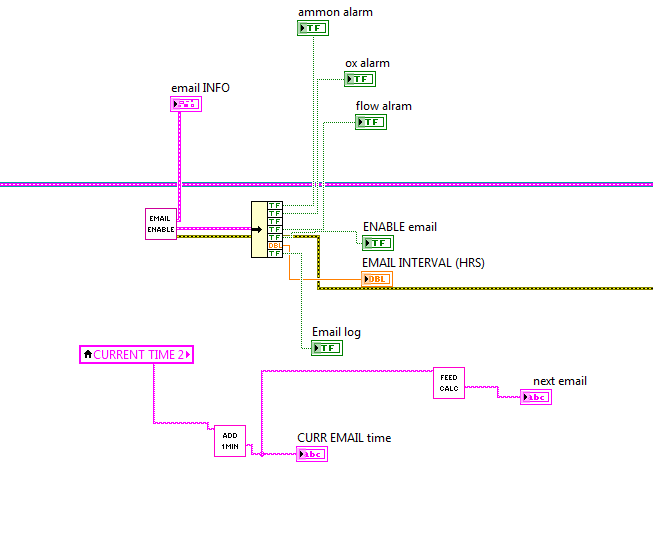
EMAIL MESSAGE HANDLING ALGORITHM
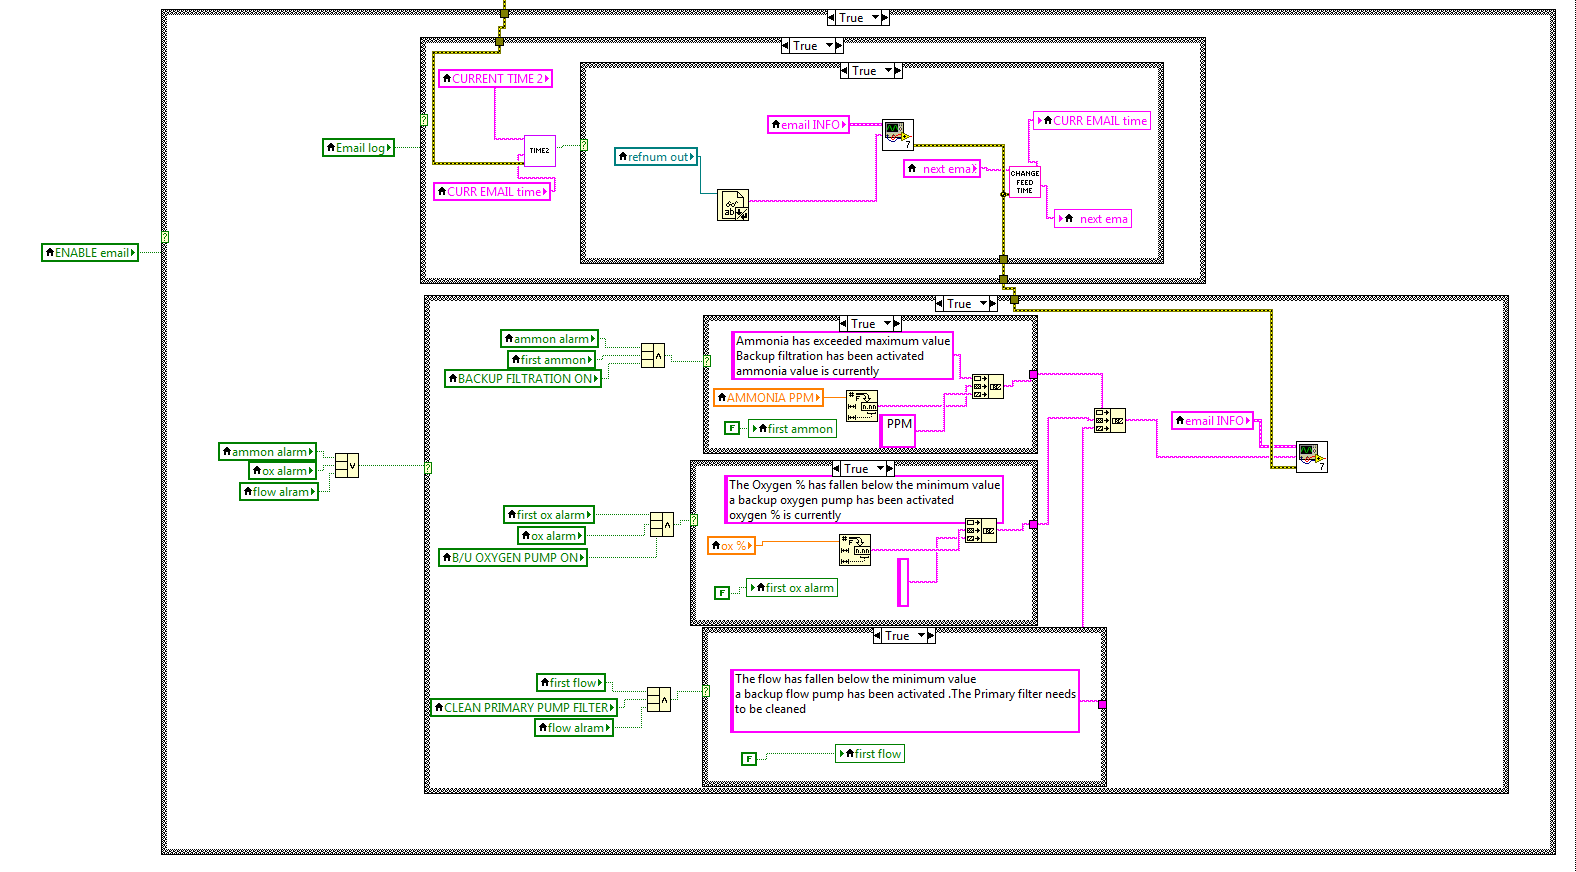
EMAIL EXECUTION ALGORITHM
HARDWARE UPDATES:
Power subsystem
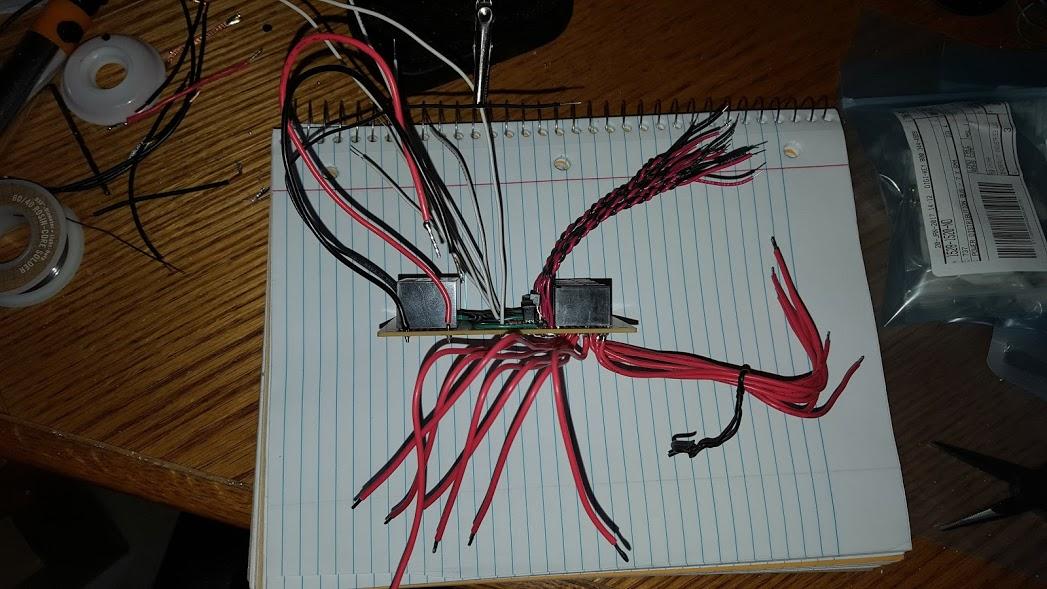
White wires are for USB6001 output signal. 22g Red & black wires are for LED indicators. 18g Red wires are 120Vac activated throughputs.
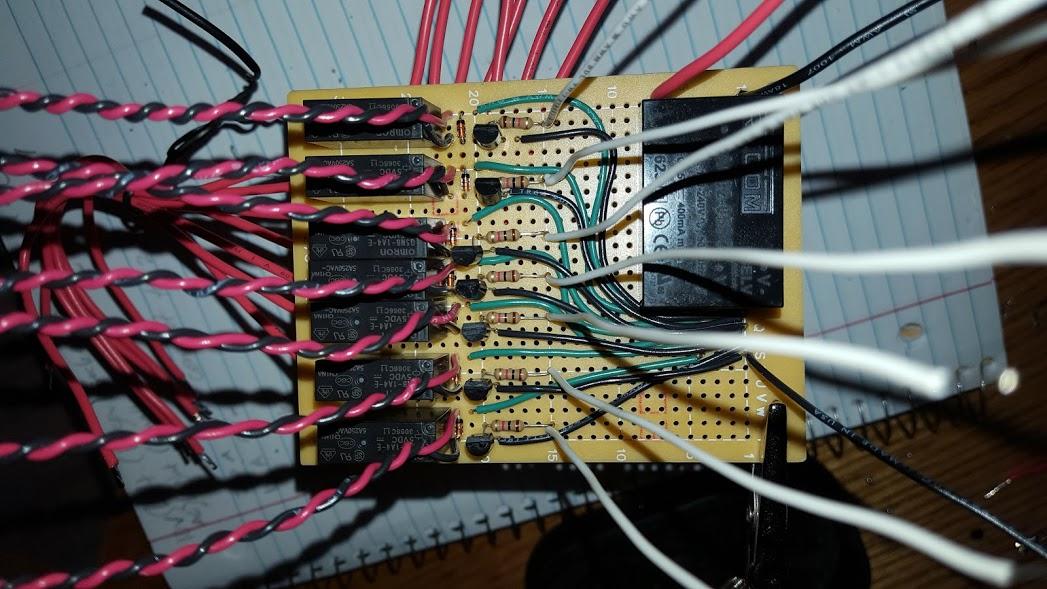
A topside view reveals a completed progress perspective of seven actuated circuits powered by the 5Vdc converter and triggered upon an output signal by the DAQ device.
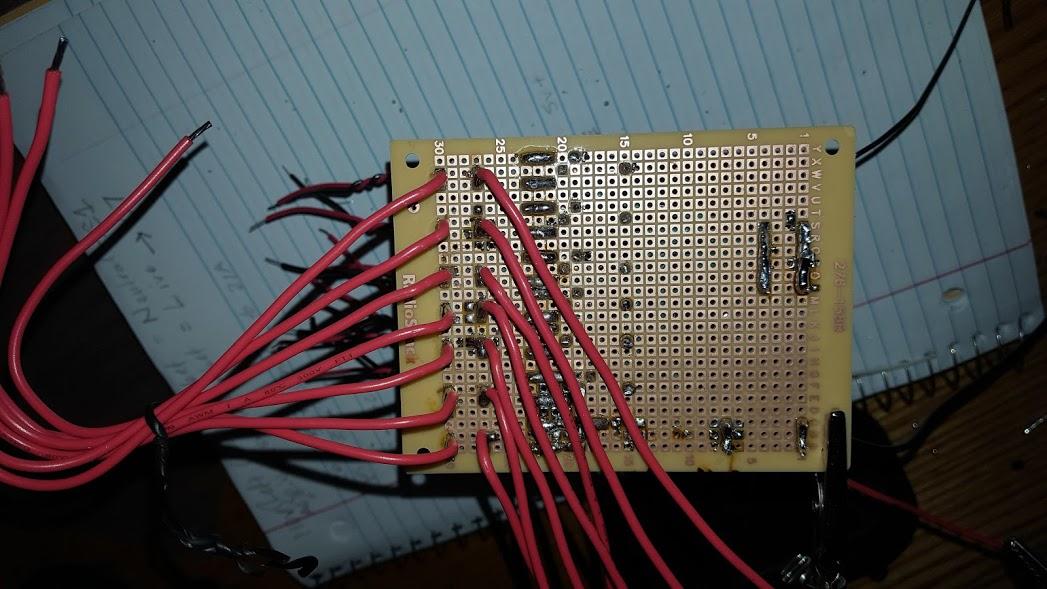
An underside view shows 18g red wires soldered to the NO contacts of the relays. This will carry the 120Vac power to the Aquaponics system actuators for control of the environment.
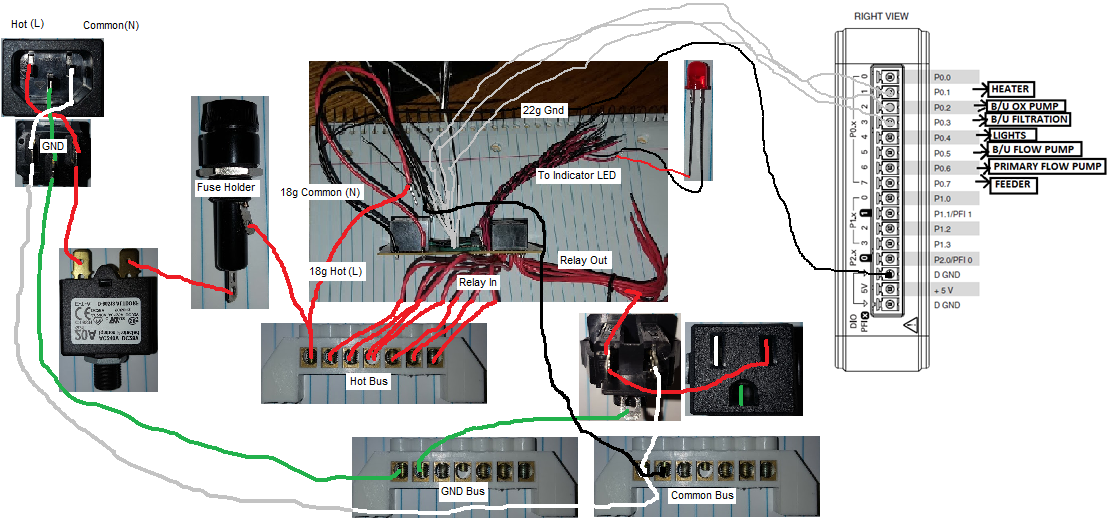
Wiring diagram forwarded with the power board and components to the next stage of development.


