Phase 3 Statistical Analysis and Results
Perform the statistical analysis and report the results of your test.
|
| This assignment should be formatted using APA guidelines and a minimum of 2 pages in length. Use comparison or regression data ***example of comparing two pollution is below: |
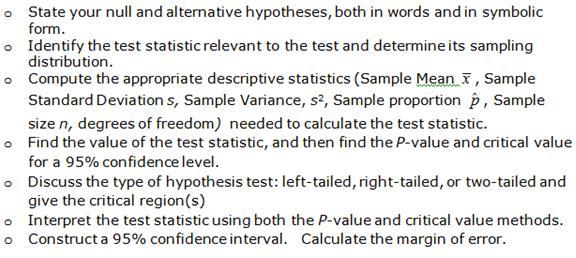
You don’t have to do last bulletin where it talks about construct 95% confident interval….
For test statistics explain if you are using a T, are you using Z statistics
State if you are going to accept or regret the null
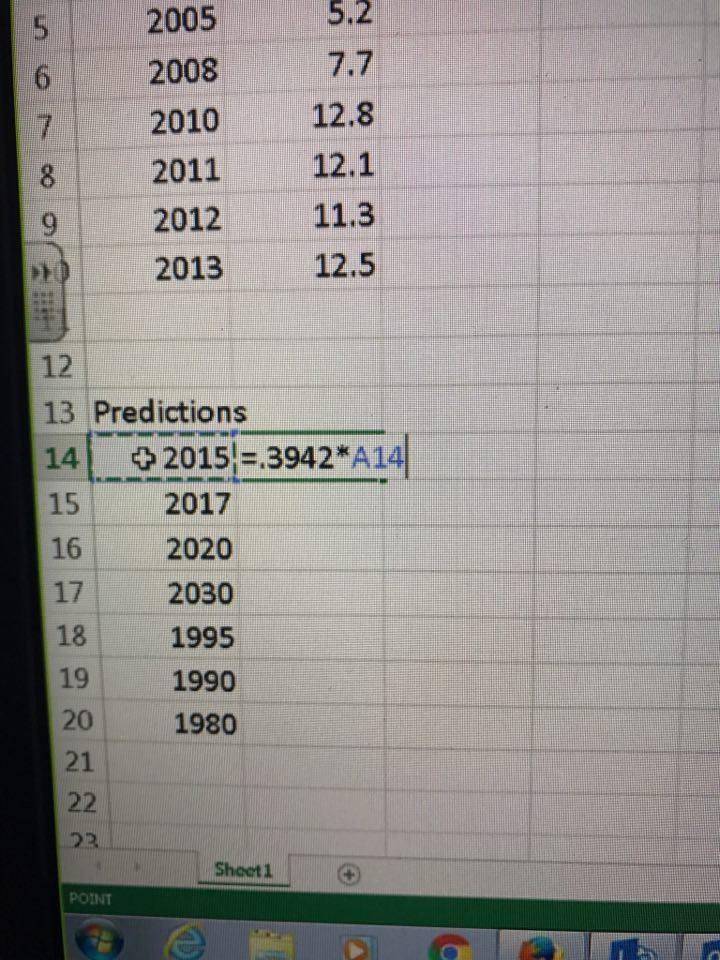
And use equation and show work
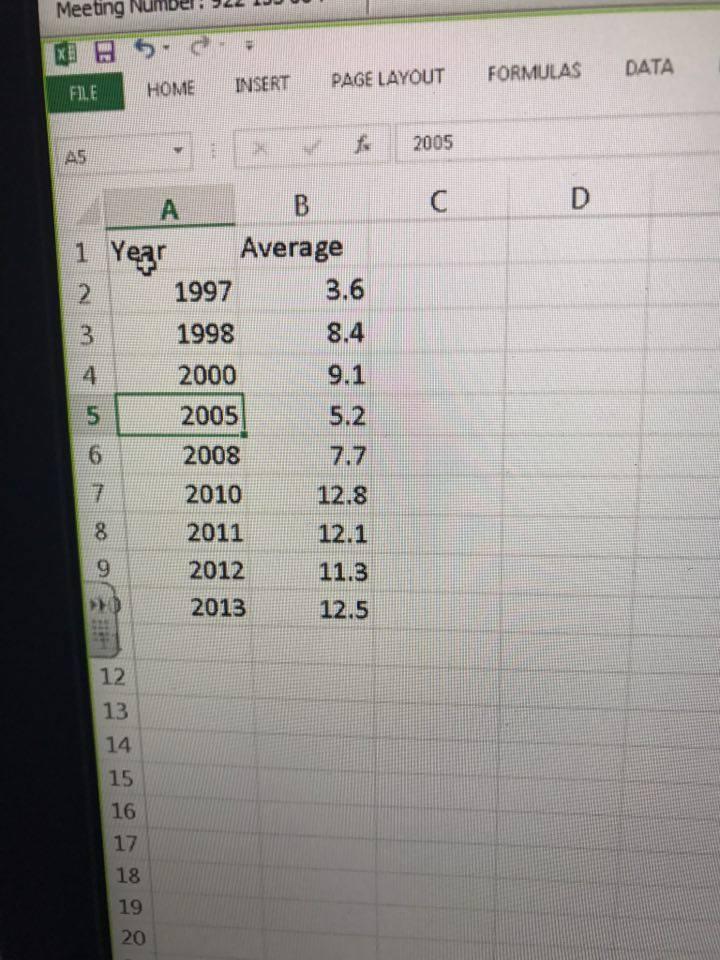
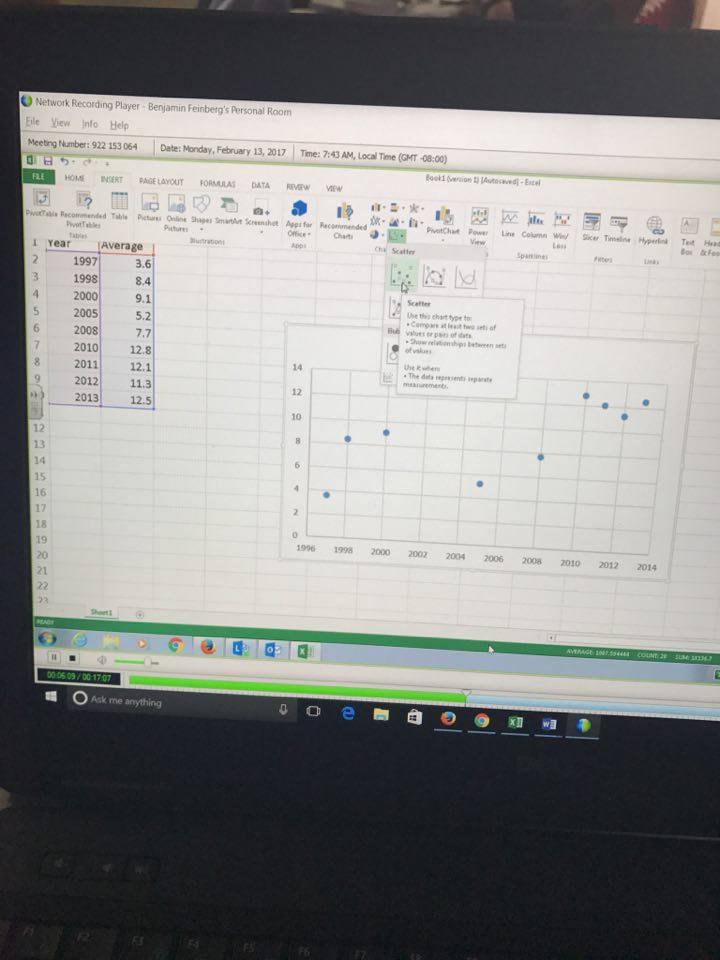
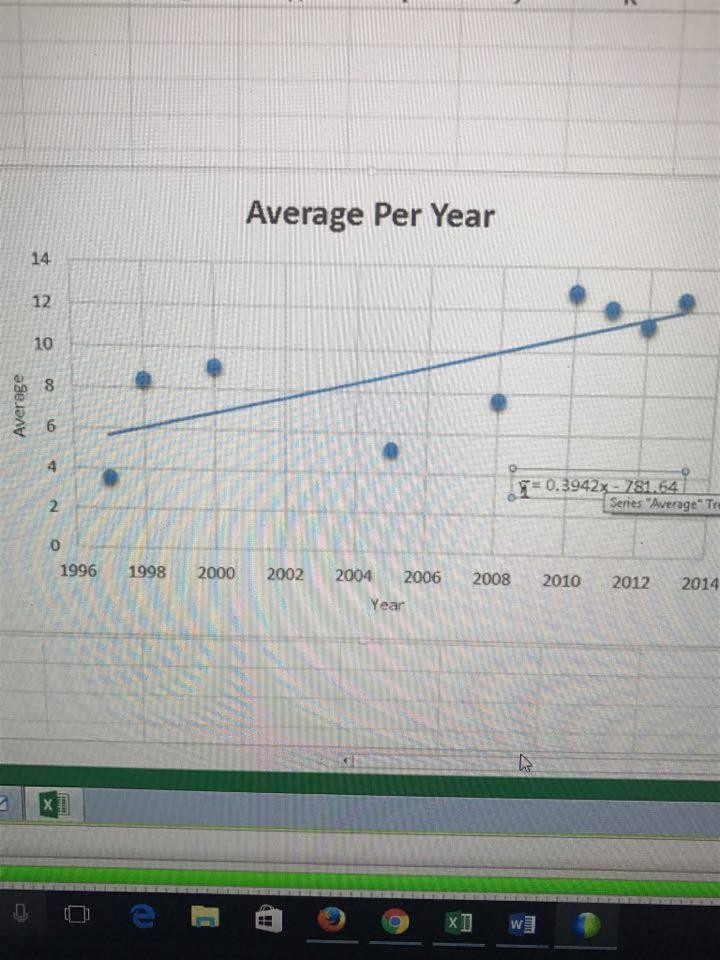
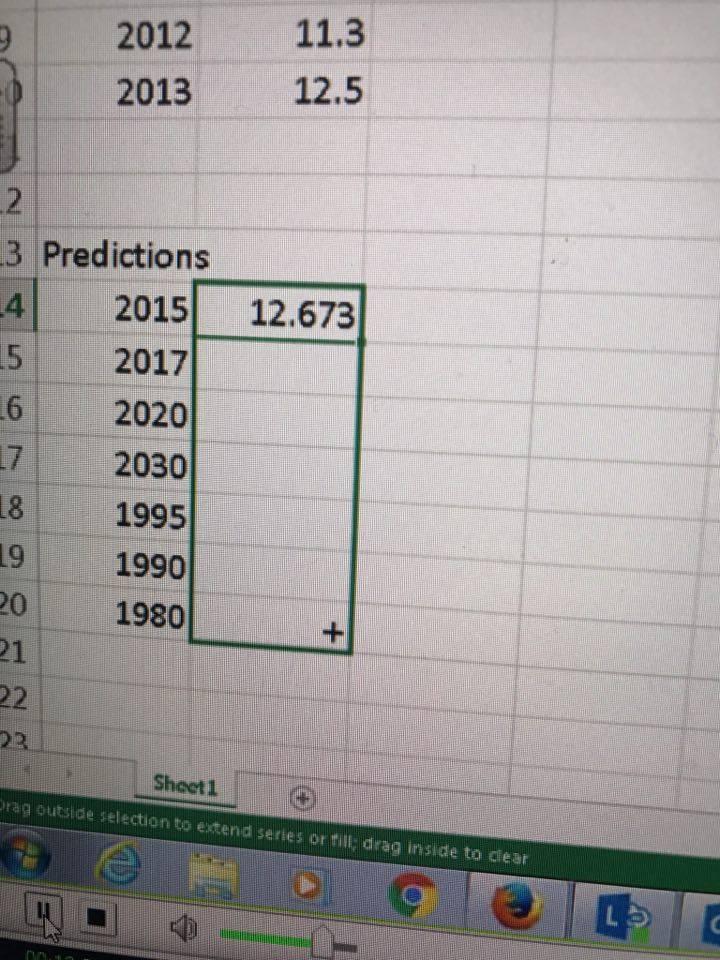
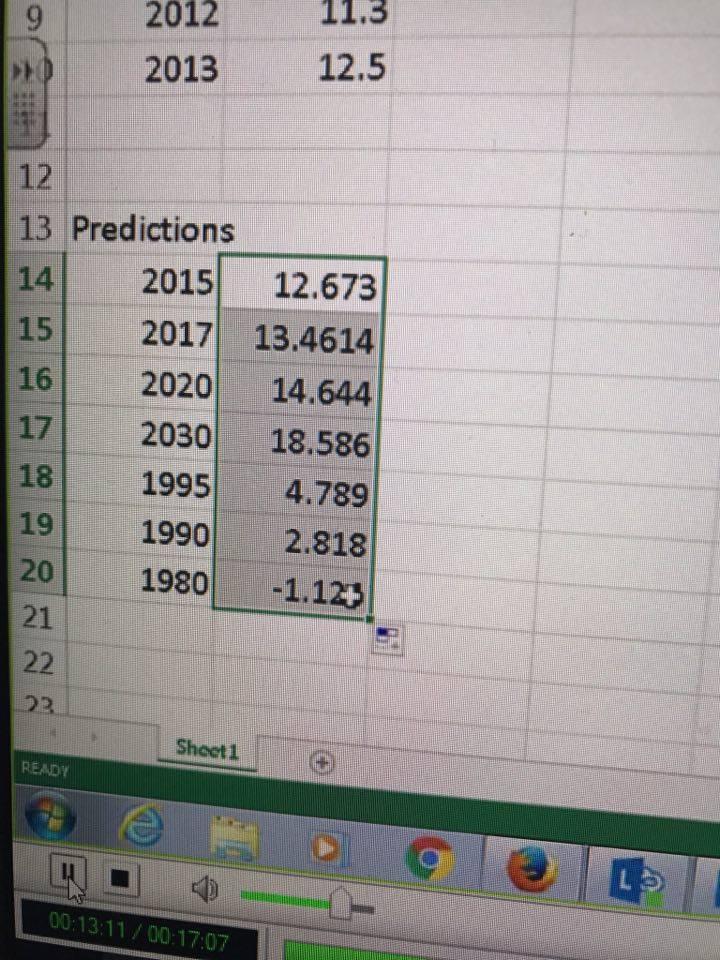
Can show math portion in excel and attach it to write up
Doesn’t need to be in an essay form
Go line by line
*** example of regression analysis is below