physics lab
Format and rules of lab report
3. Lab reports must be in Microsoft word .docx or in PDF formats only. Scanned texts (hand-‐‑written or typed) will not be accepted or graded. If needed, use a NIU computer since equation editor is installed on all of them. Your TA will not accept hand-‐‑written labs. If your lab report consists of any image format of text inserted in between the pages in PDF, that would count as an attempt to plagiarize and would be duly reported.
4. Your data sheets must be signed by your TA before you leave the lab! Failure to do so will be interpreted as an attempt to copy the data from someone else. Your lab reports will not be accepted or graded, even if submitted, unless your data sheet is signed, scanned (legibly snapped photos are OK) and included in your timely submitted electronic report!
7. Please note that your submitted reports will be automatically checked against plagiarism using SafeAssign. SafeAssign compares your work with other student reports from other sections and previous semesters. It also checks for matches against the whole world wide web.
8. Collecting data in groups and writing about the same objectives and procedures will generate “plagiarism” matching rates of up to 30 or 40%. This is to be expected and no cause for alarm. However, any higher match rates will be investigated. If plagiarism is detected then all the students involved (those who plagiarized and those who made their reports available to plagiarism) will be referred to the University’s Judicial Office.
1.3 Lab Write-‐‑up Format
A Lab report should, at a minimum, serve the following functions: Provide a record of the experiment performed and the raw data collected. Provide sufficient and clear information to allow reproduction of the data. Provide an interpretation of the data through its considered analysis.
In this section, we’ll cover the basic format that all of your lab reports must follow. Not following this format will cost you points on your lab grade. All lab write-‐‑ups must be typed on a computer. Your TA will not accept hand-‐‑written labs. Diagrams may be hand-‐‑drawn, but be sure to draw them neatly on graph paper then scan them for inclusion in your report. Graphs, on the other hand, must be computer-‐‑generated. Each of your lab write-‐‑ups should follow the same basic format, which consists of five main sections: Title, Theory, Data, Results and Discussion, and Conclusion.
1.3.1 Cover Page
The cover page should include the title of the experiment, your name, the names of your lab partners, your Lab section letter, your TAs name and the date of the Lab.
The Cover Page should be a stand-‐‑alone first page (Nothing else should be typed on this page): Please follow the following format (notice that you name and the experiment title should be in BOLD).
1.3.2 Theory
In your theory section, you should use the information you learned from the Theory section of the lab manual and from your TA’s introductory lecture to summarize the physical principles being tested in the experiment. This section should be written in a narrative style, separated into paragraphs containing complete sentences. If your experiment involves any equations, you should introduce them in this section. Be sure to use Microsoft equation to type your equations -‐‑ see your TA for help if you don’t know how to use this program.
Each week your TA will go into the specifics of what you need to describe in the theory section of your write-‐‑up, but a good rule of thumb is that your theory section should contain one brief paragraph per concept introduced. Do not simply copy or reword your lab manual -‐‑ this will result in your losing some or all of the points for this section.
You must write everything in your own words. Try closing your lab manual and notes and just describing the concepts as you understand them. You don’t need to go into as much detail as your lab manual does; the idea here is to identify the important concepts and explain them clearly and concisely. Frequently, an equation is far more clear and concise than any sentence could be, so use equations when appropriate.
This section should also contain both a hand-‐‑made diagram and an actual photograph of the experimental setup used to carry out the experiment.
1.3.3 Data
Your data section should contain the raw data you collected in the experiment. Numerical data should always go into tables, and these tables should always have correct unit labeling. Rather than simply sticking a list of tables into this section, you should preface each table with a short description of the data and where it came from. For instance, a write-‐‑up from a lab in which time interval and distance are measured and velocity is calculated might contain something like this in its data section:
Our measurements from step 3, in which we recorded time interval from two fixed photogates to calculate the velocity, were:
|
Time Interval, Δt (s) |
Velocity, v (cm/s) |
| 0.463 | 170.62 |
|
0.489 |
161.55 |
|
0.497 |
158.79 |
|
0.468 |
168.80 |
|
0.469 |
168.26 |
|
0.479
|
164.92
|
Any non-‐‑numerical data you have, such as observations of the behavior of phenomena, should also go into this section. Be sure to write this information down in complete sentences, not just in a list of facts. Finally, be sure to attach your signed data sheet from class to the back of your lab write-‐‑up -‐‑ remember, your report will only be accepted if your signed data sheet is present in the document you upload!
1.3.4 Results and Discussion
In the results section, you need to report your final measurements and how you obtained them. First give one sample calculation for each type of calculation you did to obtain your results (including a mean and error calculation). For instance, in the example above, you would have to include an example of how you obtained the velocity from the time interval:
To obtain the velocity from the time interval measurements, I divided the distance which is fixed by the time interval. By definition of velocity,
v = Δx/Δt v = 79 cm/0.463 s = 170.62 cm/s
Notice that I carried the units through in the calculation.
After you’ve typed your sample calculations, report the final measurements you made. Your TA will lead you through a discussion of error analysis – use this to turn your raw data into a mean measurement and an error on the mean. If you were to go through this procedure on the velocity measurements above, you would obtain a final measurement of 165.49±1.71 cm/s. Your results section might contain the following:
Our final measurement of the current from step 3 was 165.49±1.71 cm/s.
Again, notice that the measurement has the correct unit label.
Finally, if your experiment involves making any graphs, diagrams, or analyzed data, put them into this section. Graphs should be computer-‐‑generated and have a title, labeled axes, and unit labels. Always use scatter plots when making graphs, never line graphs. If the curve is linear, you will be asked to use a linear curve fit and put the slope of the curve fit on the graph. Talk to your TA if you are unsure how to do this.
An example of what your scatter plots should look like is given in Figure 1.1. It shows a graph of grade v. hours studied per week. This means that “grade” goes on the y-‐‑axis and “hours studied per week” goes on the x-‐‑axis, as I’ve done in this graph.
Figure 1.1: An example scatter plot -‐‑ note that the individual data points are not connected as in a line graph
Now since there’s a linear relationship between these two variables, we’ll add a linear curve fit to the graph, shown in Figure 1.2. Note that the equation of the linear curve fit is shown on the graph – this is very important, as often we’ll be using either the slope or the y-‐‑intercept in our analysis of data.
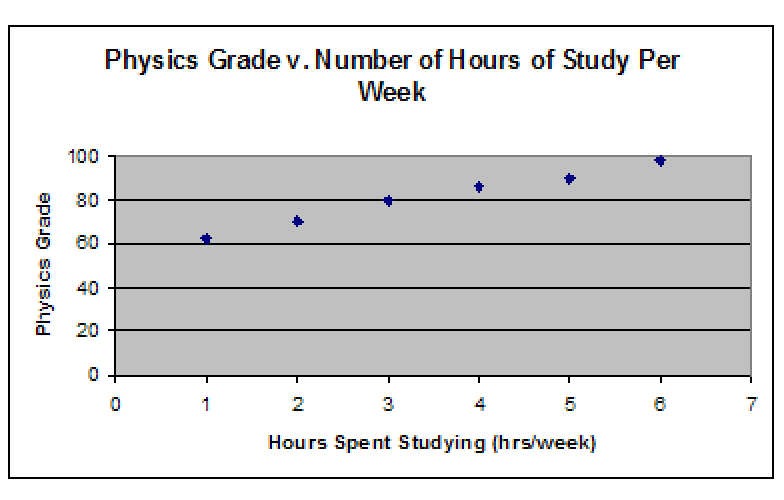
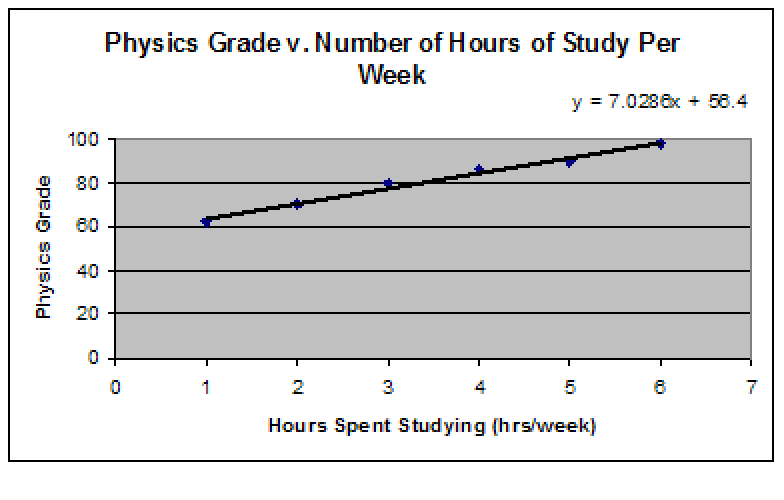
Figure 1.2: Adding a linear curve fit
Diagrams may be hand-‐‑drawn, but they must be drawn neatly on graph paper. If the diagram involves straight lines, use a ruler to draw them. Always label your diagrams and make sure that each individual diagram occupies at least one-‐‑half page of graph paper.
Discussion is one of the most important sections of your lab report. Your discussion section should analyze the results you obtained and state whether or not they support the law of physics that the experiment is testing. The “Question” sections of the lab manual list all the questions you need to answer while writing your discussion section. If you make sure that your discussion answers all of them, you will get full points for this section. Do not simply type something like
1. The answer to question number one. 2. The answer to question number two. 3. The answer to question number three.
Your discussion section, like your theory and procedure sections, should be written in a narrative style (in paragraph form with complete sentences). As a rule of thumb, a good discussion section will be at least half a page long.
Most experiments will ask you to include sources of error, improvements that could be made to the experiment, and an additional experiment that could test the same physical principles. You should give at least two sources of error in your discussion
section -‐‑ please note that “human error” is not an acceptable response. Your sources of error should focus on the method itself; assuming that everything worked and you performed the experiment correctly, what could you do differently to improve the experiment? You need to be more specific -‐‑ what particular element of the experiment prevents you from taking accurate measurements? There’s always error in experiments, so being able to improve your experiments will allow you to be more certain of your conclusions.
Next, you will need to list two improvements that could be made to the experiment. Would you use a different type of apparatus? Did you think of a better way to perform a certain step during the experiment? If you can think of an improvement to be made while performing the experiment, you might want to jot it down for your discussion section. But make sure that you don’t simply put “I would improve this experiment by using better lab equipment”. If you feel that a certain piece of equipment could be improved in a certain way, explain how you would improve it.
Finally, you will need to come up with an additional way to test the phenomena you were studying. It’s important that you be able to figure out on your own how to test whether something is true or not, and thinking up these experiments will give you some practice. You don’t need to write anything very long; just write two or three sentences describing your experiment and how it might be performed.


