finishing up a chemistry lab report
Intensity of Color
Introduction:
The goal of this experiment was to determine what factors affect the intensity of color through the use of colorimeter and colorimetry. Colorimetry also called spectroscopy is the process to study various factors that affect the intensity of colors in a given solution. A Colorimeter is a device that can measure the intensity of light transmitted through a solution. This device also shows how light transmittance varies with various wavelength of light. Given the color Red, the intensity was measured and recorded for different concentration levels of the solution. The greater the concentration, the greater the absorbance, which then leads to lower the transmission. All of these concepts are tied together in Beer-Lambert Law A=EbC. Where Absorbance equals concentration times thickness of solution in cuvette container times the constant of the absorbing species and the wavelength of the light used are not changed. Some of the factors that affect the amount of light transmitted through a solution include the wavelength, concentration, distance, and the makeup of the substance. After data points have been taken from the colorimeter, the second half of the lab goal was to create various tables and graphs illustrating different relationships, such as, the relationship between transmittance and the concentration of the solution. From this information, it can be concluded that as Concentration increases, percent Transmission will decrease, as they have an inverse straight line relationship. By following the procedure and testing the solutions, the hypothesis can be tested.
Materials:
Red food coloring solution
Blue food coloring solution
Yellow food coloring solution
Distilled Water
Vernier LabQuest
Colorimeter
Cuvettes
Graduated Cylinder
Procedure:
Initially, colorimeter was connected to Vernier LabQuest and calibrated to 0 by pouring the water into the cuvette and placing it in the colorimeter. It is important to calibrate between any change in color or concentration to get the most accurate reading. The color for the group was the red food coloring solution. For the first part of the experiment, all three colors, red, blue, yellow, will be measured to find the percent transmittance by wavelength at 430nm, 470nm, 565nm, 635nm. Calibrate the machine to 0 between each color. Record the data and observe the similarities and differences between the patterns of all of the colors. For the second part of the experiment, with the given group color of red, measure the percent transmittance of the 10 dilutions of the red food coloring. Percent transmittance is equal to the intensity of the light leaving the solution divided by initial intensity times 100 to convert it into a percentage. The 10 dilution intervals to be used are 0, .1, .2, .3, .4, .5, .6, .7, .8, .9, 1. The dilutions are between the color dye and distilled water, so 0 has a concentration of 0% dye, 100% water, while .5 has a concentration of 50% dye and 50% water. Calibrate the machine to 0 between each dilution. For each dilution level measure out a ratio of 5 mL so that it can be poured into the cuvette and measured by the colorimeter. So for example, for a .8 dilution, it will contain 4 mL of the dye and 1 mL of the distilled water. After all of the data points have been obtained for each of the dilution intervals, clean up and put all of the materials back in their original location.
Data/Calculations:
Table 1: Percent Transmittance by Wavelength
| Dye Color | 430 nm (Blue/violet light) | 470 nm (Blue light) | 565 nm ( Yellow light) | 635 nm (Red light) |
| Red Dye | 32.08% | 37.48% | 81.04% | 112.93% |
| Yellow Dye | 30.23% | 50.36% | 100.46% | 117.01% |
| Blue Dye | 100.50% | 105.46% | 64.88% | 50.73% |
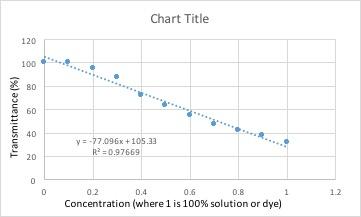
Table 2: Percent Transmittance of the 10 Dilutions of the Red Food Coloring
| Conc. | Blank | 0.1 | 0.2 | 0.3 | 0.4 | 0.5 | 0.6 | 0.7 | 0.8 | 0.9 | 1 |
| %T | 100.45% | 100.43% | 95.45% | 87.33% | 72.48% | 63.62% | 55.03% | 47.57% | 42.01% | 38.2% | 32.08% |

Example of spreadsheet formula
Example of diluted solution: Need a concentration of 0.5. Fill up a graduated cylinder with 2.5 mL water and another 2.5 mL dye. To give it a split ratio of the two.
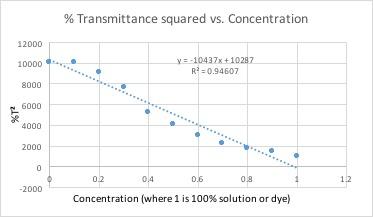
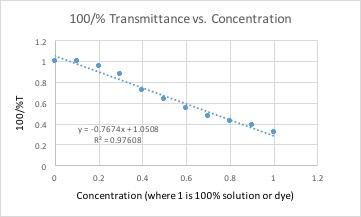
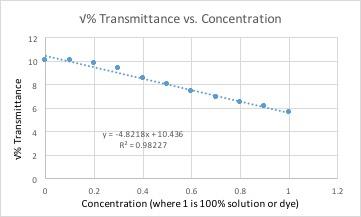
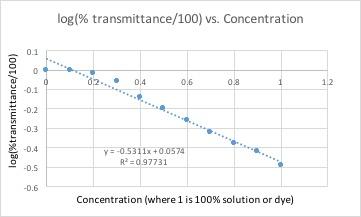
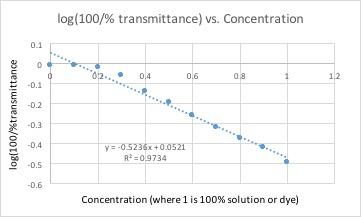
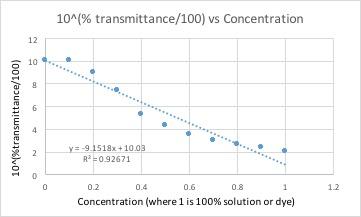
All of these graphs had a light with a wavelength of 430 nm (blue/violet light) shone through them. This wavelength yielded the lowest percent transmittance for our dye color, which was red. Percent transmittance is the percentage of light that passes through. Therefore, solutions with more dye will have a lower transmittance because the light will have a harder time passing through.
Results:
Discussion:
Conclusion:
Works Cited:
1. Bauer, Richard; Birk, James; Sawyer Doug CHM113/116 Lab Manual; Cengage Learning, Boston, MA, 2009
2.


