MATLAB QUESTION!!!1
Project description: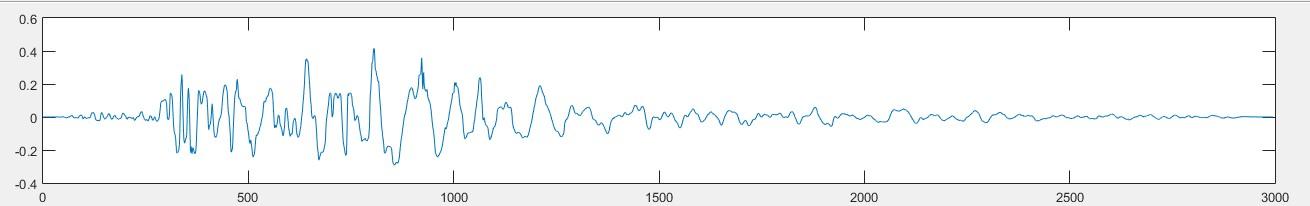
An earthquake data (GM01) is provided as shown. The y axis is its acceleration with unit g.
Use matlab if/while/for function (do not use cumtrapz or cumsum, etc). Provide a graph of its acceleration, velocity and displacement in a same figure. (Hints: the AREA of an acceleration graph is its velocity.)
Find this earthquake’s maximum acceleration(m/s2), velocity(m/s) and displacement(cm)
If the recorder is broken and it can only record the earthquake from 0.2g to -0.2g. Plot the new acceleration vs time graph.
This ground motion has 2995 data. Expand the number of acceleration data and time data to 5000. Plot the new acceleration vs time graph.
Requirement:
All problems need to provide your matlab script .(don’t forget to use %comment to explain it)
All plots need to have label, title, legend, etc.


