some who can do geology
Earthquake Hazards in the Eastern U.S.We often assume, mistakenly as it turns out, that because the eastern U.S. has no active plate boundaries that it has no earthquake risk. While earthquakes in plate interiors are much less frequent, there are some factors that make them even more dangerous than those in more seismically active areas. With this homework exercise we explore an eastern U.S. earthquake and consider some of the factors that can affect societal response to this under-appreciated hazard.
Before You Begin
Go to the Google Earth web site and download Google Earth Pro:
https://www.google.com/earth/download/gep/agree.html
Note: You must install Google Earth Pro to complete the exercise; regular Google Earth does not include the ability to draw circles.
Part I – Locating an Earthquake.Open the Google .kmz file attached to this Assignment description in Isidore. This should automatically open Google Earth and navigate you to a view of the eastern U.S. This file contains the locations of three seismic stations in the eastern half of the U.S. – SSPA (Standing Stone, Pennsylvania), WCI (Wyandotte Cave, Indiana), and DWPF (Disney World Preserve, Florida). Seismic records are included here from each of these three stations. Note that the S- and P-wave arrival times have been automatically picked using the electronic interpretation algorithms encoded into each of the seismographs and recorded on the right side of each seismogram. Also note that there are actually three seismograms stations at each station – BH1 and BH2 record the lateral motion in perpendicular directions whereas BHZ records the vertical motion. Also note how difficult it would be to pick out the p-wave arrivals by eye (BH! For SSPA is probably the easiest to visually pick out the different phase arrivals). 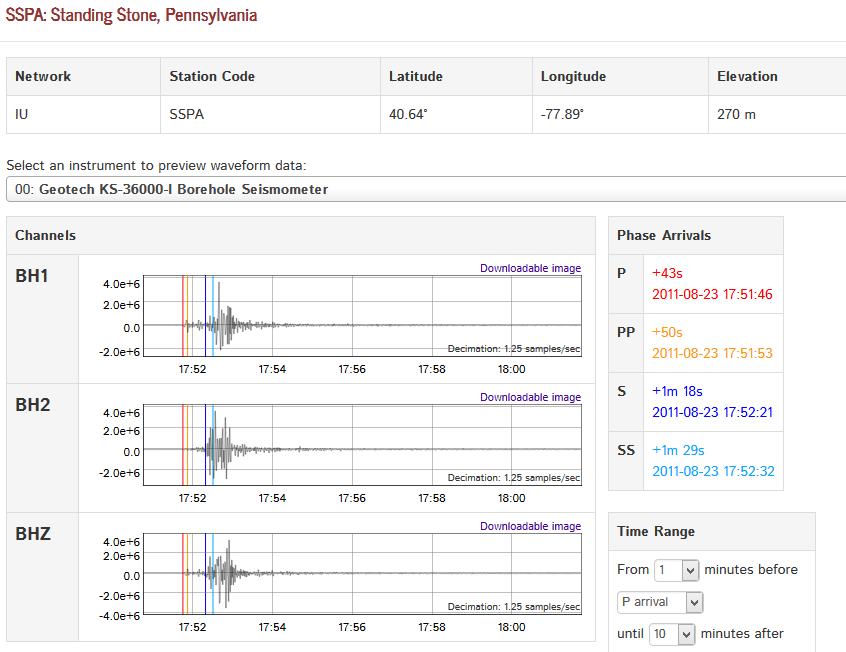
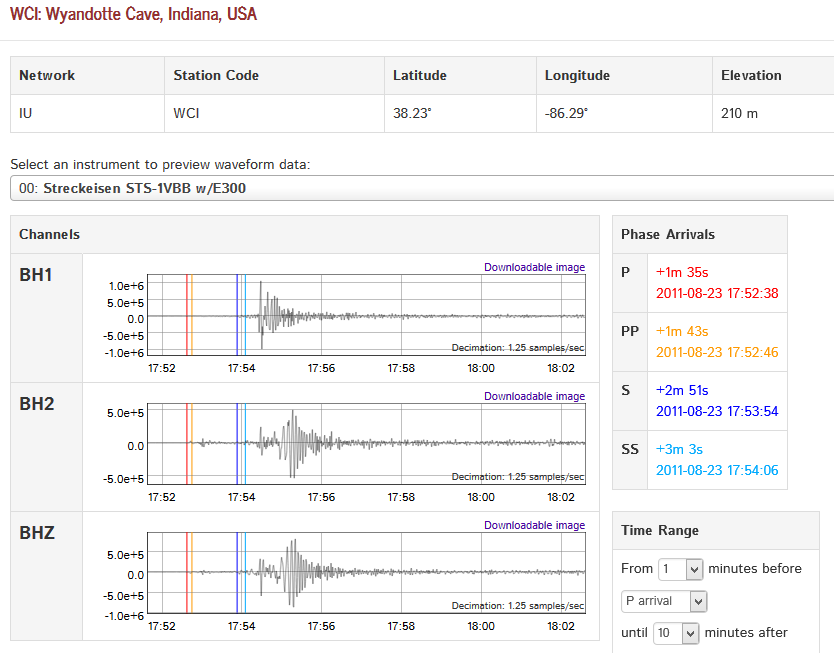
Study the vertical axis of the various seismograms and record the maximum amplitudes of the highest wave peaks at each of the seismic stations below (Don’t worry about the units – we are only interested in comparing them in a relative sense):
SSPA –
WCI –
DWPF –
Based on the wave heights, which of the three stations do you think was closest to the epicenter and why?
To locate the epicenter more precisely, we need to figure out how far each station was from the epicenter. To do this, we will use the S-P lag times from each station and the travel- time graph at the end of this hand-out. In the table below, record the P- and S-wave arrival times from the seismograms and use them to calculate the S-P lag times, the distances to the epicenter, and the predicted P- and S-wave travel times from the epicenter, and finally, to estimate the time of the earthquake by averaging the times estimated from each of the three seismic stations.
![some who can do geology 3]()
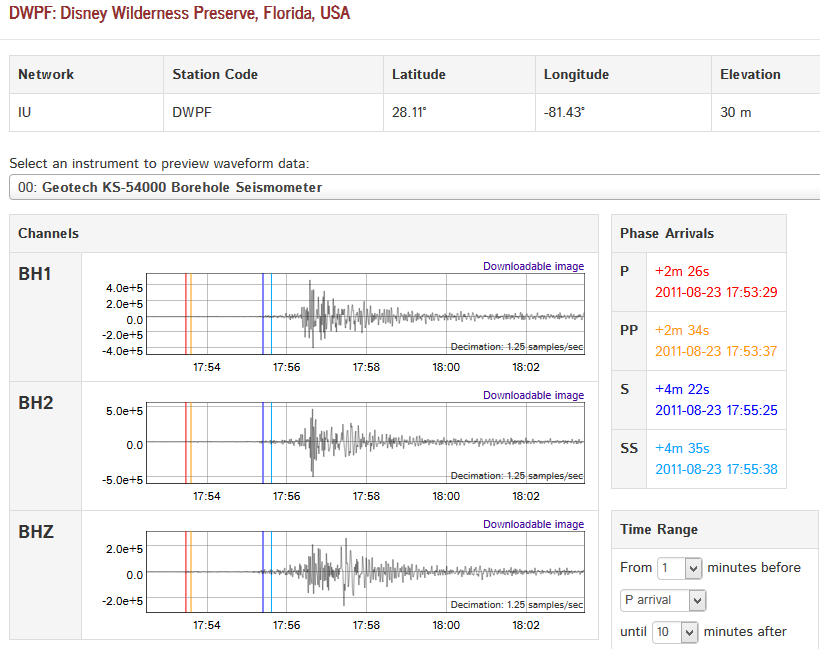
| Station | P-arrival | S-arrival | S-P lag | Epicentral Distance | P-travel time | S-travel time | Time of Quake | |
| SSPA | 17:51 46 | 17:52 21 | ||||||
| WCI | 17:52:38 | 17:53:54 | ||||||
| DWPF | ||||||||
| Est. time earthquake occurred (average time of quake) | ||||||||
Now, with the distances to the epicenters, we have the critical information we need to locate the epicenter. For each of the three seismic stations go into Google Earth Pro, click on the seismic station in question, and then select the “ruler tool,” and select the “Circle” tab (Note: If you do not see the “circle” tab, you are not using Google Earth Pro – you only have this functionality in Google Earth Pro). With the circle measure tool selected, click once on the seismic station in question to set it as the center of the circle and then begin “pulling away” from the seismic station without clicking to enlarge the circle; you will need to continuously “zoom out” at the same time to make the circle large enough. As you enlarge your circle, keep an eye on the Radius of the circle in the toolbox. Once the radium equals your epicentral distance for that seismic station, click again to set the circle and then click “Save” to save it. If you like, right-click the circle and open the “Properties” dialog (PC, of “Get Info” on Mac systems) which will give you an opportunity to give your circle a name, such as “WCI measure circle.” Repeat the same procedures for the other two seismic stations. Now, all three circles should intersect or at least come close to intersecting at one point – do they? Normally there will be a small “error triangle” near the intersection point. Click on the “add place mark” tool (the yellow thumb tack in the menu bar) to locate your best estimate for the earthquake epicenter in the middle of your error triangle.
Record the latitude and longitude of your estimated earthquake epicenter below.
Latitude: ______________ Longitude ____________
Now, go to the Google Earth Gallery on the sidebar and scroll down until you see “Earthquakes” and select the box to display earthquake epicenters on the map. Are there any earthquakes within or at least very close to your error triangle? How far “off” were you from the actual earthquake epicenter as fixed by the U.S. Geological Survey?

In the sidebar slide your location circles and your earthquake epicenter into the “EasternUSseismic” folder. You should turn this folder in along with this hand-out once you have completed it.
![some who can do geology 4]()
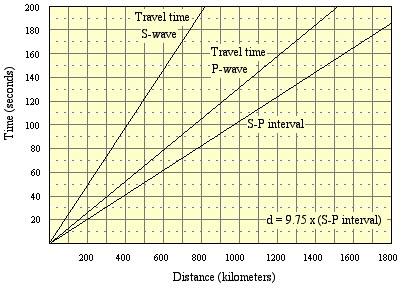
Figure 1. Seismic Wave Travel-time graph. Use to complete Question 2.
Now, point your browser to USGS “Earthquake Lists, Maps, and Statistics”: https://earthquake.usgs.gov/earthquakes/browse/
Once there, select “Significant Earthquakes” and search on the year 2011. Scroll down til you find the August 23 earthquake. Select this quake, which will take you to a variety of information. Read the summary information for the quake, and answer the following questions
Magnitude?
Depth?
Time of Origin? (And how does this compare with the time you estimated from your analysis of the three seismograms?)
Type of fault?
Does this area have any past history of earthquake activity? Briefly discuss.
An interesting and important contrasting character of earthquakes in the eastern U.S. as compared with the western U.S. is that earthquake waves travel very much more efficiently without weakening much in the stronger crust of the eastern U.S. This results in a much larger “felt-area” for the earthquake as reflected in “Did You Feel It?” (DYFI) reports. Briefly discuss and describe the contrast in the extent of the felt-area for this earthquake vs. a typical California earthquake of similar magnitude.
Open the Wikipedia page for the earthquake in a separate tab, and briefly summarize its main effects. https://en.wikipedia.org/wiki/2011_Virginia_earthquake
The U.S. Geological Survey employs a system called “Pager” that automatically models expected levels of groundshaking and estimates anticipated levels of damage due to an earthquake of a given magnitude anywhere in the U.S. Select this page to study the estimates provided for this quake by the Pager system. In the space below, copy and paste the histograms summarizing the relative probabilities of expected number of fatalities and property damage costs, and the map of population exposure at various intensity levels. Note that the Modified Mercalli Intensity Scale has been attached to the end of this hand-out for your reference.
Now, return to the main page for the Virginia earthquake, and then navigate to the interactive map. How closely did the predicted Intensity map by Pager match the actual intensity map for the earthquake. How and why would it be useful is it to planners and first responders to have this capacity for forecasting the likely intensity and distribution of earthquake damages based on different earthquake scenarios?
One of the most widely reported damages from this earthquake was the cracking of the Washington monument.
How far away is Washington from the epicenter of this earthquake, and what was the expected and recorded intensity in the Washington area? Would significant structural damage normally be expected in this intensity zone?
Can you suggest any aspects of the construction of the Washington Monument that could have made it more vulnerable to earthquake damage?
Note there is a geologic map of the area surrounding the monument. What soil type characterizes the monument area of Washington, D.C.? (Note, FEMA has a very brief tutorial on soil types and earthquake hazards, which you can view at https://training.fema.gov/emiweb/earthquake/neh0102320.htm ). Based on a review of these conditions, are there any aspects of the foundation or substrate conditions at the site of the Washington Monument that may have made it more vulnerable to earthquake damage?

| I. Not felt | Not felt except by very few under especially favorable conditions. |
| II. Weak | Felt only by a few people at rest, especially on upper floors of buildings. |
| III. Weak | Felt quite noticeably by people indoors, especially on upper floors of buildings. Many people do not recognize it as an earthquake. Standing motor cars may rock slightly. Vibrations similar to the passing of a truck. Duration estimated. |
| IV. Light | Felt indoors by many, outdoors by few during the day. At night, some awakened. Dishes, windows, doors disturbed; walls make cracking sound. Sensation like heavy truck striking building. Standing motor cars rocked noticeably. |
| V. Moderate | Felt by nearly everyone; many awakened. Some dishes, windows broken. Unstable objects overturned. Pendulum clocks may stop. |
| VI. Strong | Felt by all, many frightened. Some heavy furniture moved; a few instances of fallen plaster. Damage slight. |
| VII. Very strong | Damage negligible in buildings of good design and construction; slight to moderate in well-built ordinary structures; considerable damage in poorly built or badly designed structures; some chimneys broken. |
| VIII. Severe | Damage slight in specially designed structures; considerable damage in ordinary substantial buildings with partial collapse. Damage great in poorly built structures. Fall of chimneys, factory stacks, columns, monuments, walls. Heavy furniture overturned. |
| IX. Violent | Damage considerable in specially designed structures; well-designed frame structures thrown out of plumb. Damage great in substantial buildings, with partial collapse. Buildings shifted off foundations. |
| X. Extreme | Some well-built wooden structures destroyed; most masonry and frame structures destroyed with foundations. Rails bent. |
| XI. Extreme | Few, if any, (masonry) structures remain standing. Bridges destroyed. Broad fissures in ground. Underground pipe lines completely out of service. Earth slumps and land slips in soft ground. Rails bent greatly. |
| XII. Extreme | Damage total. Waves seen on ground surfaces. Lines of sight and level distorted. Objects thrown upward into the air. |


