stat assignment.
Task 7: How Far Does It Jump Now? Name:
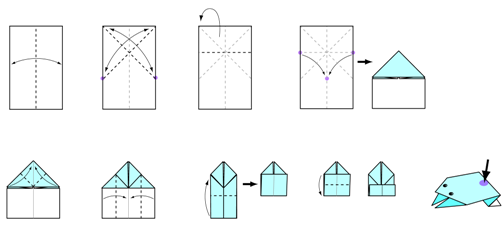
The origami frog we created for the previous task didn’t jump very far. Could we impose a treatment on the frog that would enable it to jump farther?
Choose from among the following treatments:
Make a frog from heavier paper
Add a weight (such as a paperclip) to the frog
Make frogs of a different size
Experimental procedure:
Choose a treatment.
Determine whether your experiment will involve paired or independent samples.
Each member of the class constructs an origami frog and imposes the treatment OR imposes the treatment on the previously created frogs.
Class members work in groups to measure the jumping distance of the treated frogs (and the untreated if necessary). (Once each).
The orthogonal jump distance will be measured from the starting line to the most distance point on the frog (values may be negative).
Students will record and work with data for the entire class.
For the analysis:
Summarize the data using appropriate numerical and graphical methods. Describe what you learn from these.
Construct and interpret a 95% confidence interval for the mean difference in jumping distances of the treated and untreated frogs.
Implement and interpret a hypothesis test to determine if the mean flying distance different for the treated and untreated frogs.
State and justify your conclusions.
Include relevant excerpts from your output in a brief report describing your analysis and conclusions.
The report must be typed and double-spaced; about 3-5 pages including graphics. Attach your code as an appendix (not part of the 3-5 pages).
Include the following (labeled) sections:
Problem Statement
Methods
Conclusions
Discussion
I. Problem Statement: In this section, the author will describe the question(s) being addressed in the analysis and any relevant background that is helpful to understanding the question. (1-2 paragraphs)
II. Methods: In this section, the author will indicate the methods used, describe the question addressed by each method, and interpret relevant computer output.
III. Conclusions: In this section, the author will describe overall conclusions and the justification for these conclusions from the work done. In particular, how would you answer the original question posed?
IV. Discussion: In this section, the author will discuss the limitations of his/her analysis did (e.g. did you have to make any particular assumptions? Was there missing information? ), describe additional questions that would be of interest to investigate with the data, and offer any final insights into the question under consideration.
Grading Rubric:
Basic assignment requirements completed +8
All required sections included and adequately covered, +2
All relevant computer output included and discussed, +1
Appropriate analysis and conclusions +2
Conclusions sufficiently and appropriately justified, +2
Organized, clear +1
Excellent analysis and write-up +1
Exceptional analysis and write-up +2
Taking the analysis and report from ‘good’ to ‘excellent’ or from ‘excellent’ to ‘exceptional’ does not necessarily mean adding more (graphics, words, etc.) – though this might be part of it, rather it means conducting a more thoughtful and careful analysis and preparing a more organized and informative report on your work.


