parapharsing
PROBLEM STATEMENT
The questions to be addressed are how far will the frog jump and if a treatment could be imposed on the frog to enable it jump further. Since the origami frog created for the previous task didn’t jump far. A treatment is to be chosen among the three treatments, an experiment carried and analysis made to find the jumping distance.
Also, difference between the mean jumping distance of control frogs and half size frogs which are the treated frogs is to be determined.
METHODS
1. Random sampling
A treatment is selected at random to determine the difference in mean jumping distance of control frogs and the treated frogs.
2. Scatter plot
A scatter plot was used to determine the relationship among variables and check whether there exist unusual variables.
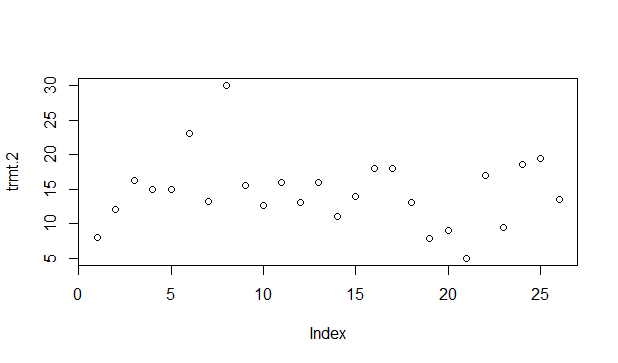
This is scatter plot of the treatment variables. It shows that the variables are uncorrelated meaning they are independent.
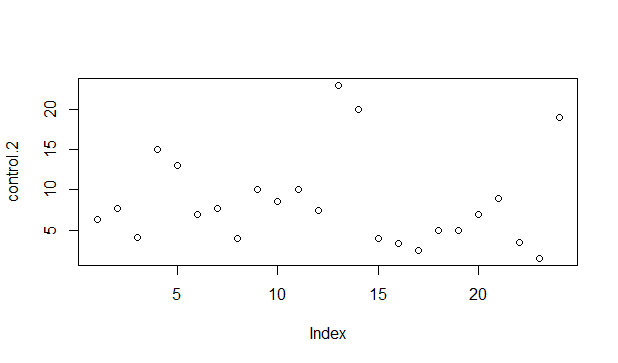
This is a scatter plot for the control variables. It also shows that the variables are independent and uncorrelated.
3. T-TEST
A t-test was run to test for the difference in mean jumping distance of control frogs and the treated frogs. A two sample t-test was used to the mean difference in the control data and treatment data.
A 95% confidence interval for the difference in jumping distances of untreated and treated frogs was also determined and the values are; The lower bound= -9.216437 and the upper bound=-3.017537.
A formulated Hypothesis is;
Null hypothesis;H0=The mean difference equals to zero
Alternative hypothesis; H1= The mean difference not equal to zero
The summarized R output is given below;
Welch Two Sample t-test
data: control.2 and trmt.2
t = -3.9719, df = 46.293, p-value = 0.0002472
alternative hypothesis: true difference in means is not equal to 0
95 percent confidence interval:
-9.216437 -3.017537
sample estimates:
mean of x mean of y
8.479167 14.596154
CONCLUSION
An alternative method of testing for difference in jumping distances was determined by first using untreated frogs to check the distanced jumped. Since the frog did not jump far another method was used to check for the difference. Treated frogs were experimented and there data recorded then an analysis was to done to test for the difference in mean jumping distance between treated and untreated frogs.
Using t-test we fail to reject the null hypothesis since the calculated t value is less than the tabulated t value and conclude that the difference in mean jumping distance equals to zero thus there is no statistical significance between the jumping mean of the treated frogs and untreated frogs.
DISCUSSION
Although the t-Test is commonly used, it has limitations;
1. Can only test differences between 2 groups • High school class? College year?
2. Can examine ONLY the effects of 1 IV on 1 DV
3. Limited to single group or repeated measures designs
To run the t-test an assumption of normality was to be made such that we assumed the data is normally distributed.
Scatter plots are invaluable and work with almost any continuous data scale. Unfortunately they aren’t always great for presentations.
The missing information is which treatment was used to determine the data of treated frogs.
Additional questions to investigated, is there any effects of the treatment on the frogs and which is the best treatment to be used to make the frog jump farther.
Other interesting aspects to investigate is the regression to test the nature of the variables and to the analysis of variance to check difference in means among groups.
In conclusion there was no difference in jumping means between the treated and untreated frogs. Therefore a better treatment should be determine to increase the jump distance of the frogs.
APPENDIX
The codes used to run the tests in R studio
control.2 <-c(6.3,7.7,4.1,15,13,7,7.7,4,10,8.5,10,7.5,23,20,4,3.3,2.5,5,5,7,8.9,3.5,1.5,19)
trmt.2 <- c(8,12,16.3,15,15,23,13.2,30,15.5,12.7,16,13,16,11,14,18,18,13,7.8,9,5,17,9.5,18.5,19.5,13.5)
plot(control.2)
plot(trmt.2)
t.test(control.2, trmt.2, conf.level = 0.95)


