physic lab report
Oscilloscopes
Purpose:
This lab will introduce the Oscilloscope, a very useful tool for visualizing the workings of various electronic circuits. In class we will familiarize ourselves with the controls and settings of an oscilloscope. We will learn how to measure the voltages of D.C. and A.C. power sources, as well as observe the wave patterns of various signals.
Introduction:
In its most common usage, an oscilloscope provides an electronic “graph” of the circuit operations with time on the horizontal axis, and voltage on the vertical axis. The scale of both axes can be adjusted as required for best display.
Oscilloscopes (hereafter referred to as “o’scopes”) are like many scientific instruments. They are simple conceptually but complicated in their engineering.
| The heart of a scope is the CRT – Cathode Ray Tube – which is essentially the same as the picture tube in an older television or computer monitor. |
|
|
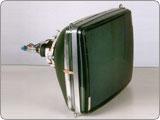
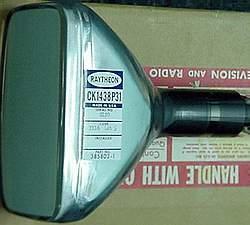
The tube is a large evacuated glass tube with electronics in the small end to form a beam of high speed electrons which travel forward and hit the inside surface of the large end (screen) which is coated with a phosphorescent material. This causes a bright spot where the beam dumps energy.
|
Electrical Connections Metal Plates With Holes Acceleration Region
Bright spot  
Beam     
Screen Parallel Plates with Electric Fields Between Beam Manipulation Region Beam Forming Region “Boiled” Off Electrons Hot Coil |


Let’s now explain more about how a CRT works.
A large current is passed through the filament (causing it to glow – to heat up).This gives the electrons in the filament enough kinetic energy for them to leave the filament (to boil off). The electrons are then attracted to a positively charged plate with a hole in it. The electrons pass through the hole to form the beam. The beam is given a timed horizontal deflection which causes it to sweep across the screen of the oscilloscope at a measured rate.
Finally, an input is fed to vertical deflection plates to display a graphic representation of the vertical input vs. time on the horizontal. The horizontal deflection (sweep rate) can be adjusted slow enough that you can watch the beam move across the screen, or fast enough to display a rapidly changing input.
Additional information on this topic may be found in your text.
Procedure:
Measure DC voltages: Use the o’scope to measure DC voltages and compare them to the multi-meter readings. Ensure that the calibration knob (Var) is fully CW. First, adjust the DC Power source to 5V. Set the coupling switch of the scope to “Gnd”. The coupling switch has positions for AC, DC, and GND, and is just to the left of the V/div knob. Adjust the vertical display so the horizontal line is on one of the divisions. Switch the coupling to “DC”. Connect the scope and adjust the volts/div to read the voltage (Vertical position shift). Switch the coupling to “AC”. What happens? (when switch the coupling to AC, it be come zero) Set the power source to several other voltages and practice measuring voltages with the o’scope. Check your measurements with the multi-meter. How close are your o’scope measurements to what the Multi-meter reads? ( it is exist number in multi-meter reads)
| 7 | 7 |
| 5 | 5 |
| 4 | 4 |
| 8 | 8 |
2. Measure AC voltages: Use the multi-meter to measure the “12VAC” output from the power source. Record the voltage. Connect your scope to the “12VAC” output. You may want to use a “X10” probe to display the sine wave. Alternatively, you could set the coupling to “Gnd”, adjust the trace to place it at the lowest line, then switch the coupling to “AC” and measure the positive peak voltage. Switch the coupling back to “Gnd” and move the trace to the top to measure the negative peak voltage in a similar fashion. Adjust your horizontal and vertical scale as needed to view the sine wave. How does it differ from your expectations? Theoretically, there is a .707 ratio of RMS (Root Mean Square) voltage to peak voltage for a sine wave. Does this match the ratio you saw? If not, why not? Its match
| 25.5 | 18.5 |
3. Observe the wave forms of a signal generator: Connect the signal generator to the o’scope. Adjust the controls for a clear display of the signal generator output. Change the signal generator to the different waveform output options. Does the display match the picture on the signal generator? Switch the signal generator to a sine wave pattern. Measure the period (time) of the sine wave using the scale on the screen of the o’scope. Make sure the o’scope is calibrated (Sweep Var knob fully CW). Using the relationship between time (period) and frequency, calculate the frequency of the sine wave you are displaying. Check this against the multi-meter’s reading of the frequency. Do this for several representative frequencies over the range of the signal generator.
| 30.Hz | 30.3ms | 33Hz |
| 59Hz | 17.5ms | 58.8Hz |
| 120Hz | 8.5ms | 117.6Hz |
30.3ms= .0303s
(.0303s)^-1=33Hz
4. Observe waveforms of rectifier circuits: “Rectifying” AC voltage is the first step in converting it to DC, which is what virtually all electronic devices require for operation. In electronic circuits, “rectifying” eliminates the negative (or positive) half cycle of AC voltage, resulting in “pulsating DC”. There are two types of rectifier circuits set up on circuit boards. Connect the 12VAC output of your power source to the input of the circuit boards (one circuit at a time). Use DC coupling on your o’scope input. Set your o’scope to display the sine wave at the output of the power source (input of the circuit board). Without changing your o’scope settings, move the o’scope leads to connect the o’scope to the output of the circuit. How does the wave pattern differ from the AC input? How do the output waveforms differ between the two rectifier circuits? (It is important to note the time and voltage scale setting and the corresponding measurements to accurately note the differences.) Sketch the input and output waveforms to scale.
5. Observing lissajous patterns: Lissajous patterns have a variety of uses in electronics and science fiction movies. This requires a different set up of the o’scope from what we have been using up until now. Instead of a time-calibrated horizontal display, and a voltage calibrated vertical display, both the horizontal and vertical sweeps are driven by the outputs of signal generators. Select the “X-Y” option near the upper right of you o’scope panel and on the “vertical mode” switch between the two volts/div knobs. Connect one signal generator to channel one, and another to channel two of your o’scope. Adjust the signal generators to produce various (stable) patterns of loops on your o’scope. Draw the patterns you obtain. What is the relationship (ratio) between the frequencies of your horizontal and vertical inputs for each pattern you create? (reduce ratios to lowest common denominators, single digits, rounding as needed: 1:3, 4:1, etc)
| Infente single | circular single | 3infente single | 4infente single |
| 44Hz | 20Hz | 62Hz | 83Hz |
| 86 | 92 | 90 | 90 |
Analysis:
Discuss the results of your work with an o’scope. Be sure to address the questions raised in each task outlined in the “procedure” section of the handout.
Lab Evaluation:
Please provide feedback on the following areas, comparing this lab to your previous labs: How much fun you had completing this lab; How well the lab prep period explained this lab; The amount of work required compared to the time allotted; Your understanding of this lab; The difficulty of this lab; How well this lab tied in with the lecture. Please assign each of the listed categories with a value from 1-5, with 5 being the best, 1 the worst. Comments supporting or elaborating on your assessment can also be very helpful in improving the future labs.
Date Last Modified March 13, 2015 Page Number 5


