4 graphs and and writing the Top 5 lessons learned about HR that transfer to the the real world
| |||||||||||||||||||||||||||||||||||||||||||||||||||||||||||||||||||||||||||||||||||||||||||||||||||||||||||||||||||||||||||||||||
| Key Performance Indicators | Baseline | Critical performance goals Q8 | Stretch performance golas Q8 |
| Absenteeism | 360 day | 200 | 120 |
| Productivity | 40 index units | 63 | 76 |
| Turnover | 18% | 12% | 6% |
| Well-Being | .55 index units | .70 | .95 |
Example:
Turnover
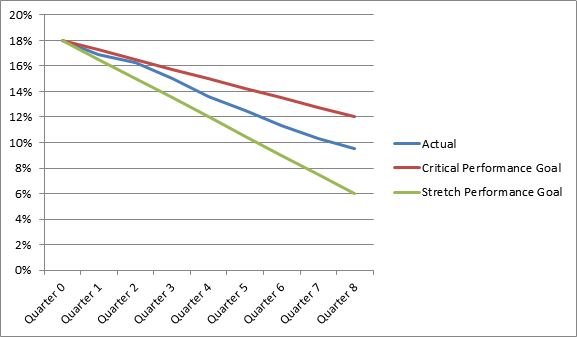
Final Turnover: 9.5%
Class Average: 9.5%


