SPSS
STAT 510 Final Exam
A study was conducted on teaching methods applied in a certain private school in the US. A sample of 1000 students is considered and data was collected and is available in the dataset Teaching_method posted on blackboard under Content -> Final Exam. Answer the following questions:
List all the variables in the study and identify the type of each variable.
The variables are teaching method (nominal type), gender (nominal type), pretest (interval type) and post-test (interval type).
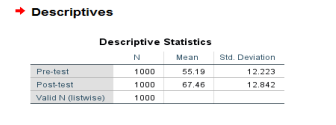
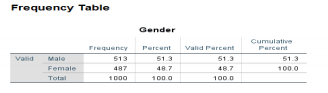
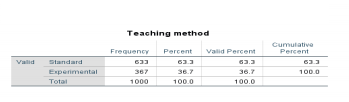
Use SPSS to summarize the data by reporting the descriptive statistics for each of the following variables: Teaching-method, gender, pre-test and post-test
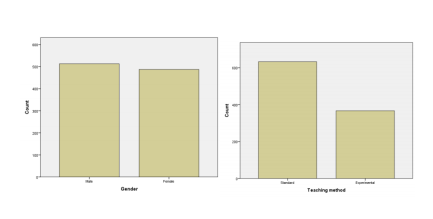
The frequency distribution for teaching method and gender is given below.

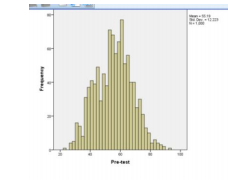
Use SPSS to plot a histogram for each of the Scale variables and a bar plot for each of the Nominal variables.
At significance level alpha = 0.05, is there a significance difference in the mean Pre-test Scores between the two teaching methods Standard and Experimental? To answer this question, follow the steps below and answer each of the following questions:
a) The dependent variable is Pre-test
b) The independent variable is teaching methods
c) The null hypothesis H0 is that there is no difference in mean value of pre-test scores between the two teaching methods Standard and Experimental. The alternative hypothesis Ha is there is difference in mean value of pre-test scores between the two teaching methods Standard and Experimental.
d) Are the two samples dependent or independent?
Independent
e) Conduct the appropriate test to answer the following research question:
The results of the test are given below.
| Independent Samples Test | ||||||||||
| Levene's Test for Equality of Variances | t-test for Equality of Means | |||||||||
| F | Sig. | t | df | Sig. (2-tailed) | Mean Difference | Std. Error Difference | 95% Confidence Interval of the Difference | |||
| Lower | Upper | |||||||||
| Pre-test | Equal variances assumed | 2.541 | .111 | -6.119 | 998 | .000 | -4.820 | .788 | -6.366 | -3.275 |
| Equal variances not assumed | -6.147 | 774.988 | .000 | -4.820 | .784 | -6.360 | -3.281 | |||
At significance level alpha = 0.05, is there a significance difference in the mean Pre-test Scores between the two teaching methods Standard and Experimental?
Report t, df, p-value, mean difference and the 95% CI on the mean difference.
T (998) = -6.119, p-value = 0.000. CI is (-6.366, -3.275).
State your decision based on the p-value.
Reject the null hypothesis as the p-value is less than the significance level.
State your conclusion and make sure to comment on the mean difference.
The data provides sufficient evidence to conclude that there is difference in mean value of pre-test scores between the two teaching methods Standard and Experimental. The mean difference is -4.820 which suggest that pre-test scores is significantly higher for experimental method by 4.820 units than the standard method.
At significance level alpha = 0.05, is there a significance difference between mean Pre- test scores and mean Post-test scores. To answer this question, answer each of the following questions:
a) b) c)
d) e)
i. ii. iii.
The dependent variable is difference between pre- and post-test scores. The independent variable is related group of pre and post.
The null hypothesis H0 is that the mean difference is significantly equal to 0.
The alternative hypothesis Ha is that the mean difference is different from to 0.
Are the two samples dependent or independent?
The sample are dependent.
Conduct the appropriate test to answer the research question: At significance level alpha = 0.05, is there a significance difference between mean Pre-test and mean Post-test Scores
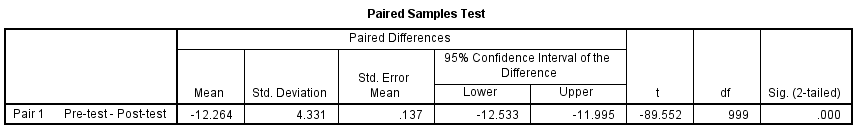
Report t, df, p-value, mean difference and the 95% CI on the mean difference. State your decision based on the p-value. State your conclusion and make sure to comment on the mean difference.
The data provides sufficient evidence to conclude that the mean difference is different (t (999) = -89.552, p-value = 0.000) from to 0 for pre-test and post-test scores. The mean difference is -12.264 which suggests that the post test scores is significantly higher than post test scores by 12.264 units.
Page | 6


