respond
1 The Enduring Argument for Local Economic Development Planning
Cities, towns, counties, and all local entities in a global economy have the challenge and opportunity of crafting their own economic destinies. This is true for the poorest as well as the wealthiest localities. In reality, the forces of nature, demography, technology, and industry are such that no local economy can ever count on an achieved position of stability and security. This has always been true, but the contemporary context for local economic development planning is severely challenged by the two trends of rising inequality and global warming. It is also challenged by the increasingly transitory nature of any given local economy in the face of overwhelming forces of globalization. These forces flatten the world in such a way that few, if any, local economies are exempt from globalizing forces that can bring growth and development or decline and increased poverty (Friedman, 2005).
Local Economic Development Planning in the Face of Globalization
The globalizing economy—until the recession that began at the end of 2007—was truly a case of the whole being greater than the sum of its parts. The integration of national and local economies into one global economy accelerated growth in the gross world product. The International Monetary Fund (IMF; 2007, 2015) data indicate the world economy grew at a rate of 3.2% from 1988 to 1997, 4.4% from 1998 through 2007, and again at only 3.2% from 2008 to 2015. This was accompanied by continued growth in the share of world income that went to individuals (gross domestic product per capita), with persons in the newly industrializing and emerging market countries gaining at a higher rate.
In an increasingly integrated global economy, the previously stated growth trends illustrate that economic downturn in one major nation can spread across the globe, as happened from the second half of 2008. The global economy experienced the worst recession since the Great Depression of the 1930s. And while the recession was officially declared to have ended in the United States in mid 2009, the United States and the rest of the global economy are still not fully recovered. We provide a brief explanation of the Great Recession next.
The U.S. financial crisis had at its core the subprime housing market. Home loans were made to unqualified buyers in violation of prudent lending practices and regulations. The banks making the loans did not hold on to them. Instead, they sold them to secondary mortgage consolidators, who then packaged them into derivative financial instruments. These, in turn, were sold to investors across the globe, who suffered severe losses when the loans went into default. There followed a major credit crisis as many banks and investing houses failed.
Some 70% of the U.S. economy is consumer based. Without access to credit, because of bank failures and decreased lender ability, as well as willingness to provide credit even to financially sound businesses and individuals, consumer spending severely declined. Consequently, all the businesses that sold to them suffered. At first, the businesses selling big-ticket items such as autos were especially hard hit. But as the effects of the Great Recession lingered, many small businesses were unable to hold on. The small business failure rate increased 40% between 2007 and 2010, with retailers and manufacturers experiencing the highest rates of failure (Dun and Bradstreet, 2011). Normally, half of all small businesses fail within their first five years of operation, while two thirds fail by the end of the tenth year.
The U.S. auto industry is one of the most globalized in terms of its production systems, sourcing parts from around the globe. Further, a large proportion of the goods sold in stores within the United States are imported. Thus, countries around the globe experienced the backlash of the U.S. economic crisis with associated declines in foreign trade, number of firms, and employment.
What does increased global integration mean for the local economies that we focus on in this book? We answer this question within the context of three phases of globalization that Friedman (2005) described more than a decade ago. Long before the Great Recession, the United States’ globalizing and sending of goods abroad, or what Friedman called Globalization 1.0, brought significant prosperity to many local economies making manufactured goods, growing crops, and producing services and entertainment. As U.S. companies globalized in the 2.0 phase, accessing overseas markets and employing labor in other nations, U.S. local economies experienced plant closings on an accelerating scale. Local economies overly dependent on the industry sectors that found it most profitable to move their operations overseas experienced the greatest devastation. Many of the companies in these industry sectors simply were unable to compete with cheaper imports and thus moved overseas to take advantage of lower labor and other production costs. At the same time, companies from other nations located in local economies across the United States to gain access to our consumer market—and in the case of certain industry sectors, to less expensive labor and other costs of production. On balance, however, there was legitimate concern that the process of globalization could leave behind many local economies, and demographic groups within those economies, if they continued to pursue “business as usual.”
More recently, Globalization 3.0 shifted the drivers of globalization away from U.S. and European companies to individuals and non-Western nations. Further, even before the Great Recession, Globalization 3.0 created major new challenges for local economic development planning and practice in the United States. The solutions, as Friedman (2005) astutely observed, called for an orientation away from traditional business development and recruitment toward ensuring all participants in a local economy have adequate preparation to make maximum contributions. Recovering from the Great Recession and creating a new path for prosperity requires a shift from “business as usual.” It also requires an economy focused on reinventing itself through new technologies, innovations, and renewed commitments to ethical leadership. The challenges to local economic development are the greatest they have been since the establishment of the formal field. More than ever, local economic development planners and policymakers will need to have a sophisticated and comprehensive set of tools and strategies to remake their economies.
Prior to the Great Recession, new immigrants’ increasing labor force contributions and the problem of longtime residents with weak attachment to the labor market was of growing importance because of the aging population of the United States and the rest of the “rich world.” Most of Europe, as well as Japan, will experience sharp drops in population over the next three to four decades due to declining birth rates. The resulting aging of the population signals increased expenditures for health care and other government-provided services and places real strain on the future prosperity of these important global European partners of the United States. It is possible, however, that an aging labor force will now no longer be able to retire at the normal age due to the impact that the stock and housing market declines have had on retirement investment portfolios.
Historically, the United States has been in an enviable demographic position compared with its advanced nation allies. As a result, international capital flowed to the United States at a record pace. The United States also has had one of the most liberal and desirable immigration programs in the world. Thus, we should have an adequate number of workers to meet demand when the national economy is not in recession. However, the local economic development challenge is to ensure that this labor force is fully prepared to meet the demands of employers facing heightened global competition. One of the most encouraging economic development trends in the aftermath of the Great Recession has been that of inshoring, or bringing back production to the United States. However, many employers (especially in manufacturing) are complaining that they cannot find the skilled workers they need.
It will be critical for the United States to retain its high rate of economic productivity. In most industries, the combination of American workers and technology has created higher productivity than anywhere else in the world. However, the average U.S. worker has not benefited from productivity increases, as once was the case (see Figure 1.1). In fact, one of the most important explanations for rising inequality and threats to the American (read middle-class) standard of living is that earnings from work have grown much more unequal since the early 1970s (Bivens and Mishel, 2015; Blinder, 2007). In 2007, Blinder cited evidence from IRS data that the average taxpayer in the top one tenth of 1% of all wage and salary earners had earnings amounting to that of 44 average taxpayers in the bottom half in the year 1979, but by 2001, this earnings disparity had increased almost fourfold, equating to that of 160 earners. The gap between the average American worker and the executive class is increasingly polarizing the nation. Bivens and Mishel (2015) provided evidence that the decline in national income going to workers in the form of wages and benefits and its increase to owners of capital does not stem from workers being less productive. Instead, they fault key policy shifts such as abandoning a commitment to full employment, failure to increase the minimum wage to keep up with inflation, and lack of adjustment measures to prevent workers from being damaged by economic globalization.
Figure 1.1 Growth of Productivity, Real Average Compensation, and Real Median Income, 1973–2014
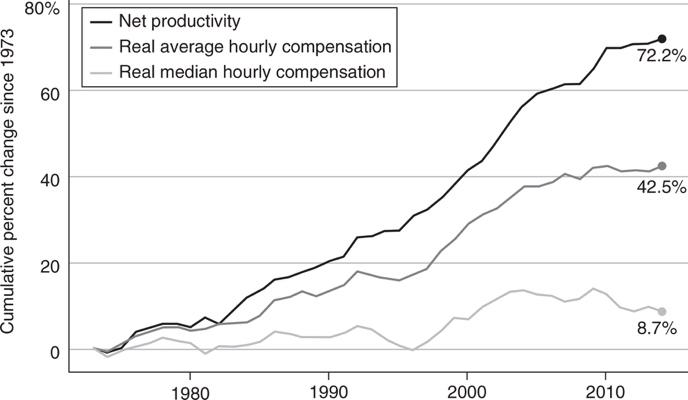
Source: Bivens and Mishel (2015).
Note: Data are for all workers. Net productivity is the growth of output of goods and services minus depreciation, per hour worked.
The Influence of Outsourcing and Insourcing
Workers and communities across the United States have been losing control over their destinies as the nation has increasingly become tied to global rather than national and local forces. Globalization is altering the locus of firms and work for all nations, rich and poor. The growing dominance of multinational firms within and outside of the United States is one of the most important trends accompanying globalization. There were approximately 40,000 multinational companies in the United States prior to the Great Recession, up from 7,000 in 1975 (Atkinson and Correa, 2007). Sassen (2006) suggested that the multinational firm has evolved to supersede much of national authority, elevating the significance of global cities and the connections between them in the globalization process.
The negative impacts on manufacturing employment from globalization have been felt for more than two decades. More recently, significant concern has been voiced over the offshoring of service jobs. A review of the evidence, however, suggests fewer than 1 million service jobs had been lost to offshoring prior to the Great Recession, which is less than one month’s normal turnover in the labor force (Blinder, 2007).
However, this may be just the tip of the iceberg, according to Blinder (2007), who suggested “the key labor-market divide in the Information Age will not be between high-skilled and low-skilled workers, as it has been in the recent past, but rather between services that can be delivered electronically with little loss of quality and those that cannot be” (p. 3). This can just as easily impact high-skill jobs such as software engineers and financial analysts as it does low-skill jobs such as assembly workers. As information technology (IT) continues its global diffusion, Blinder (2007) estimated that 22% to 29% of American jobs today could be offshored, though he expects this will actually occur to only a fraction of them. Nevertheless, job displacement will be a growing problem across a wide range of the labor market, and local economic development planning will be greatly needed:
We must take steps to ensure that our labor force and our businesses supply and demand the types of skills and jobs that are going to remain in America rather than move offshore. Among other things, that may require substantial changes in our educational system—all the way from kindergarten through college. And it will certainly entail a variety of steps to ensure that the U.S. remains the home of innovation and invention, for we will never compete on the basis of cheap labor. Nor do we want to. (Blinder, 2007, p. 4)
It is important to appreciate that globalization also brought employment to the United States. Many law, advertising, and other firms in the United States have provided value-added services and products to the developed and developing world alike. Further, the United States gained new jobs as foreign corporations invested here. It has been estimated that 21.1 million jobs in the United States come from foreign direct investment (FDI), with the largest number occurring in manufacturing (12.2 million). FDI also contributes 2.3 million jobs to the wholesale and retail sector; .5 million to the finance, insurance, and real estate sector; 1 million to the information sector; and 800,000 jobs to professional, scientific and technical services (Price Waterhouse Cooper, 2012).
Networks
The competitive advantage of firms in the New Economy has been greater specialization. However, this results in more interdependency with other firms, organizations, and suppliers. Business is no longer conducted by companies working alone. When leading-edge firms need specialized skills, they outsource to another organization in a related field or even in the same field. Many companies hire partner companies and form virtual corporations that combine for one product and then recombine with entirely different sets of collaborators for another product.
The concept of “blue ocean,” coined by Kim and Mauborgne (2004), is based on the notion that innovation comes from reinvention as well as new invention. They cite Cirque du Soleil as a prime illustration of reinventing within the template of an existing industrial category to generate a new product for new buyers. Some people and places seem to generate more of this sort of intellectual ware for reasons that Florida (2002), along with Kim and Mauborgne, cited as conducive to collaborative activities or launchpads for new ideas. Bradshaw and Blakely (1999) provided a spatial dimension to this argument in their work on third-wave economic development approaches.
Thus, it is no longer feasible for a firm located in one place to be unconcerned with the network of institutions and suppliers that can provide its materials and talent. Firms with well-developed networks are flexible as well as able to identify and select strong suppliers and penetrate new markets. The implication for workforce development is clear. In a networked economy, the skills of suppliers are as important as the skills within the firms.
The enduring challenge for local economic development planning is that the loss and gain of firms and jobs is never a one-for-one match, for either the community or the worker. When an auto job is lost in Detroit, its replacement in the American economy is more likely to be in financial services and located elsewhere. Even when another auto job from a foreign-owned firm appears in the U.S. economy, it does not do so in Detroit. Instead, it is located in the new Auto Alley running through the southeastern states. A classic explanation for this is found in Schumpeter’s (1947) notion of “creative destruction”—that is, capitalism and market economies only survive and grow through a process that destroys old ways and creates new ways of doing business. Cities, regions, and nations are affected by this process because they are the hosts to economic activities that experience birth and decline. Some of the new and key characteristics associated with evolving capitalism’s manifestation in the economy are discussed next.
The Geography of the New Economy
What came to be called the New Economy has been with us since 1990. Atkinson and Correa (2007) described the transformation to the New Economy as “equivalent in scope and depth to the emergence of the factory economy in the 1890s and the mass production, corporate economy in the 1940s and 1950s” (p. 3). They identified five major areas by which the transformation can be defined and measured: knowledge dependent, global, entrepreneurial, rooted in IT, and innovation (see Economic Developments 1.1 for a more detailed description). Using 26 indicators to capture transformation in the five areas, Atkinson and Correa (2007) examined recent economic activity in the United States and concluded that transformation to the New Economy has been uneven: It is most strongly in evidence within the Northeast, mid-Atlantic, Mountain West, and Pacific regions. The lagging regions are the Midwest, Great Plains, and South. When viewing the transformation through a metropolitan lens, Atkinson and Gottlieb (2001) observed a shift from the largest metro areas to midsized metro areas (between 250,000 and 1 million people). Within metro areas, the shift to the New Economy is associated with decentralization of activity away from the central city. Unfortunately for rural counties not adjacent to metro areas, Atkinson and Correa (2007) observed that they have been left out of the New Economy and have lost job share.
Jobs have been far more mobile than people. Over the past three decades, the Northeast and Midwest “Snow/Rust Belts” have shed manufacturing and related jobs. In the 1990s, these areas regained some of this type of employment but added a significant segment to the service employment base, particularly in new technology areas and in transportation and goods movement sectors. Old factories have been restored as logistic centers, moving freight by air and rail. Expansions in international trade have created new jobs for heartland workers importing and exporting goods to Latin America and Canada. The South and West have added new technology and trade jobs, as well as construction and food production employment. Although the North lost manufacturing jobs during the 1980s and 1990s, the Southeast added some manufacturing jobs in the auto sector as European automakers came to the South seeking cheap skilled labor during the same period.
Atkinson and Gottlieb (2001) argued that the most appropriate way to view the New Economy is through the lens of metropolitan areas, observing that America is “neither an urban nor a rural nation, but rather a metropolitan nation where the majority of the population lives and works in large metropolitan areas that include both historic central cities and dispersed suburban development” (p. 3). Contrary to common perception, the movement of jobs has not been confined to North–South or East–West shifts. Some northern metropolitan regions that lost population and employment during the 1980s and 1990s are now rebounding with new technologies and reinventing themselves as part of the New Economy by acting as springboards of industries like publishing and printing as well as other communications firms. For example, many academic presses are now in New England in old picturesque mill towns that can compete with New York City because they have digital printing capacities and can be reached on the Internet.
Economic Developments 1.1: The New Economy
So what exactly is the New Economy? The term refers to a set of qualitative and quantitative changes that in the last 15 years have transformed the structure, functioning and rules of the economy …. The New Economy is a global, entrepreneurial and knowledge-based economy in which the keys to success lie in the extent to which knowledge, technology, and innovation are embedded in products and services.
Today’s economy is knowledge dependent. Of course, managers and “knowledge workers” have always been part of the economy, but by the 1990s, they had become the largest occupational category. Managerial and professional jobs increased as a share of total employment from 22 percent in 1979 to 28.4 percent in 1995 and to 34.8 percent in 2003. In contrast, about one in seven workers is employed as a production worker in manufacturing, and even there, knowledge and continual skills enhancement is becoming more important.
Today’s economy is global. While it is true that some firms have long had global links, today’s globalization is pervasive, as more nations join the global marketplace, as more goods and services are traded, and as more of the production process is interconnected in a global supply web. Since 1980, global trade has grown 2.5 times faster than global gross domestic product (GDP). World exports are now at $12.5 trillion, nearly 20 percent of world GDP.
Today’s economy is entrepreneurial. While it is true that entrepreneurial growth, market dynamism, economic “churning” and competition have been features of the American economy since the colonial days, the center of gravity seemed to shift to entrepreneurial activity after the 1990s. At the same time, the underlying operation of the economy accelerated to a new speed and became more customized and innovative. For example, in the 60 years after 1917, it took an average of 30 years to replace half of the 100 largest public companies. Between 1977 and 1998, it took an average of 12 years. Moreover, from 1980 to 2001, all of the net U.S. job growth was from firms less than five years old, while older firms actually lost jobs.
Today’s economy is rooted in information technology. While it is also true that information technology has played a role in the economy since the invention of the telegraph, something happened in the 1990s when semiconductors, computers, software, and telecommunications became cheap enough, fast enough, and networked enough to become so ubiquitous as to power a surge in productivity growth. Indeed, information technology is now the key technology driving the economy, not just in the IT industry itself—which continues to see high-wage job growth—but also in the use of IT in virtually all sectors to boost productivity, quality and innovation.
Today’s economy is driven by innovation—the development and adoption of new products, processes, and business models. Nations, states, regions, firms, and even individuals compete on their ability to accumulate, aggregate, and apply their assets to create value in new ways for increasingly diverse customers all over the world.
Source: Reprinted with permission from Atkinson and Correa (2007).
Beyond major metropolitan areas, the United States has continued to become more urbanized—or, more accurately, suburbanized, as we will discuss later. The population and employment picture for rural or nonmetropolitan areas has not been as steady as that in urban areas (Kusmin, 2003; Pigg, 1991). Many have suffered from the continued losses of manufacturing and farm employment. However, between 2005 and 2006, the 2 years before the Great Recession, rural counties actually experienced net domestic migration (where the number of in-migrants exceeded the number of out-migrants). This trend was greatest in western locations that combined scenic attributes with tourism, recreation, second-home development, and retirement migration. Parts of the rural South (Texas Hill Country, southern Appalachia, the Florida coast, and northern Virginia) experienced rapid growth due to the amenities they provided in conjunction with their proximity to metro employment (Kusmin, 2003).
Correspondingly, in some locations, the skill level of rural dwellers has increased to a degree that is competitive with urban and suburban areas. Extending the work on the creative class begun by Richard Florida (e.g., 2002), McGranahan and Wojan (2007) found that particularly high-amenity rural areas are competitive with urban areas in attracting the creative class. Their research provides an important contribution to understanding current economic development trends. The creative class is composed of people in highly creative occupations such as artists, architects, engineers, design, entertainment, and science. Florida argues that economic growth is driven by the creation of knowledge and ideas that primarily come from those in occupations that involve high levels of creativity. This creative class seeks a high quality of life as well as rewarding work. McGranahan and Wojan (2007) observed the following: “While developed with major metropolitan areas in mind, the creative-class thesis seems particularly relevant to rural areas, which lose much of their young talent as high school graduates leave, usually for highly urban environments” (p. 18). McGranahan and Wojan found that, between 1990 and 2004, rural counties with high proportions of creative-class workers experienced a 44% growth in jobs, while metro counties experienced a 39% job growth. Whether in rural or urban areas, the activities associated with the creative class bring new jobs and growth, and the message for all localities is to carefully preserve their natural amenities as well as to nurture their cultural resources.
People and Places Left Out of the New Economy
Growing Income and Earnings Inequality
One way of understanding the changing economy is to see how growth is shared between its component parts—labor and capital. While labor productivity has been increasing, this has not translated into increasing wages (Bivens and Mishel, 2015; DeNavas-Walt, Proctor, and Lee, 2006). The share of national income going to wages and salaries is the lowest ever recorded and fell below 50% for the first time in 2010, while the 14.15 share going to corporate profits was the highest ever recorded (Norris, 2011). Therefore, the common perception that all boats rise and fall as the overall economy cannot be assumed. Instead, more of the real gains are transferred to capital that may reside outside of the United States and to small segments of wealth-capturing groups with strong stock and other capital asset portfolios.
Not only has labor generally not shared in the increasing national prosperity, but there has also been a shift in the distribution of earnings within labor segments. The top of the economic pyramid has fared far better in the distribution of income than the bottom portion. The real improvements have been for those who receive income from capital flows rather than labor (Willis and Wroblewski, 2007). Between 1979 and 2007, the U.S. Congressional Budget Office (2014) found that after-tax income for the highest-income households grew more than it did for any other group (see Figure 1.2). Specifically, income increased 200% for the top 1% of households, 67% for the next 81st to 99th percentiles, 48% for the next 21st to 80th percentiles, and only 40% for the bottom 20%. As these trends have continued, they have finally become a major national focus and even the overriding and bipartisan issue of the 2016 presidential election contest.
Figure 1.2 Cumulative Growth in Average Inflation Adjusted After-Tax Income, by Before-Tax Income Group, 2011
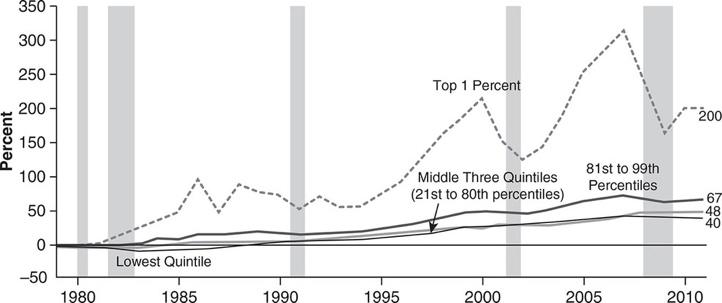
Source: U.S. Congressional Budget Office (2014).
Gaps in opportunity have also increased across all spectra of the economy. High tech and finance executives, as well as athletic superstars, who represent a very small segment of the nation have gained immensely relative to others. Decline in unions and manufacturing employment has pushed many less-educated and computer-illiterate workers into lower-wage jobs where they compete with international labor pools. The high level of unemployment due to the Great Recession eroded household savings and decreased wages as higher numbers of job seekers competed for few openings.
Debate over whether the middle class was shrinking or merely moving into the growing upper middle class has been an ongoing accompaniment to the shift to the New Economy (see Economic Developments 1.2). But the Great Recession and its lingering effects shifted the debate’s focus to the overall decline in the middle class, the top 1%, and to those whose education should have prepared them for a place in the middle class. A 2012 analysis estimated half of new college graduates were unemployed or underemployed (Yen, 2012). Boushy and Hersh (2012) made the case that a strong middle class is essential to a strong economy for four reasons. It promotes the development of human capital and a well-educated population; creates a stable source of demand for goods and services; incubates the next generation of entrepreneurs; and “supports inclusive political and economic institutions, which underpin economic growth” (p. 3).
The loss in middle-income families has had a corresponding impact on working middle-class neighborhoods. Middle-income neighborhoods have declined by 58% since 1970, according to a Brookings Institution study (Booza, Cutsinger, and Galster, 2006). This dramatic decline far outpaced the corresponding drop in the proportion of metropolitan families earning middle incomes, from 28% in 1970 to 22% in 2000. Of the nation’s 12 largest metropolitan areas, only 23% of their central city neighborhoods were middle class in 2000 (Booza et al., 2006). The Great Recession worsened these trends, as the study of rising metro segregation by income has found (Fry and Taylor, 2012).
Economic Developments 1.2: What Is Happening to the Middle Class?
The “plight of the middle class,” as it is subjected to forces transforming the U.S. economy has become a major topic of interest among economists, political analysts, policymakers and politicians. Economic development planners should understand the debate as the middle class is the backbone of the U.S. economy and American society. The middle class standard of living is a benchmark by which economic development progress is measured. Historically, the mass market has been oriented towards satisfying the middle class consumer. A position in the middle class is generally considered the development goal of the lower classes and of many of those who aspired to assist the lower classes.
The debate over what is happening to the middle class is intertwined with two other major economic debates: that of the U.S.’s industrial transformation, and that of the effects of changing demographics (aging baby boomers, immigration …). How the middle class is defined can make a significant difference in the trends observed and conclusions drawn. Various trend analyses have focused on earned income or total income, as well as household income or individual earnings. They have used different definitions of the middle (a range around the median level, or dividing the earnings or income distribution into quintiles and focusing on the three middle segments). Using household or family income enables one to look more at the total income picture. If the main concern is with impacts on standard of living, then household or family income may be the most appropriate variable for analysis. If the primary concern is what effect the declining middle has on employment and earning opportunities, then individual earnings is the appropriate variable. Both are important from an economic development perspective. Today, the two-earner household increasingly makes up the family income unit while there are also growing numbers of single earner/occupant households. How has the possibility for attaining a middle class standard of living changed in concert? Does it now take more than one earner in most households to achieve a middle standard of living? If so, does this represent economic development advancement if it takes two or more earners to maintain a middle standard where one could do so previously?
Source: Leigh, Nancey Green. (1994). Stemming Middle-Class Decline. New Brunswick, NJ: Center for Urban Policy Research, © 1994 by Rutgers, The State University of New Jersey.
Growing Racial Inequality
Income growth has been largely stagnant, with growing inequality between races. The median household income for all races was $51,939 in 2013, an increase of around 8% since 2006 (DeNavas-Walt et al., 2006; DeNavas-Walt, Proctor, and Smith, 2013). The median White household income was 112% of that for all households, while it was 129% for Asians, 79% for Hispanics, and only 67% for Blacks. This persistent racial inequality is reinforced by the fact that the Black poverty rate was the highest of all racial groups. At 27.2%, it was almost 3 times that of Whites and Asians and 3.7% higher than for Hispanics (see Table 1.1).
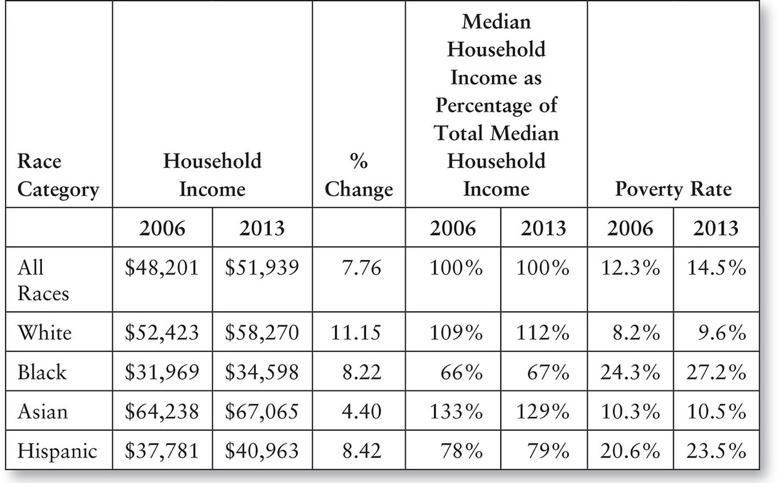
Sources: DeNavas-Walt et al. (2006, Tables 1, 3); DeNavas-Walt et al. (2013, Tables 1, 3).
Note: This edition uses “White, non-Hispanic”data from 2006 and 2013 tables.
In part, these discrepancies are attributable to racial differences in educational attainment and in single-earner versus dual-earner households. Additionally, foreign-born workers can remain trapped in various forms of domestic service work in which they have low wages and no bargaining power without better language skills. From an economic development perspective, the link between high rates of poverty and low educational attainment is clear. Consequently, the success of the local education system is a necessary foundation for local economic development.
Welfare reform introduced by President Clinton in 1994 was aimed at moving welfare recipients—particularly Black single-headed households—from poverty to work. It is clear that welfare rolls have declined substantially as a result of this law. While states now spend less on welfare per se, they spend a good deal more on job training, education, and programs designed to lower teenage pregnancy and other factors that cause intergenerational poverty (Haskins, Sawhill, and Weaver, 2001).
However, there is mounting evidence that the work welfare recipients find is low wage and often only part-time. Thus, those formerly dependent on welfare are increasingly working for wages at or below the poverty line, thereby requiring other forms of support, such as food stamps, to make ends meet.
The Working Poor
Former welfare recipients may be part of a larger group known as the working poor: persons who are in the labor force (at least 27 weeks) but still do not earn enough to have an income above the poverty level.
For the overall American labor force, the working poor grew from 6.5% to 7.0% between 2007 and 2013. Black (13.3%) and Hispanic (12.8%) rates of working poor were significantly higher than those for Whites (6.1%) and Asians (4.5%). Further, 27.5% of those who worked part-time involuntarily (because they wanted full-time work but could not obtain it) were also working poor. Being a member of the working poor is correlated with one’s occupation and educational level. Figure 1.3 shows that 19.2% of those without a high school education were working poor, compared to 2.3% of college graduates. Those who work in services, natural resources, construction, and maintenance jobs also had a much higher likelihood of being among the working poor (U.S. Department of Labor, 2015).
Figure 1.3 Working-Poor Rate, by Sex, Work Experience, and Educational Attainment, 2013
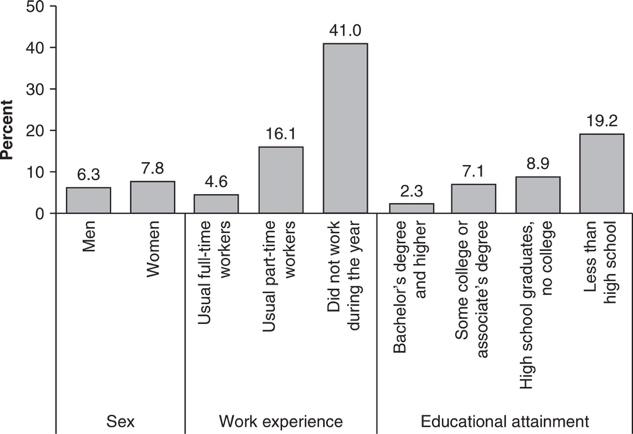
Source: U.S. Department of Labor (2015).
For families, those with children under 18 years were about 3 times more likely to be working poor, and those with female heads were more likely to be in poverty (U.S. Department of Labor, 2015).
As can be seen in Table 1.2, while about a quarter of the workforce is low wage (average hourly wage of $10.10 in 2011), two thirds of this low-wage workforce is female.
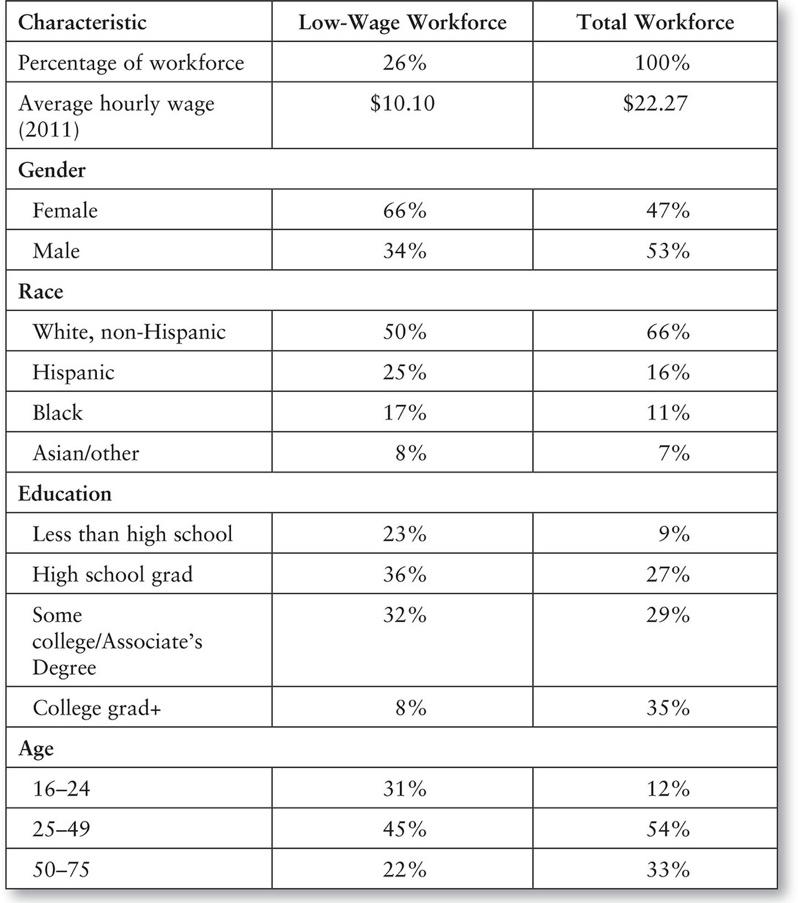
Source: National Women’s Law Center (2014).
Part-time low-wage work is no longer a short-lived interlude until a better full-time job is found. Few of the skills developed in low-wage work are transferable to higher-order jobs. In fact, many part-time jobs are de-skilling. For example, the worker becomes more of a watcher than a technical aid for the work performed. Store clerks no longer need to add and subtract, or indeed do any high-order functions, since the computer calculates and analyzes. Few part-time jobs offer any training or require much skill, so they are not ladders to anything better.
While globalization has increased the competition for lower-skilled workers in many countries, the fact is most of the United States’ lowest-paid part-time work cannot go overseas to sell hamburgers or make beds. This form of work is infiltrating sectors that once provided job ladders like custodial services and that served for many new immigrants as the way into government and other work. These civil-service job-ladder opportunities have been closing, as the work is now increasingly privatized and given to contractors. Low-skilled minorities, especially women, are caught in a vicious cycle of low-wage employment that is time consuming but not skill enhancing, and too often they lack the resources or support systems to further their educations so they can move to higher-wage occupations.
The Decline in Good Jobs
The picture of a deeply dividing labor force that Bennett Harrison (1978) painted more than three decades ago is still with us today. The picture of this labor force presented in Figure 1.4 is only slightly modified from what Harrison originally conceived. At the core of the current labor market are the primary (or good) jobs. Primary employment consists of career professional and technical positions with good wages and benefits, career mobility, and additional training opportunities. These jobs have historically been unionized or had some degree of employment security based on the ability of the workers holding these jobs to bargain, since they possessed skills and technical knowledge needed in the productive economy. In addition, jobs in the primary sector are generally more rewarding than other positions because they tend to be “knowledge intensive”—that is, individuals’ intellectual skills are more likely to be used in the work.
Figure 1.4 The Structure of Urban Labor Markets
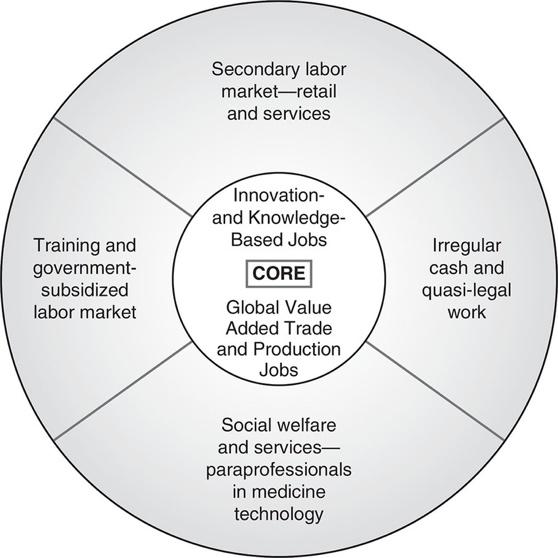
Source: Adapted from Harrison (1978).
Surrounding the core primary jobs are more marginal employment activities, which have increasingly come to be seen as bad jobs. The principal real employment in this segment lies in what has been called the secondary labor market: low-wage, unstable employment in personal consumer services areas or in firms that are footloose. The secondary labor market includes many occupational categories, ranging from manufacturing to clerical. Individuals in this market seldom have any job security and enjoy few benefits from their employers. As a consequence of the low wages paid in the jobs, individuals and families in most urban areas are forced to send more members of the family to work, including working-age children. At the top of the figure are the increasingly part-time retail jobs. To the left of the core are public sector job training programs for welfare-to-work transitions and displaced and hard-to-employ legal workers. To the right of the core is the segment of workers who are legal and illegal. The illegal portion is made up of individuals and some small firms that do all their business in cash and pay few or no taxes. A portion of this sector is engaged in illicit activities.
Government was a larger employer when Harrison (1978) first depicted the labor market. The jobs it shed have been replaced by those in the social welfare sector and by paraprofessional jobs in medicine, social services, and other arenas filled by contract employees. The latter work without benefits, so they are dependent on a new form of government handout from grants and contracts. This is a growing sector that has less power than the government agencies it replaces. Even the education sector is moving in this direction, with more and more schools privatizing as charter schools. While the charter schools give more local control over teachers and curriculum, they also provide less job security than the public system.
Good jobs are those that provide, at a minimum, a living wage so that if a person works year-round, full-time, his or her earnings will take him or her above the poverty level. These jobs also have employer-provided benefits such as health care, retirement plans, and opportunities for job training and career advancement. As more work becomes part-time and small employers replace larger ones, job quality is suffering. In particular, health care benefits are nearly as important as wages, for without health insurance, even a small medical emergency can push a household into bankruptcy. Further, when the only resource for an uninsured worker is the emergency room of a local government-supported hospital, the community suffers from excessive and unreimbursed use of the most expensive form of health care.
Employer-provided health insurance is more associated with larger employers who can realize cost savings from buying large group policies. However, large employers see the aging and unhealthy workforce as a future liability, particularly given the increasing incidence of type 2 diabetes, asthma, and other largely preventable diseases. This, in combination with soaring health care costs, caused major employers to cut back on health care coverage beginning in the 1980s (Economic Policy Institute, 2009). In turn, it led to growing calls for a national approach to providing health insurance. However, it wasn’t until 2010 that a national approach, in the form of the Affordable Care Act (ACA), materialized. Details on this approach are discussed in Chapter 2.
Inconsistent access to health care, corporate downsizing, offshoring of jobs, the decline of unionized jobs, and the rising use of temporary help agencies to meet firm employment needs are just some of the factors that have contributed to an eroding good jobs base. Some states and communities have tried to preserve and grow their good jobs base by tying job quality to the provision of economic development incentives.
Overall, the U.S. labor market faces substantial challenges in continuing to be the vehicle through which the majority of Americans, newcomers and old-timers, achieve the American way of life. Beyond corporate restructuring and offshoring, two trends represent particular challenges for marrying local economic development efforts with workforce development efforts. The first is incorporation of the foreign-born population, and the second is the rehabilitation of a growing and largely Black male prison population.
The Rise of the Foreign-Born Population
Foreign immigration increased from 4.7% in 1970 to 13.1% in 2013, and during this time, the regions from which immigrants came changed from predominantly Europe to Latin America, South Asia, or East Asia (Pew Research Center, 2015). Unlike previous generations, new immigrants from all regions of the world are able to keep many of their linguistic and other traditions, since international communications such as satellite television, radio, and the Internet make it easier to maintain contact with their homelands. As the new immigrants settle, they also become important assets to communities in a variety of ways, from providing needed labor to purchasing local goods and services.
On the other hand, new immigrants are seen as competing for jobs at the low end of the scale, thereby depriving local workers of these jobs. Immigrants are also producing increasing numbers of children due to higher fertility rates than the locally born or domestic population. Immigrants work and do pay taxes, but in areas with high concentrations of low-skilled, low-paid immigrants, they impose net costs on U.S.–born workers. The reason for the so-called immigrant burden is that illegal immigrants receive services like education and health care for which they may not pay directly, since they seldom pay property and income taxes. Furthermore, the vast majority of legal immigrants are in the lowest income groups and thus have higher welfare or other public supports. Yet, as we will discuss later in this book, immigrants have the potential to be strong forces for local economic development.
Prison Populations
Prisons became the de facto “employers” for many of the nation’s minority males as a consequence of their first work experience: drug dealing. They are disproportionately home to young Black males, generating incarceration role models that have become celebrated in pop music. In 2014, 6% of the Black population aged 30 to 39 was in prison, compared to just 2% of Hispanics and 1% of Whites in that age group. This translates to 2,724 Black inmates per 100,000 Black male residents serving sentences of at least 1 year, compared with 1,090 Hispanic inmates per 100,000 Hispanic male residents, and only 465 White inmates per 100,000 White male residents. Further, younger Black males ages 18 to 19 were 10 times more likely to be in state or federal prisons than White males (U.S. Department of Justice, 2015).
The tragically higher rate of Black males in prison is a symptom of household and community dysfunction that has generated deep despair among policymakers of all colors who are unable to find successful corrective courses of action. Table 1.3 shows that low attachment rates to the educational system significantly increase the likelihood that Blacks, Hispanics, and Whites will become incarcerated and diminish their chances for fully participating in the legal economy. Post-release from prison, few can find living-wage work. Moreover, state lawmakers eager to show toughness on crime extended sentences, thereby reducing the possibility of successful rehabilitation to community life.
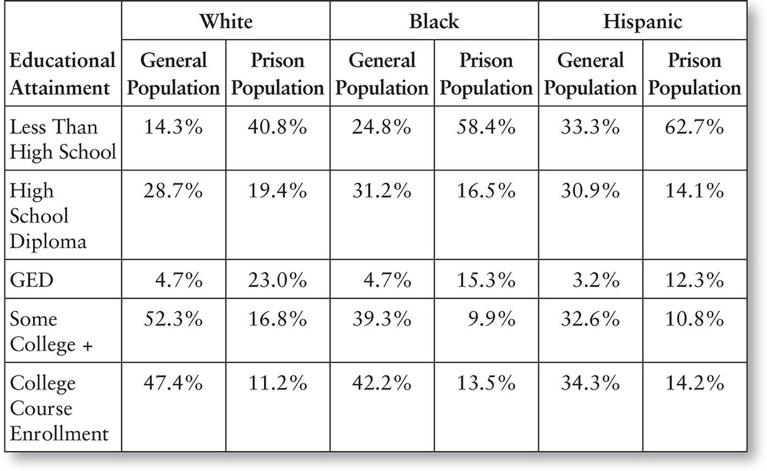
Source: Ewert and Wildhagen (2011).
There are two significant recent policy efforts aimed at increasing the possibilities for the formerly incarcerated to successfully gain employment and reenter society. The first is the Ban the Box movement focused on ensuring employers provide a fair chance to job applicants by removing the question on history of conviction from application forms. This question typically results in the applicant being excluded from any further consideration. By removing the box, inquiries into an applicant’s record come later in the hiring process and give applicants a chance to show their qualifications (and rehabilitation). Twenty-one states and more than 100 cities and counties have adopted some form of Ban the Box policy as of 2016 (Rodriguez and Avery, 2016).
The second policy effort explicitly recognizes the correlation between levels of low education and high incarceration. At the federal and state level, there is a push to provide greater levels of general, vocational, and college-level education to prisoners. Some cities are also taking the initiative to address this critical problem, as can be seen in Economic Developments 1.3. Recent studies have shown that inmates who receive education are much less likely to be incarcerated after release. Further, the costs of providing education to prisoners are estimated to be less than one fifth of the costs of reincarceration (Davis et al., 2013).
Economic Developments 1.3: Five Keys Charter School Provides Education Access to Prisoners in California*
* Research assistance provided by Ashley Bozarth.
The United States has not only the largest prison population in the world but also relatively high recidivism for parolees. These high rates indicate that incarceration should not be the sole solution to support criminals’ reintegration into society. Since there is considerable evidence that crime and imprisonment are associated with lack of education, increasing comprehensive (core subject and socioemotional) educational opportunities for prisoners could reduce recidivism and alleviate the ever-increasing social and fiscal costs of incarceration.
In San Francisco, the sheriff’s department Five Keys Charter School (FKCS), a nonprofit corporation, offers educational access to adults in county jails or to those on probation or parole in treatment facilities or workforce development programs. The network of schools is public, and courses are based on requirements through the California Department of Education and completely funded by the San Francisco United School District. Since the jails’ budgets cover costs of rent, food, transportation, and facilities, Five Keys can utilize school district funds primarily for investments in technology and intensive programs involving English as a second language (ESL), mental health, and special and remedial education.
The original school, FKCS, was founded in 2003 and offers classroom-based full-day school to men in county jails. The Five Keys Adult School (FKAS) was later established to provide full-day classes for men and women. In addition to traditional core courses for the GED/high school diploma, both programs emphasize wraparound support classes on restorative justice, parenting, violence prevention, substance abuse, and career preparation. At FKAS, unlike FKCS, classes go year-round and are held within the inmate housing units, ensuring broader access by incarcerated adults (Visiting Committee Report, 2015).
Five Keys also expanded its programs outside of jail through Five Keys Independence High (FKIH), providing independent study options to men and women in jail or out on parole who cannot attend classes on-site, and to those working and/or enrolled in job training or residential treatment programs. Students complete independent study courses, meet with teachers at least once a week, and have the option of attending daily classes. These various options of school type within the FKCS system provide students a fluid system to start and/or continue their education once released (Visiting Committee Report, 2015).
FKCS serves most county jails in San Francisco and expanded to Los Angeles County jails in 2012. The charter now offers kindergarten through 12th grade courses to address the needs of students on all levels. To address low retention rates after release, there are future plans to offer online courses and mobile classroom sites on refurbished city buses for parolees in remote and/or rural areas (Visiting Committee Report, 2015).
In the 2013–2014 school year, Five Keys served 9,528 students, 37% of which were Black, 27% Hispanic, and 14% White. Of all students, 82% were male, and 61% were incarcerated. Of all the students who took the California High School Exit Examination in 2013, 79% passed the English section and 70% the math section. In addition, 70% of students enrolled for at least two months had access to vocational training and thus better chances of finding employment (Visiting Committee Report, 2015). Based on a recent report, Five Keys has a recidivism rate of 28% compared to the California state average of 68% (Barba, 2015; California Department of Corrections and Rehabilitation, 2014).
The San Francisco Sheriff’s Department recently won the 2015 Innovation in American Government Award from Harvard University for its increasing impact on students and their local communities (Barba, 2015). Adequate funding, continuity of education between the charter organization’s on-site and independent studies programs, as well as a comprehensive curriculum including socioemotional courses allow students at Five Keys a flexible and supportive path toward workforce entry. This program in California offers just one example of a burgeoning movement to recapture a group of men and women who often lack access to adult education and career development opportunities.
Growing Spatial Inequality
Two primary ways to examine trends in spatial or regional inequality in the United States are through the categories of major regions (Northeast, Midwest, South, and West) and the metro and nonmetro regions (treated as synonymous with urban and rural). From Table 1.4, we see that there are significant differences in income levels, incidences of poverty, and lack of health insurance coverage between the four major regions and within metro regions as well as between metro and nonmetro regions. Despite the high population and employment growth rates the South has experienced for many decades, its income levels continue to lag behind the other regions of the United States, while the proportion of persons in poverty and lacking health insurance is highest. Even though the West had the highest income in 2012, the proportion of westerners lacking health insurance was almost as high as the South’s. The Northeast and Midwest rank second and third, respectively, for the three standard-of-living indicators: income, percentage below poverty, and percentage without health insurance. Although both regions have suffered significant losses in good jobs over the last several decades due to manufacturing decline in the industrial heartland, the stronger labor agreements that are the legacy of unionization have helped to stabilize their standards of living. However, the Midwest was the only region to see increases in population without health insurance coverage.
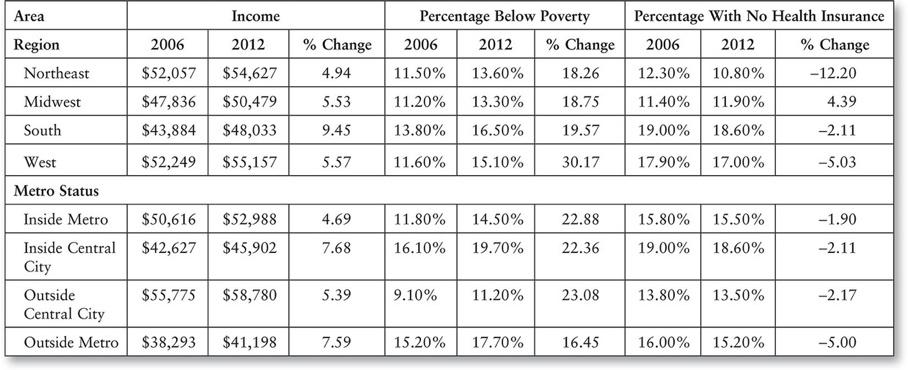
Sources: DeNavas-Walt et al. (2006); DeNavas-Walt et al. (2013).
Within each of the four regions, there is significant diversion in standards of living and economic development at the state and substate levels. As discussed previously, much of this diversion is attributable to whether a location within a region has natural amenities such as mountains and coastlines that make logical resort choices or whether it is part of a metropolitan area. Indeed, it is not regions or states but metropolitan areas that are the true drivers of U.S. development. Around four fifths of the U.S. population lives in metropolitan areas, and half of the U.S. population lives in their suburbs. Even more significant is that U.S. population and economic activity are concentrated in only one third of all our metro areas:
The 100 largest U.S. metropolitan areas contain 65 percent of the nation’s population and 68 percent of its jobs, but gather even larger shares of innovative activity (78 percent of U.S. patent activity), educated workers (75 percent of graduate degree holders), and critical infrastructure (79 percent of U.S. air cargo). As such, they generate three-quarters of U.S. gross domestic product. (Berube, 2007, p. 7)
Dabson (2007) detailed the key connections between the nation’s metro and rural economies, noting that the major metro economies “draw strength from, and provide benefits to, smaller places throughout the nation.” Indeed, more than half of the population living in rural areas, defined as low-density areas and towns, are in counties within metropolitan areas (Dabson, 2007). Dabson (2007) noted that firms in major metropolitan areas depend on the lower cost labor in these rural areas, which are either part of their commuter sheds or may be hundreds of miles away and provide business process services made possible by IT advances.
Increasing Metropolitan Inequality
Despite metropolitan America—particularly its top 100 cities—being the geographic focal point of U.S. economic growth, there are a number of concerns raised by recent patterns. First, there is a twin set of increasing bifurcation occurring within metro areas. This is associated with the significant suburbanization within U.S. metropolitan areas that has transformed metropolitan spatial structure from the dichotomous form of central city–suburbs to one of a multiring polycentric structure with suburban rings and subcenters (see Figure 1.5). The resulting metropolitan region is an interactive system of downtown, inner city, inner-ring suburbs, outer-ring suburbs, subcenters, and exurbs. Within this system, downtowns are experiencing gentrification and revitalization in reaction to the long commutes associated with metropolitan sprawl, while the minority-populated inner-city portion of the central city continues to suffer from high crime rates, disinvestment, poor schools, and poverty concentration. At the same time, the suburbs are becoming increasingly differentiated, and the inner-ring suburbs have been experiencing declining household incomes. Their aging housing stock is being occupied by new immigrants and the traditional poverty population that is being displaced by “back to the downtown” movements (Lee and Leigh, 2007).
Figure 1.5 The Emergence of Suburban Rings and Subcenters in the Metropolitan Areas
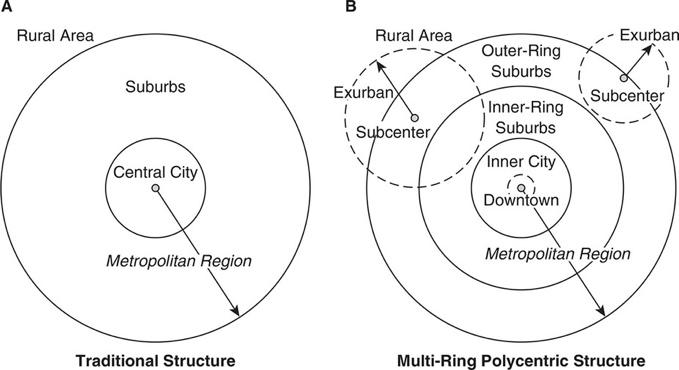
Source: Lee and Leigh (2004).
The signs of suburban decline are clear, including homeless people in shopping malls in many close-in suburbs and even some affluent areas. Affordable housing, which was a code word in the 1980s for low-income housing, is now a concern of suburban police officers and schoolteachers as well as the poor. The suburbs have also witnessed a rise in crime and in the number of new social problems in their midst, with many families experiencing stress and rising levels of child abuse and family dysfunction. Suburban schools, once thought to be sanctuaries, have experienced violence of unimaginable scale and horror across the nation. In April 2007, Blacksburg, Virginia—a small picturesque college town with no history of violence—rocked the nation with 32 unprovoked killings by a psychotic student. Less than a decade earlier, Columbine High School in Colorado Springs experienced a similar incident. Although some have blamed television for these horrific acts, many sociologists blame the suburban living arrangements that isolate youth from a larger network of social settings, which fosters good communal life. At the same time, participation has been declining in community institutions that formed the backbone of civic life for 50 years, such as PTAs, 4-H clubs, and Lions Clubs; even attendance in traditional churches has been in long-term decline (Putnam, 2000).
Increasing Rural Inequality
The bifurcation in economic fortunes within rural areas and small towns is just as significant as that which has occurred within our metro areas. Those who prosper, as previously discussed, have significant natural amenities and/or are close to a thriving metropolitan area. Those with an employment base in farming continue to experience net job and population loss.
Farmland speculation, global competition, and overproduction have severely taxed many rural communities. As farms collapse, mines close, and other natural resource operations diminish, the dwindling employment base in agriculture and extractive areas declines even more swiftly. The loss in farm, timber, and mining income has a disastrous ripple effect through an entire community. In fact, many single-crop and single-firm nonmetropolitan communities have been extremely vulnerable due to their narrow economies. Further, manufacturing branch plant closings have had a more marked impact on rural than urban communities. As branch plant economies, these communities exercise little control over the corporate decision-making process. When international commodity prices fluctuate, the actions of other suppliers of raw materials influence the base economy. In a sense, some rural communities have been trapped by their own success in attracting firms and expanding foreign trade. They need to reformulate their economic development strategies to achieve more resilient economies. However, their most recent major growth opportunity—shale oil production—presents profound challenges for becoming a sustainable and resilient economic development strategy.
Shaping Global Warming: The U.S. Economic Engine
Only a small minority of scientists and policy advocates refuse to recognize the significance of climate change for the U.S. and global economy. With less than 5% of the world’s population, the United States produces more than 15% of the CO2 gases that threaten the global atmosphere. Our American lifestyle is not without cost to the rest of the world. Americans consume more than a quarter of the world’s natural resources to maintain an increasingly fragile form of consumption-oriented living. Americans transport, consume, and produce debris in greater quantities than almost all of the rest of the world combined. We are running out of landfills for our waste and reducing our own fresh water supply by our wasteful practices.
The International Panel on Climate Change report indicates global temperatures may rise as much as 6 degrees Celsius (11 degrees Fahrenheit) by the turn of the next century. Accompanying sea level rise could inundate more than 70% of the world’s largest metropolitan areas located on coasts. Cities like New York, Sydney, and Mumbai are equally threatened by sea level rises of as much as 3 to 6 feet. While the sea is rising, we are also witnessing other regions threatened by spreading drought and deserts.
The economic consequences of global warming are far from trivial, yet the actions needed to deal with climate change may still be within our grasp. But how proactively nations will confront this impending disaster is not certain. Despite the fact that, until recently, the United States was leading greenhouse gas (GHG) emitter in the world, many see reductions in the production of GHGs to be hostile to economies. Meanwhile, China, now the world’s top emitter of GHGs, and other rapidly growing nations like India are adopting U.S.-style living patterns as their growing middle classes urbanize and adopt automobile-based economic and cultural systems. As their combined population is several billion compared with 320 million for the United States, adoption of U.S. consumption and auto-dependent lifestyles by these nations has begun to greatly accelerate global warming.
The only real recourse is for a new economy to emerge that is less dependent on fossil fuels and more oriented toward the production of low-energy and low-waste lifestyles. Some policymakers and scientists see this new economy as one that uses substitutes for fossil fuels and for materials that alter the form but not the content of the current lifestyles—that is, substituting wind or corn for fossil fuels might be a way around the current energy-production system. Others view climate change as the call to drastically change our way of life—to produce communities that are less dependent on fuels for survival and that produce more of their own food to be consumed locally rather than transported nationally or globally. This latter approach takes people out of their cars and does not just substitute for the automobile. Switching to a non-auto-based and low-energy American way of life is a major challenge that some see as insurmountable for the United States and the rest of the world. So new techniques for lowering fuel consumption and better using existing resources are the preferred alternatives. This means a vastly different economic engine will have to be produced in very short order to prevent massive dislocations of people and the starvation of many.
While the national governments of the largest CO2 producers are slow to acknowledge and respond to the challenge of global warming, there is a growing local level response that was initiated when Seattle’s mayor Greg Nickels became the first to adopt the Kyoto Protocol in May 2005. Established in 1997, the international climate change treaty aimed for an average 5% reduction in GHG emissions in developed nations by 2012. While the United States never actually ratified the treaty, 2 years after Nickels’s adoption, the U.S. Conference of Mayors (2014) endorsed his Climate Protection Agreement, and more than 1,060 U.S. mayors from all 50 states, Washington, DC, and Puerto Rico signed on to it. This agreement required mayors to (1) strive to meet or beat the Kyoto Protocol targets in their own communities, through actions ranging from antisprawl land-use policies to urban forest restoration projects to public information campaigns; (2) urge their state governments and the federal government to enact policies and programs to meet or beat the GHG emission reduction target suggested for the United States in the Kyoto Protocol—7% reduction from 1990 levels by 2012; and (3) urge the U.S. Congress to pass the bipartisan GHG reduction legislation, which would establish a national emission trading system. In 2014, the Climate Protection Agreement was renewed and included local strategies such as incentives for carpooling and public transit, increased use of renewable energies, maintenance of urban forests, and investments in green infrastructure to increase city resiliency (U.S. Conference of Mayors, 2014).
Additionally, nonprofit organizations such as KyotoUSA and the ICLEI–Local Governments for Sustainability are providing assistance to community groups as well as local governments seeking to protect our climate (see www.kyotoUSA.org and www.ICLEI.org). Over 600 U.S. cities had measured their GHG emissions and adopted reduction plans with ICLEI assistance by 2012. In 2014, ICLEI partnered with the World Resources Institute (WRI) and C40 Cities Climate Leadership Group to launch the Global Protocol for Community-Scale Greenhouse Gas Emission Inventories (GPC) through which participating cities measure, report, and compare emissions based on comprehensive standards. The initiative will strengthen the Compact of Mayors, the largest international effort among cities to reduce GHG emissions (www.ghgprotocol.org). These coordinated, citywide efforts are all the more crucial, as projections show that 66% of the world’s population will live in urban areas by 2050 (United Nations Department of Economic and Social Affairs, 2014).
The Future of Local Economic Development Planning
The United States is enmeshed in the global market system as leader, follower, and participant. No American firm of any size remains solely within the domestic market system and, consequently, neither does any American community. American firms and labor once shielded from international competition are now subject to the vagaries of international finance. The traditional system of economic development planning and practice has not only been ineffective in responding to a market system that itself has undergone globalizing structural shifts, but it is also actually contributing to structural shifts in environmental and social systems that are significant cause for concern. Growing recognition of evidence of these shifts in the form of widening inequality and global warming increasingly appears to be a tipping point from which we may be able to look back one day and see a transformation of the traditional system of economic development planning and practice. In addition to the mayors who have signed on to the Climate Protection Agreement and the cities that have already measured their GHG emissions, other key actors are taking major steps. For example, the International City/County Management Association (ICMA) adopted a formal resolution on sustainability in October 2007 that requires recognition of the interdependence between environmental stewardship, economic development, social equity, and financial viability. The Brookings Institution has formulated a Blueprint for American Prosperity that calls for “productive, inclusive, and sustainable growth that helps the United States maintain its economic leadership, fosters a strong and diverse middle class, and advances U.S. efforts to address climate change and achieve energy independence” (Berube, 2007, p. 22). Lastly, the economic stimulus package of the Obama administration aimed at bringing the United States out of recession incorporated major provisions for creating sustainable jobs and economic activities.
American communities can no longer depend—if they ever could—on an industry base that pledges long-term loyalty to a community or its workers. Silicon Valley is only slightly better positioned to handle the New Economy than Peoria, Illinois. And any such advantage is temporary. Therefore, communities must obtain more control over their economic directions and destinies. The task may be difficult, but it is not impossible. Local economic and political decision makers need not surrender their communities’ fates to chance, the marketplace, or unsupportive federal policies. Policymakers in local economic development must confront many crucial questions. Can anything meaningful be done to incorporate the unemployed and underemployed into the employment system? Are there enough jobs? Are there enough good jobs? Are there sufficient energy and natural resources to support the local economy? Can a single community tackle the problems of joblessness, homelessness, or climate change by itself? Can a politically and economically divided nation meet its goals of providing for all?
There are, of course, no clear answers to these questions. But it is clear that communities must have a better perspective on the problems affecting the global economy and their consequences for citizens in general and for specific groups. Local economic development and employment creation can be designed more effectively to deal with these problems. Adopting strategies that promote the green economy, foster entrepreneurship and local cultural assets, and substitute locally produced goods and services for those imported into the community as well as for export to the global economy are a few of the possibilities. The central thesis of this book is that locally based economic development and employment generation are more likely to be successful if initiated at the community and local level than elsewhere. Each of the factors influencing the economy has unique manifestations and slightly different causes in each local area. Solutions to community problems will not succeed if they are not targeted to specific groups and linked to the total regional economic system. Although this book is written for a U.S. audience, we are mindful of the growing international audience adopting the same strategies. Previous book editions have been translated into Korean, Arabic, Spanish, Dutch, German, and Russian in whole or in part, with a special edition for India.
Local economies the world over can translate these circumstances into their own settings. We hope that everyone who reads this book, whether in urban or rural areas, and whether in the United States or elsewhere, develops a new concept of how to solve local dilemmas for now and for many years to come.
Community leaders can assess their community’s situation and place it in a larger context. Similarly, they can assess affected groups to determine how these will respond to different courses of action. In this way, local solutions can be found for national problems. The next chapter explores the dimensions of national policy that currently serve as a basis for local economic development.
References and Suggested Readings
Aron-Dine, Aviva, and Isaac Shapiro. 2007. Share of National Income Going to Wages and Salaries at Record Low in 2006: Share of Income Going to Corporate Profits at Record High. Washington, DC: Center on Budget and Policy Priorities. Accessed February 19, 2009. http://www.cbpp.org/8–31–06inc.htm.
Atkinson, Robert D., and Correa Daniel K. 2007. The 2007 State New Economy Index. Washington, DC: The Information Technology and Innovation Foundation.
Atkinson, Robert D., and Paul D. Gottlieb. 2001. The Metropolitan New Economy Index. Washington, DC: The Public Policy Institute. Accessed August 18, 2012. http://opensource.telkomspeedy.com/repo/abba/v01/DLL/NewEconomy Index/2001–04-metropolitan.pdf.
Barba, Michael. 2015. “Sheriff’s Department Awarded $100,000 by Harvard for Inmate Charter School.” San Francisco Examiner, September 22. http://www.sfexaminer.com/sheriffs-department-awarded-100000-by-harvard-for-inmate-charter-school.
Berube, Alan. 2007. MetroNation: How U.S. Metropolitan Areas Fuel American Prosperity. Washington, DC: Brookings Institution, Metropolitan Policy Program.
Bivens, Josh, and Lawrence Mishel. 2015. “Understanding the Historic Divergence Between Productivity and a Typical Worker’s Pay.” Economic Policy Institute, September 2. Accessed March 22, 2016. http://www.epi.org/publication/ understanding-the-historic-divergence-between-productivity-and-a-typical-workers-pay-why-it-matters-and-why-its-real.
Blinder, Allan. 2007. Will the Middle Hold? Two Problems of American Labor. Testimony to the Joint Economic Committee, January 31.
Booza, Jason C., Jackie Cutsinger, and Galster George. 2006. Where Did They Go? The Decline of Middle-Income Neighborhoods in Metropolitan America. Washington, DC: Brookings Institution.
Boushy, Heather, and Adam S. Hersh. May 2012. “The American Middle Class, Income Inequality and the Strength of Our Economy.” Accessed May 20, 2012. www.americanprogress.org.
Bradshaw, Ted K., and Blakely Edward J. 1999. “What Are ‘Third-Wave’ State Economic Development Efforts? From Incentives to Industrial Policy.” Economic Development Quarterly 13 (3): 229–244.
California Department of Corrections and Rehabilitation. 2014. 2013 Outcome Evaluation Report, January. Accessed October 6, 2015. http://www.cdcr.ca.gov/adult_research_branch/research_documents/outcome_evaluation_report_2013.pdf.
Camarota, Steven A. 2007. 100 Million More: Projecting the Impact of Immigration on the U.S. Population, 2007 to 2060. Washington, DC: Center for Immigration Studies. Accessed November 6, 2007. http://www.cis.org/articles/2007/back707.html.
Dabson, Brian. 2007. Rural–Urban Interdependence: Why Metropolitan and Rural America Need Each Other. A background paper prepared for the Blueprint for American Prosperity Metropolitan Policy Program, Brookings Institution, November.
Davis, Lois M., Robert Bozick, Jennifer L. Steele, Jessica Saunders, and Jeremy N. V. Miles. 2013. Evaluating the Effectiveness of Correctional Education: A Meta-Analysis of Programs That Provide Education to Incarcerated Adults. Santa Monica, CA: RAND Corporation. http://www.rand.org/pubs/research_reports/RR266.html.
DeNavas-Walt, Carmen, Bernadette D.Proctor, and Cheryl Hill Lee. 2006. Income, Poverty, and Health Insurance Coverage in the United States: 2005. Washington, DC: U.S. Census Bureau, Current Population Reports.
DeNavas-Walt, Carmen, Bernadette D.Proctor, and Jessica C. Smith. 2013. Income, Poverty, and Health Insurance Coverage in the United States: 2012. Washington, DC: U.S. Census Bureau, Current Population Reports.
Dun and Bradstreet. 2011. The State of Small Businesses Post Great Recession, An Analysis of Small Businesses Between 2007 and 2011, May. Accessed May 20, 2012. http://www.dnbgov.com/pdf/DNB_SMB_Report_May2011.pdf.
Economic Policy Institute. 2009. Accessed October 3, 2011. http://www.epi.org.
Ewert, Stephanie, and Tara Wildhagen. 2011. Educational Characteristics of Prisoners: Data from the ACS. Washington, DC: U.S. Census Bureau, Housing and Household Economic Statistics Division.
Florida, Richard. 2002. The Rise of the Creative Class: And How It’s Transforming Work, Leisure, Community, and Everyday Life. New York: Basic Books.
Friedman, Thomas. 2005. “It’s a Flattened World, After All.” New York Times, April 3. http://www.nytimes.com/2005/04/03/magazine/its-a-flat-world-after-all.html.
Fry, Richard, and Paul Taylor. 2012. “The Rise of Residential Segregation by Income.” Pew Research Center, August 1. Accessed March 22, 2016. http://www.pewsocialtrends.org/2012/08/01/the-rise-of-residential-segregation-by-income.
Harrison, Bennett. 1978. Job! What Kind, for Whom, and Where? Cambridge, MA: MIT Press.
Harrison, Paige M., and Beck Allen J. 2006. Prison and Jail Inmates at Midyear 2005. Washington, DC: U.S. Department of Justice, Bureau of Justice Statistics, May.
Haskins, Ron, Isabel V. Sawhill, and Kent Weaver R. 2001. Welfare Reform: An Overview of Effects to Date. Washington, DC: Brookings Institution.
International Monetary Fund. 2007. World Economic Outlook: Globalization and Inequality, October. Accessed February 19, 2009. https://www.imf.org/external/pubs/ft/weo/2007/02/pdf/c1.pdf.
International Monetary Fund. 2015. World Economic Outlook: Adjusting to Lower Commodity Prices, October. Accessed March 21, 2016. http://www.imf.org/external/pubs/ft/weo/2015/02/pdf/tblparta.pdf.
Kim, Chan, and Renee Mauborgne. 2004. “Blue Ocean Strategy.” Harvard Business Review 82 (10): 79–88.
Kusmin, Lorin D. 2003. Rural America at a Glance. U.S. Department of Agriculture Economic Research Service, Economic Information Bulletin, p. 31.
Lee, Sugie, and Leigh Nancey Green. 2004. “Philadelphia’s Space in Between: Inner-Ring Suburbs Evolution.” Opolis: An International Journal of Suburban and Metropolitan Studies 1 (1): 13–32.
Lee, Sugie, and Leigh Nancey Green. 2005. “The Role of Inner Ring Suburbs in Metropolitan Smart Growth Strategies.” Journal of Planning Literature 19 (3): 330–346.
Lee, Sugie, and Leigh Nancey Green. 2007. “Intrametropolitan Spatial Differentiation and Decline of Inner-Ring Suburbs: A Comparison of Four U.S. Metropolitan Areas.” Journal of Planning Education and Research 27 (2): 146–164.
Leigh, Nancey Green. 1994. Stemming Middle Class Decline: The Challenge to Economic Development. New Brunswick, NJ: Center of Urban Policy Research.
McGranahan, David A., and Wojan Timothy R. 2007. “The Creative Class: A Key to Rural Growth.” Amber Waves. U.S. Department of Agriculture Economic Research Service, April.
McNeil, Lawrence R. 2007. “Foreign Direct Investment in the United States: New Investment in 2006.” Survey of Current Business, June, pp. 44–51. Accessed February 19, 2009. http://www.bea.gov/scb/index.htm.
National Women’s Law Center. 2014. Underpaid & Overloaded: Women in Low-Wage Jobs. Figures 1, 2A, 2B, 3A, 3B, 6A, and 6B. Accessed August 29, 2015. http://www.nwlc.org/sites/default/files/pdfs/final_nwlc_lowwagereport2014.pdf.
Norris, Floyd. 2011. “As Profits Rise, Workers’ Income Declines.” New York Times, August 5.
Pew Research Center. 2015. Modern Immigration Wave Brings 59 Million to U.S., Driving Population Growth and Change Through 2065: Views of Immigration’s Impact on U.S. Society Mixed. Washington, DC: Author.
Pigg, Kenneth. 1991. The Future of Rural America: Anticipating Policies for Constructive Change. Boulder, CO: Westview.
Putnam, Robert D. 2000. Bowling Alone: The Collapse and Revival of American Community. New York: Simon & Schuster.
Price Waterhouse Cooper. 2012. “Economic Impact of U.S. Subsidiaries: Prepared for the Organization for International Investment.” Accessed May 10, 2012. http://www.ofii.org/docs/OFII_Report_May_2012_PwC.pdf.
Rodriguez, Michelle Natividad, and Beth Avery. 2016. “Ban the Box: U.S. Cities, Counties, and States Adopt Fair Hiring Policies.” National Employment Law Project. Accessed March 22, 2016. http://www.nelp.org/publication/ban-the- box-fair-chance-hiring-state-and-local-guide.
Sassen, Saskia. 2006. Territory, Authority, Rights: From Medieval to Global Assemblages. Princeton, NJ: Princeton University Press.
Schumpeter, Joseph. 1947. Capitalism, Socialism, and Democracy. New York: Harper.
United Nations Department of Economic and Social Affairs, Population Division. 2014. World Urbanization Prospects, the 2014 Revision. Accessed March 12, 2016. http://esa.un.org/unpd/wup.
U.S. Bureau of Labor Statistics. 2012. The Editor’s Desk, April 5. Accessed May 20, 2012. http://www.bls.gov/opub/ted/2012/ted_20120405.htm.
U.S. Census Bureau, Current Population Survey. 2014. Annual Social and Economic Supplement. Accessed August 27, 2015. https://www.census.gove/content/dam/Census/library/publications/2014/demo/p60–250.pdf.
U.S. Conference of Mayors. 2014. Nation’s Mayors Expand Their Commitment to Attack Local Climate Challenges [Press Release], June 23. Accessed February 29, 2016. http://www.usmayors.org/82ndAnnualMeeting/media/0623-release-climate challenges.pdf.
U.S. Congressional Budget Office. 2014. The Distribution of Household Income and Federal Taxes, 2011. Accessed August 27, 2015. https://www.cbo.gov/sites/default/files/113th-congress-2013–2014/reports/49440-Distribution-of-Income-and-Taxes.pdf.
U.S. Department of Justice, U.S. Bureau of Justice Statistics. 2015. Prisoners in 2014, September. Reported compiled by E. Ann Carson. Accessed October 25, 2015. http://www.bjs.gov/content/pub/pdf/p14.pdf.
U.S. Department of Labor, U.S. Bureau of Labor Statistics. 2015. A Profile of the Working Poor, 2013, July. Accessed August 27, 2015. http://www.bls.gov/opub/reports/cps/a-profile-of-the-working-poor-2013.pdf.
Visiting Committee Report. 2015. Keys Charter, Schools and Programs. Accessed October 6, 2015. http://www.fivekeyscharter.org/images/pdfs/Publications/VISITING_COMMITTEE_REPORT-Five_Keys-San_Francisco-Los_Angeles-Final_FINAL_Report.pdf.
Willis, Jonathan, and Julie Wroblewski. 2007. “What Happens to Gains, From Strong Productivity Growth?” Federal Reserve of Kansas City Quarterly, first quarter.
Yen, Hope. 2012. “1 in 2 New Graduates Are Jobless or Underemployed.” SFGATE, April 22. http://www.sfgate.com/cgibin/article.cgi?f=/n/a/2012/04/22/national/w070232D21.DTL#ixzz1vQY62lHo.


