i need it in 1 hour
BA 376 Form 1
Final Exam Fall 2016
Testing Agreement: Please read the statement below and sign your agreement. Please contact me immediately if you want clarification or disagree with this statement.
“I agree to complete this test on my own and without helping (or receiving help from) others. I consider myself “on my honor” to work independently. I agree to inform the instructor if I know of any cheating occurring during this test.”
Signed,
Printed Name:
BA 376 Name:_______________________
This 100 minute exam consists of 28 multiple choice questions (5 points each) and two open-ended questions at the end for a total of 150 points. Please pick the BEST available answer for the multiple choice questions and bubble in that answer. Please answer the open ended questions briefly, in the space provided. You must indicate your final answers in the time allotted. Good luck!
No phones or computers No help or collaboration with any other people
Calculator Allowed. Standard normal (z table) allowed
Notecard Allowed (standard 3x5 size, both sides)
Please do not turn this page until instructed to begin.
Some potentially useful equations:
IQR = Q3 – Q1 


 SST = SSR + SSE


SST = SSTr + SSE SST = SSR + SSE r2 = SSR/SST
A researcher wants to better understand the market for renewable energy in the US. She wants to investigate if there is a difference between the cost of electricity from solar, wind, nuclear, or coal sources. She finds the cost per kilowatt hour at a group of power plants, and notes which of these sources is used in each plant. What test is most appropriate in this case?
Difference of two proportions
Chi-squared goodness of fit test
Difference of two independent means
Difference of two matched means
ANOVA test of multiple means
A researcher wants to better understand the market for renewable energy in the US. She reviews a large data set to see if there is a relationship between the type of area a customer lives in (urban, suburban, or rural), and whether they already purchase renewables, are considering purchasing renewables, or are not considering purchasing renewables. What test is most appropriate in this case?
Difference of two proportions
Chi-squared test of independence
Difference of two independent means
Difference of two matched means
Multiple linear regression
A researcher wants to better understand the market for renewable energy in the US. She checks to see whether respondents’ ages predict how much of a premium they are willing to pay for renewable energy. What test is most appropriate in this case?
Difference of two proportions
Chi-squared goodness of fit test
Chi-squared test of independence
Difference of two independent means
Simple linear regression
A researcher wants to better understand the market for renewable energy in the US. She checks to see whether respondents’ ages, incomes, monthly power usage, or home size (in square feet) predict how much of a premium they are willing to pay for renewable energy. What test is most appropriate in this case?
Chi-squared goodness of fit test
Difference of two matched means
ANOVA test of multiple means
Simple linear regression
Multiple linear regression
A researcher wants to better understand the market for renewable energy in the US. She wants to check whether women are more likely than men to say they are interested in purchasing renewable power. What test is most appropriate in this case?
Difference of two proportions
Chi-squared goodness of fit test
Chi-squared test of independence
ANOVA test of multiple means
Simple linear regression
A researcher wants to better understand the market for renewable energy in the US. She surveys a group of consumers before and after they subscribe to a renewable energy plan, to see whether their favorability towards renewable energy (on a 1-7 scale) has changed. What test is most appropriate in this case?
Chi-squared goodness of fit test
Difference of two independent means
Difference of two matched means
ANOVA test of multiple means
Simple linear regression
A researcher wants to better understand the market for renewable energy in the US. She surveys men and women to see if there is they have a different favorability level (on a 1-7 scale) regarding renewable energy. What test is most appropriate in this case?
Difference of two proportions
Chi-squared test of independence
Difference of two independent means
Difference of two matched means
Simple linear regression
A researcher wants to better understand the market for renewable energy in the US. She wants to see whether early adopters of a renewable energy program are split as expected between various demographic groups. What test is most appropriate in this case?
Chi-squared goodness of fit test
Chi-squared test of independence
Difference of two matched means
ANOVA test of multiple means
Simple linear regression
A study of “baby simulator” health education programs, in which high school students are given a lifelike doll which cries and requires attention, found that young women who took the “baby simulator” course were had a higher unplanned pregnancy rate than young women in traditional high school health classes. What can we infer about the test?
It was likely a one-tailed test, since it was not certain before the experiment that the effect of the class would be to increase the pregnancy rate.
It was likely a one-tailed test, since it was very clear before the experiment that the effect of the class would be to increase the pregnancy rate.
It was likely a two-tailed test, since it was not certain before the experiment that the effect of the class would be to increase the pregnancy rate.
It was likely a two-tailed test, since it was very clear before the experiment that the effect of the class would be to increase the pregnancy rate.
Suppose the study found that the 1267 students in the “baby simulator” classes had a unplanned pregnancy rate of 8% and the 1,567 in the “traditional” classes had a 4% unplanned pregnancy rate. Calculate a test statistic for this difference, assuming each group was a simple random sample of students. (The actual study design was slightly more complicated than a simple test of proportions in order to account for the effect of the school environment).
 b)
b)
c)  d)
d)  e) None of these
Suppose we wanted to check whether the students in the randomly selected classes were split across 3 demographic groups as expected. How many degrees of freedom for this chi squared goodness of fit test?
1 b) 2 c) 3 d) 4 e) None of these
The results of the study above were reported as “statistically significant”. What should that mean, assuming those reporting did their jobs correctly and honestly?
The p-value was large, indicating that this would be a likely outcome to result from random chance alone, if the two groups were equal.
The p-value was large, indicating that this would be a very unlikely outcome to result from random chance alone, if the two groups were equal.
The p-value was small, indicating that this would be a likely outcome to result from random chance alone, if the two groups were equal.
The p-value was small, indicating that this would be a very unlikely outcome to result from random chance alone, if the two groups were equal.
None of these
A psychologist suggests that individuals’ assessment of how much risk a child faces when left unattended might be affected by their moral judgments about the child’s parents. Respondents were told a child was left unattended in a car for various reasons- accidentally, to purchase drugs or alcohol, to pursue an affair, to go to work, and so on. In each case they were asked to rate the risk to the child on a scale from 1 to 10. An incomplete ANOVA table is shown below.
ANOVA Table for Risk Assessment by Reason
| Source | Sum of Squares | Df | Mean Square | F-Ratio | P-Value |
| Between groups | 56.356 | 0.0003 | |||
| Within groups | 32 | ||||
| Total (Corr.) | 106.776 |
How many “Reasons” were considered in this analysis?
1-3 b) 4-6 c) 7-9 d) 10-12 e) More than 12
How many responses were considered in this analysis?
36 b) 37 c) 38 d) 39 e) 40
What is the correct F statistic for this analysis (rounded to the nearest 0.01)?
9.39 b) 50.32 c) 1.58 d)5.96 e) None of these
What is the appropriate statistical conclusion based on this data?
It depends on our level of alpha- we would reject the null at 95% confidence but not at 90%
It depends on our level of alpha- we would reject the null at 90% confidence but not at 95%
For any reasonable level of alpha, we would reject the null hypothesis
For any reasonable level of alpha, we would fail to reject the null hypothesis
None of these
Many news outlets reporting on this study said that the different moral judgments caused different risk assessments. What would be different about this ANOVA table if we were looking for causation rather than just a relationship?
Relationships don’t mean causation, so the ANOVA table would give a smaller p-value
Relationships don’t mean causation, so the ANOVA table would give a larger p-value
Causation can only be seen in the difference of two means, not ANOVA
Causation can only be seen in linear regression, not ANOVA difference of multiple means.
The ANOVA table will be the same, regardless of whether a relationship is causal
Questions 18-20 are based on the simple linear regression shown below.
Using data from 50 countries, the regression uses minimum wage as the independent variable and youth unemployment as the dependent variable.
Simple Regression – Minimum Wage vs. Youth Unemployment
Dependent variable: Unemployment
Independent variable: Mimimum Wage
Linear model: Y = a + b*X
Coefficients
| Least Squares | Standard | T | ||
| Parameter | Estimate | Error | Statistic | P-Value |
| Intercept | 2.727 | 0.1505 | 18.12 | 0.0000 |
| Slope | -0.0174 | 0.0189 | -0.92 | 0.1781 |
Analysis of Variance
| Source | Sum of Squares | Df | Mean Square | F-Ratio | P-Value |
| Model | 908 | 0.1781 | |||
| Residual | |||||
| Total (Corr.) | 24741 |
Correlation Coefficient = -0.1897
R-squared = 3.67 percent
What are the numerator and denominator degrees of freedom for the F statistic?
1, 48 b) 1, 49 c) 2, 49 d) 2, 50 e) No way to tell
Use this regression equation to predict youth unemployment when minimum wage is $10.
2.553
2.901
27.253
27.287
None of these is within 0.01
What is the F statistic for the simple linear regression above?
0.18
1.87
2.71
908.00
None of these is within 0.01.
What does the p-value in the ANOVA table tell you?
There is evidence of a positive relationship between minimum wage and unemployment.
There is evidence of a negative relationship between minimum wage and unemployment.
There is evidence of no (0) relationship between minimum wage and unemployment
There is no evidence of a relationship here
None of these
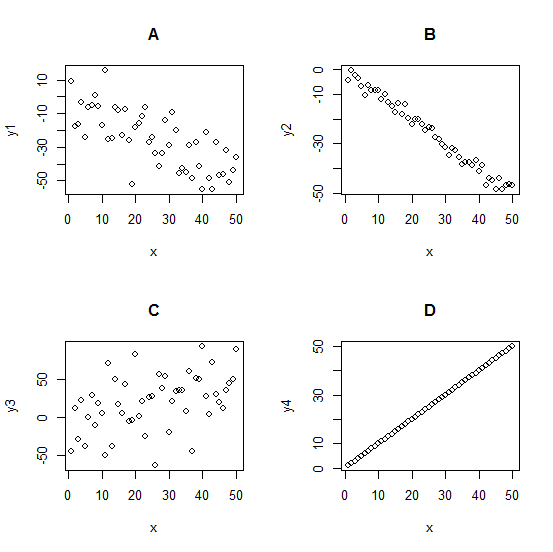
Which of the graphs above has a correlation of -0.73?
A b) B c) C d) D e) No way to tell
Which one of the graphs above has a correlation of 0.9999?
A b) B c) C d) D e) No way to tell
Which of the following is generally true about r squared values?
R squared gives the percentage of the variation explained by the equation
All experts agree that r squared values are important in data analysis
No experts believe r squared values are important in data analysis
R squared values below 0.05 or above 0.95 are “significant”.
None of these is generally true
The following statgraphics output refers to a model which predicts the max price of a car (based on 93 cars).
Multiple Regression - Max Price
Dependent variable: Max Price (price for a premium version in $1,000)
Independent variables:
Engine Size (liters)
Manual (0=no, 1=yes)
RPM (revs per minute at maximum horsepower)
Passengers (persons)
Weight (pounds)
| Standard | T | |||
| Parameter | Estimate | Error | Statistic | P-Value |
| CONSTANT | -41.4277 | 13.7084 | -3.02206 | 0.0033 |
| Engine Size | 2.10718 | 1.82522 | 1.15449 | 0.2515 |
| Manual | 0.04309 | 2.47903 | 0.0173818 | 0.9862 |
| RPM | 0.00582883 | 0.00179326 | 3.2504 | 0.0016 |
| Passengers | -2.90266 | 1.16609 | -2.48923 | 0.0147 |
| Weight | 0.0135572 | 0.0030473 | 4.44892 | 0.0000 |
Analysis of Variance
| Source | Sum of Squares | Df | Mean Square | F-Ratio | P-Value |
| Model | 6017.65 | 0.0000 | |||
| Residual | 5176.08 | ||||
| Total (Corr.) | 11193.7 |
R-squared = 53.7591 percent
R-squared (adjusted for d.f.) = 51.1016 percent
What are the residual degrees of freedom (marked with ? in the table) for this model?
87 b) 89 c) 91 d) 93 e) None of these
Based on the table of coefficients, how many predictors currently look “significant”?
1 b) 2 c) 3 d) 4 e) None of these
Which of the following makes sense given the model above?
Because the r squared is large enough, this is the best possible predictive model.
Because the p-value is small enough, this is the best possible predictive model.
If the p-value was above 0.05, this would be the best possible predictive model.
If the r squared value was above 95%, this would be the best possible predictive model.
None of these
What would be a reasonable “next step” to improve this model?
Remove “manual” and re-calculate
Remove “weight” and re-calculate
Remove “passengers” and re-calculate
Any of the above
None of the above
[5 points] Bayesian statisticians use a “subjective” definition of probability, that a prediction or forecast should reflect a degree of personal belief. Traditional frequentist statisticians use an “objective” definition of probability, based on the idea of many (hypothetically) repeated trials. Which of these two approaches makes more sense to you, and why?
[5 points] Based on what you know about biases and heuristics, do you believe they support the use of statistical approaches, or undermine the use of statistical approaches? Explain your reasoning.
Bonus (up to 3 points): Write and answer one question you were prepared for but did not appear on this exam. (1 point for a boring correct answer, 2 points for an interesting correct answer, 3 points for an exceptionally insightful correct answer).


